This report was recently updated on August 28 2025 with the latest and most recent
market numbers
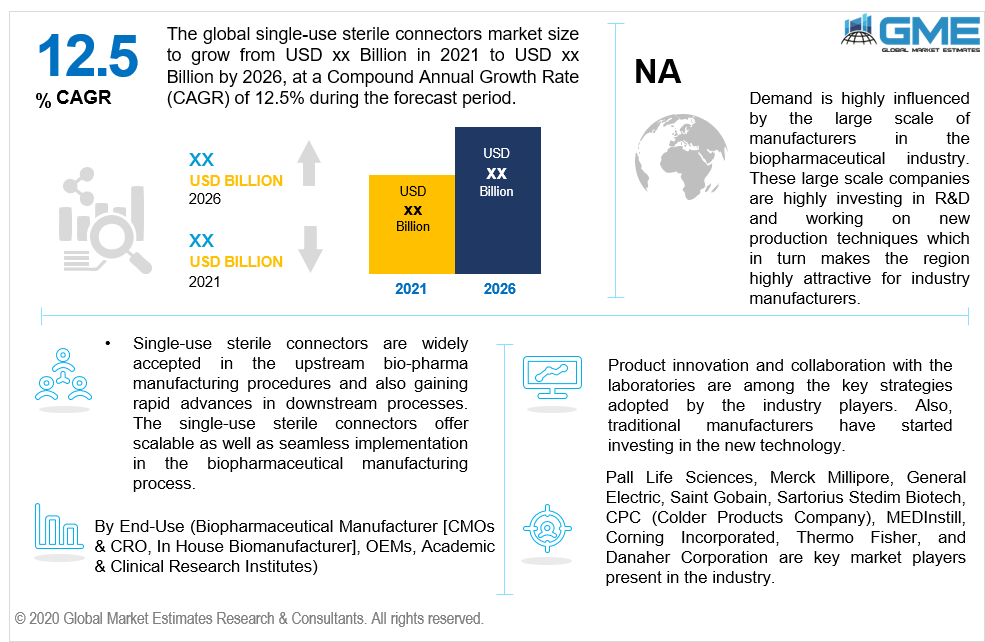
Global Single-Use Sterile Connectors Market Size, Trends & Analysis - Forecasts to 2026 By Product (Gendered, Genderless), By End-Use (Biopharmaceutical Manufacturer [CMOs & CRO, In House Biomanufacturer], OEMs, Academic & Clinical Research Institutes), By Region (North America, Asia Pacific, Europe, Latin America, Middle East & Africa); End-User Landscape, Company Market Share Analysis, and Competitor Analysis
Addressing critical issues regarding batch automation, contamination, and risking product quality has influenced biopharmaceutical manufacturers to adopt different manufacturing processes and more advanced products. Single-use pharmaceutical products are an adaptive approach towards modernizing the healthcare industry by minimizing the risk associated with the traditional approach.
Single-use sterile connectors are widely accepted in the upstream bio-pharma manufacturing procedures and also gaining rapid advances in downstream processes. The single-use sterile connectors offer scalable as well as seamless implementation in the biopharmaceutical manufacturing process.
Initially, the disposable production processes were largely adopted for lower manufacturing volume to meet clinical requirements. This technology does not necessitate the requirement of bioreactor cleaning and sterilization, which in turn saves time and minimizes the stress on manufacturing staff.
Less manufacturing cost in comparison with the traditional steel bioreactor technologies will drive the Single-Use Sterile Connectors Demand. However, higher variable cost association regarding disposable component replacement may pose a threat against pharmaceutical waste management.
Advantages such as easy operation transferability, flexible manufacturing, and fast change over are promoting the single-use sterile connectors market growth. As per BioPlan Associates, the disposable technology in the biopharmaceutical industry will witness an expansion of around 18% in the coming years. The company also reported that over 90% of pharma facilities have adopted a disposable production process while deciding for the manufacturing technique. In the same study, it is stated that around 68% of the respondents showed positive changes in their manufacturing with disposable technologies.
Single-use connectors are approved as the best alternative in biopharmaceuticals manufacturing as they eliminate the cleaning requirement & authentication which result in faster turnaround times with minimal capital requirement. Also, they eradicate cross-contamination risk which provides an ideal setup for multi-product facilities.
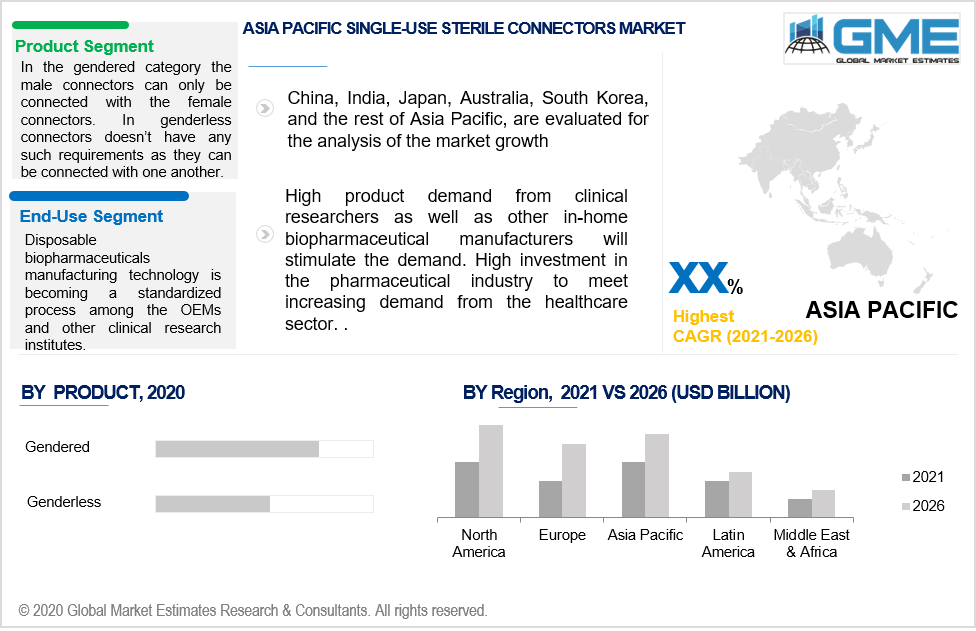
Single-use sterile connectors market can be categorized into gendered and genderless connectors. In the gendered category, the male connectors can only be connected with the female connectors. However, genderless connectors don’t have any such requirements as they can be connected with one another.
Both the disposable sterile connectors hold advantages depending on their applicability. Providing better flexibility while installing the single-use systems without facing any complexity regarding the inventory and stock counting maintenance will drive the genderless single-use sterile connectors market growth. However, gendered connectors reduce the operating error risk as they cannot be connected incorrectly.
As per the 11th Annual Report by BioPlan, it is surveyed that around three quarters of the respondents expressed their willingness to adopt genderless connectors for their larger-scale biopharmaceutical manufacturing process. Though, risk mitigation was their greatest concern which enforced them to choose gendered connectors on a practical approach.
By end-use, the single-use sterile connectors market is segmented into pharmaceutical manufacturers, original equipment manufacturers, and academic & clinical research institutes. Biopharmaceutical manufacturers are predicted to witness significant growth during the forecast period owing to the rising demand for single-use sterile connectors among the CMOs. These providers are involved in inventory expansion by adopting new bioprocessing techniques.
Disposable biopharmaceutical manufacturing technology is becoming a standardized process among the OEMs and other clinical research institutes. Vendors are keen to standardize the overall process to overcome the high cost and infrastructure.
North American single-use sterile connectors accounted for a significant share in 2020. The regional demand is highly influenced by the large scale of manufacturers in the biopharmaceutical industry. These large-scale companies are highly investing in R&D and working on new production techniques which in turn makes the region highly attractive for industry manufacturers.
The Asia Pacific region will witness the highest gains during the forecast period. High product demand from clinical researchers as well as other in-home biopharmaceutical manufacturers will stimulate the demand. High investment in the pharmaceutical industry to meet increasing demand from the healthcare sector.
Single-Use Sterile Connectors Market share is highly concentrated in nature due to the presence of limited and large-scale manufacturers in the industry. Pall Life Sciences, Merck Millipore, General Electric, Saint Gobain, Sartorius Stedim Biotech, CPC (Colder Products Company), MEDInstill, Corning Incorporated, Thermo Fisher, and Danaher Corporation are key market players present in the industry.
Please note: This is not an exhaustive list of companies profiled in the report.
Product innovation and collaboration with the laboratories are among the key strategies adopted by the industry players. Also, traditional manufacturers have started investing in the new technology.
Other key players include Vante, JM BIOCONNECT, PBS Biotech, Inc, ENTEGRIS, INC., LONZA, Medtech Devices, Advin Healthcare, Med Solution, Laproworld Instrument Company, Msn Enterprises, and Piomed Surgical Industries.
Chapter 1 Methodology
1.1 Market scope & definitions
1.2 Estimates & forecast calculation
1.3 Historical data overview and validation
1.4 Data sources
1.4.1 Secondary
1.4.2 Primary
Chapter 2 Report Outlook
2.1 Single-Use Sterile Connectors Market industry overview, 2016-2026
2.1.1 Industry overview
2.1.2 Product overview
2.1.3 End-Use overview
2.1.4 Regional overview
Chapter 3 Single-Use Sterile Connectors Market Trends
3.1 Market segmentation
3.2 Industry background, 2016-2026
3.3 Market key trends
3.3.1 Positive trends
3.3.2 Industry challenges
3.4 Prospective growth scenario
3.4.1 Product growth scenario
3.4.2 Distribution channel growth scenario
3.5 COVID-19 influence over industry growth
3.6 Porter’s analysis
3.7 PESTEL analysis
3.8 Value chain & supply chain analysis
3.9 Regulatory framework
3.9.1 North America
3.9.2 Europe
3.9.3 APAC
3.9.4 LATAM
3.9.5 MEA
3.10 Product innovation
3.11 Market share analysis, 2020
3.11.1 Company positioning overview, 2020
Chapter 4 Single-Use Sterile Connectors Market, By Product
4.1 Product Outlook
4.2 Gendered
4.2.1 Market size, by region, 2016-2026 (USD Million)
4.3 Genderless
4.3.1 Market size, by region, 2016-2026 (USD Million)
Chapter 5 Single-Use Sterile Connectors Market, By End-Use
5.1 End-Use Outlook
5.2 Biopharmaceutical Manufacturer
5.2.1 Market size, by region, 2016-2026 (USD Million)
5.2.2 CMOs & CROs
5.2.2.1 Market size, by region, 2016-2026 (USD Million)
5.2.3 In-house bio manufacturer
5.2.3.1 Market size, by region, 2016-2026 (USD Million)
5.3 OEMs
5.3.1 Market size, by region, 2016-2026 (USD Million)
5.4 Academic & Clinical Research Institutes
5.4.1 Market size, by region, 2016-2026 (USD Million)
5.5 Others
5.5.1 Market size, by region, 2016-2026 (USD Million)
Chapter 6 Dried Baby Food Market, By Region
6.1 Regional outlook
6.2 North America
6.2.1 Market size, by country 2016-2026 (USD Million)
6.2.2 Market size, by product, 2016-2026 (USD Million)
6.2.3 Market size, by end-use, 2016-2026 (USD Million)
6.2.4 U.S.
6.2.4.1 Market size, by product, 2016-2026 (USD Million)
6.2.4.2 Market size, by end-use, 2016-2026 (USD Million)
6.2.5 Canada
6.2.5.1 Market size, by product, 2016-2026 (USD Million)
6.2.5.2 Market size, by end-use, 2016-2026 (USD Million)
6.3 Europe
6.3.1 Market size, by country 2016-2026 (USD Million)
6.3.2 Market size, by product, 2016-2026 (USD Million)
6.3.3 Market size, by end-use, 2016-2026 (USD Million)
6.3.4 Germany
6.2.4.1 Market size, by product, 2016-2026 (USD Million)
6.2.4.2 Market size, by end-use, 2016-2026 (USD Million)
6.3.5 UK
6.3.5.1 Market size, by product, 2016-2026 (USD Million)
6.3.5.2 Market size, by end-use, 2016-2026 (USD Million)
6.3.6 France
6.3.6.1 Market size, by product, 2016-2026 (USD Million)
6.3.6.2 Market size, by end-use, 2016-2026 (USD Million)
6.3.7 Italy
6.3.7.1 Market size, by product, 2016-2026 (USD Million)
6.3.7.2 Market size, by end-use, 2016-2026 (USD Million)
6.3.8 Spain
6.3.8.1 Market size, by product, 2016-2026 (USD Million)
6.3.8.2 Market size, by end-use, 2016-2026 (USD Million)
6.3.9 Russia
6.3.9.1 Market size, by product, 2016-2026 (USD Million)
6.3.9.2 Market size, by end-use, 2016-2026 (USD Million)
6.4 Asia Pacific
6.4.1 Market size, by country 2016-2026 (USD Million)
6.4.2 Market size, by product, 2016-2026 (USD Million)
6.4.3 Market size, by end-use, 2016-2026 (USD Million)
6.4.4 China
6.4.4.1 Market size, by product, 2016-2026 (USD Million)
6.4.4.2 Market size, by end-use, 2016-2026 (USD Million)
6.4.5 India
6.4.5.1 Market size, by product, 2016-2026 (USD Million)
6.4.5.2 Market size, by end-use, 2016-2026 (USD Million)
6.4.6 Japan
6.4.6.1 Market size, by product, 2016-2026 (USD Million)
6.4.6.2 Market size, by end-use, 2016-2026 (USD Million)
6.4.7 Australia
6.4.7.1 Market size, by product, 2016-2026 (USD Million)
6.4.7.2 Market size, by end-use, 2016-2026 (USD Million)
6.4.8 South Korea
6.4.8.1 Market size, by product, 2016-2026 (USD Million)
6.4.8.2 Market size, by end-use, 2016-2026 (USD Million)
6.5 Latin America
6.5.1 Market size, by country 2016-2026 (USD Million)
6.5.2 Market size, by product, 2016-2026 (USD Million)
6.5.3 Market size, by end-use, 2016-2026 (USD Million)
6.5.4 Brazil
6.5.4.1 Market size, by product, 2016-2026 (USD Million)
6.5.4.2 Market size, by end-use, 2016-2026 (USD Million)
6.5.5 Mexico
6.5.5.1 Market size, by product, 2016-2026 (USD Million)
6.5.5.2 Market size, by end-use, 2016-2026 (USD Million)
6.5.6 Argentina
6.5.6.1 Market size, by product, 2016-2026 (USD Million)
6.5.6.2 Market size, by end-use, 2016-2026 (USD Million)
6.6 MEA
6.6.1 Market size, by country 2016-2026 (USD Million)
6.6.2 Market size, by product, 2016-2026 (USD Million)
6.6.3 Market size, by end-use, 2016-2026 (USD Million)
6.6.4 Saudi Arabia
6.6.4.1 Market size, by product, 2016-2026 (USD Million)
6.6.4.2 Market size, by end-use, 2016-2026 (USD Million)
6.6.5 UAE
6.6.5.1 Market size, by product, 2016-2026 (USD Million)
6.6.5.2 Market size, by end-use, 2016-2026 (USD Million)
6.6.6 South Africa
6.6.6.1 Market size, by product, 2016-2026 (USD Million)
6.6.6.2 Market size, by end-use, 2016-2026 (USD Million)
Chapter 7 Company Landscape
7.1 Competitive analysis, 2020
7.2 Pall Life Sciences
7.2.1 Company overview
7.2.2 Financial analysis
7.2.3 Strategic positioning
7.2.4 Info graphic analysis
7.3 Merck Millipore
7.3.1 Company overview
7.3.2 Financial analysis
7.3.3 Strategic positioning
7.3.4 Info graphic analysis
7.4 Sartorius Stedim Biotech
7.4.1 Company overview
7.4.2 Financial analysis
7.4.3 Strategic positioning
7.4.4 Info graphic analysis
7.5 General Electric
7.5.1 Company overview
7.5.2 Financial analysis
7.5.3 Strategic positioning
7.5.4 Info graphic analysis
7.6 Saint Gobain
7.6.1 Company overview
7.6.2 Financial analysis
7.6.3 Strategic positioning
7.6.4 Info graphic analysis
7.7 CPC (Colder Products Company)
7.7.1 Company overview
7.7.2 Financial analysis
7.7.3 Strategic positioning
7.7.4 Info graphic analysis
7.8 MEDInstill
7.8.1 Company overview
7.8.2 Financial analysis
7.8.3 Strategic positioning
7.8.4 Info graphic analysis
7.9 Vante
7.9.1 Company overview
7.9.2 Financial analysis
7.9.3 Strategic positioning
7.9.4 Info graphic analysis
7.10 Corning Incorporated
7.10.1 Company overview
7.10.2 Financial analysis
7.10.3 Strategic positioning
7.10.4 Info graphic analysis
7.11 Thermo Fisher Scientific, Inc
7.11.1 Company overview
7.11.2 Financial analysis
7.11.3 Strategic positioning
7.11.4 Info graphic analysis
7.12 JM BIOCONNECT
7.12.1 Company overview
7.12.2 Financial analysis
7.12.3 Strategic positioning
7.12.4 Info graphic analysis
7.13 PBS Biotech, Inc
7.13.1 Company overview
7.13.2 Financial analysis
7.13.3 Strategic positioning
7.13.4 Info graphic analysis
7.14 ENTEGRIS, INC
7.14.1 Company overview
7.14.2 Financial analysis
7.14.3 Strategic positioning
7.14.4 Info graphic analysis
7.15 LONZA
7.15.1 Company overview
7.15.2 Financial analysis
7.15.3 Strategic positioning
7.15.4 Info graphic analysis
7.16 Danaher Corporation
7.16.1 Company overview
7.16.2 Financial analysis
7.16.3 Strategic positioning
7.16.4 Info graphic analysis
7.17 Medtech Devices
7.17.1 Company overview
7.17.2 Financial analysis
7.17.3 Strategic positioning
7.17.4 Info graphic analysis
7.18 Advin Health Care
7.18.1 Company overview
7.18.2 Financial analysis
7.18.3 Strategic positioning
7.18.4 Info graphic analysis
7.19 Med Solution
7.19.1 Company overview
7.19.2 Financial analysis
7.19.3 Strategic positioning
7.19.4 Info graphic analysis
7.20 Laproworld Instrument Company
7.20.1 Company overview
7.20.2 Financial analysis
7.20.3 Strategic positioning
7.20.4 Info graphic analysis
7.21 Msn Enterprises
7.21.1 Company overview
7.21.2 Financial analysis
7.21.3 Strategic positioning
7.21.4 Info graphic analysis
7.22 Piomed Surgical Industries
7.22.1 Company overview
7.22.2 Financial analysis
7.22.3 Strategic positioning
7.22.4 Info graphic analysis
The Global Single-Use Sterile Connectors Market has been studied from the year 2019 till 2026. However, the CAGR provided in the report is from the year 2021 to 2026. The research methodology involved three stages: Desk research, Primary research, and Analysis & Output from the entire research process.

The desk research involved a robust background study which meant referring to paid and unpaid databases to understand the market dynamics; mapping contracts from press releases; identifying the key players in the market, studying their product portfolio, competition level, annual reports/SEC filings & investor presentations; and learning the demand and supply-side analysis for the Single-Use Sterile Connectors Market.

The primary research activity included telephonic conversations with more than 50 tier 1 industry consultants, distributors, and end-use product manufacturers.

Finally, based on the above thorough research process, an in-depth analysis was carried out considering the following aspects: market attractiveness, current & future market trends, market share analysis, SWOT analysis of the company and customer analytics.

![Global Single-Use Sterile Connectors Market Size, Trends & Analysis - Forecasts to 2026 By Product (Gendered, Genderless), By End-Use (Biopharmaceutical Manufacturer [CMOs & CRO, In House Biomanufacturer], OEMs, Academic & Clinical Research Institutes), By Region (North America, Asia Pacific, Europe, Latin America, Middle East & Africa); End-User Landscape, Company Market Share Analysis, and Competitor Analysis](https://www.globalmarketestimates.com/images/cat/Healthcare.png)
This FREE sample includes market data points, ranging from trend analyses to market estimates & forecasts. See for yourself.
Or view our licence options:
Tailor made solutions just for you
80% of our clients seek made-to-order reports. How do you want us to tailor yours?
OUR CLIENTS


