This report was recently updated on August 27 2025 with the latest and most recent
market numbers
Global Smart Card Market Size, Trends & Analysis - Forecasts to 2026 By Interface (Contact, Contactless, and Dual), By Type (Memory and MPU Microprocessor), By Functionality (Transaction, Communication, Security and Access Control), By Offering (Smart Card and Smart Card Readers), By Vertical (BFSI, Telecommunications, Government and Healthcare, Education, Retail, Transportation, and Others), Landscape, Company Market Share Analysis, and Competitor Analysis
A smart card is fixed with small electronic components consisting of an integrated chip which is the size of a photo identity card or a credit card. They are read either by scanning process by assessing the embedded chip in the card by a scanner or through wireless internet connectivity or by swipe in process in a machine. Smart cards are significant for security purposes. During the time of expanding security hacks and challenges, smart cards give clients and organizations additional assurance for exchanges and record data. Exchanges made with smart cards are encoded to secure the exchange of data from one end to another. Each encoded exchange can't be hacked and doesn't transfer any extra data past what's required for finishing the single exchange.
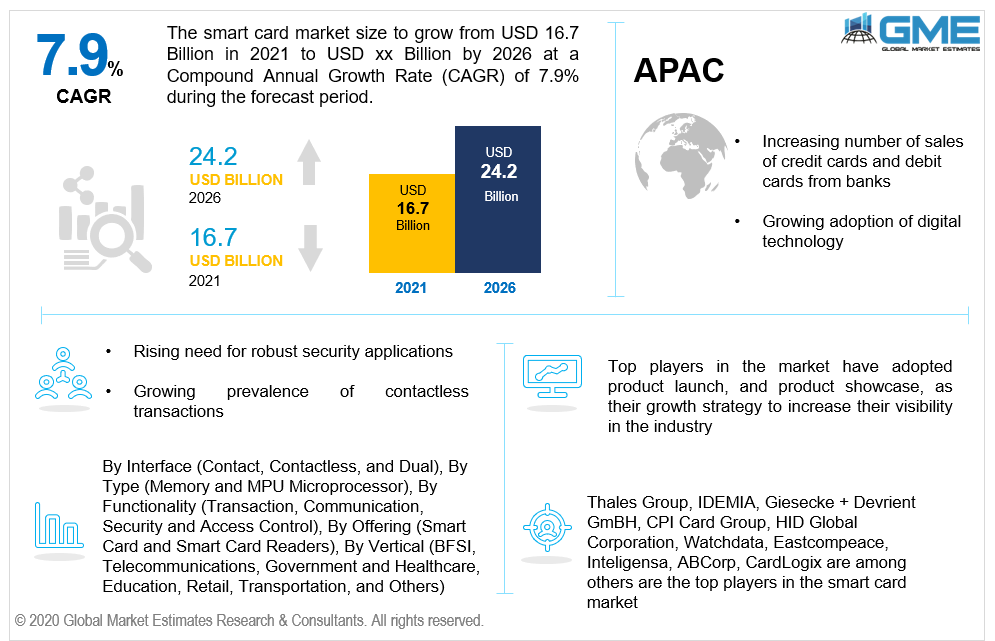
The factors driving this market are the inception of contactless transactions, the secured method of any kind of transaction, the increasing number of sales of credit cards and debit cards from banks, the rise in requirement of security applications, and growing awareness among people for contactless cards for safety reasons. Moreover, the increasing use of biometric setups in organizations authenticates a person’s validity via retina scan or card scan embedded with a chip drives the market further. Attractive offers that card-making companies provide while marketing their product is increasing the overall sales of smart cards in the banking sector.
Smart cards carry enormous potential in sophisticated security systems, as a smart card combined with a PIN allows two-factor access control in a far more reliable manner. Business technological advances have resulted in the introduction of cards that enable authentication to establish seamless accessibility and enhanced authentication for full access to facilities and computer systems.?
Based on interface type, the smart card can be segregated into contact, contactless, and dual. The contactless segment has the highest market share as the per-interface outlook is considered owing to people's demand for safe transactions. Contactless smart cards are distinguished from contact-based smart cards by the absence of a conspicuous chip on the wallet. The processor and its transmitter are rather incorporated inside the card's shell. Contactless transfers are cryptographically encrypted, and each transaction generates a special code. Amid COVID-19, this is the safest option which makes it witness skyrocketing demand in the global market.
Based on type, the smart card can be segregated into memory and MPU microprocessor. The MPU microprocessor segment is leading in this segment because products with integrated MPU microprocessors allow users to provide secure payment, identification, and data processing to their customers. Moreover, since production and processing prices are minimal, the technology aids in lowering operating costs.
Based on the functionality, the smart card market can be segregated into the transaction, communication, security, and access control. As per functionality is concerned, the transaction segment has an edge over others because the contactless framework is becoming increasingly important in the ongoing COVID-19 environment, particularly for payment systems as it enables fast and protected transactions without physical interaction.
Based on offering the smart card market can be segregated into the smart card and smart card readers. The smart card is the dominant segment as per offerings because they are primarily being used as a stored value tool, especially in loyalty programs in industries such as transport systems parking, and retailers, which monitor information and provide rewards to maintain their target consumer demographics. ?
Based on vertical, the smart card market can be segregated into BFSI, telecommunications, government and healthcare, education, retail, transportation, and others. The telecommunications segment held the top spot as per vertical owing to the increasing number of mobile phone users globally. The demand is growing as the global telecommunications network expands and technology improves. Furthermore, COVID-19 boosted the need for connectivity.
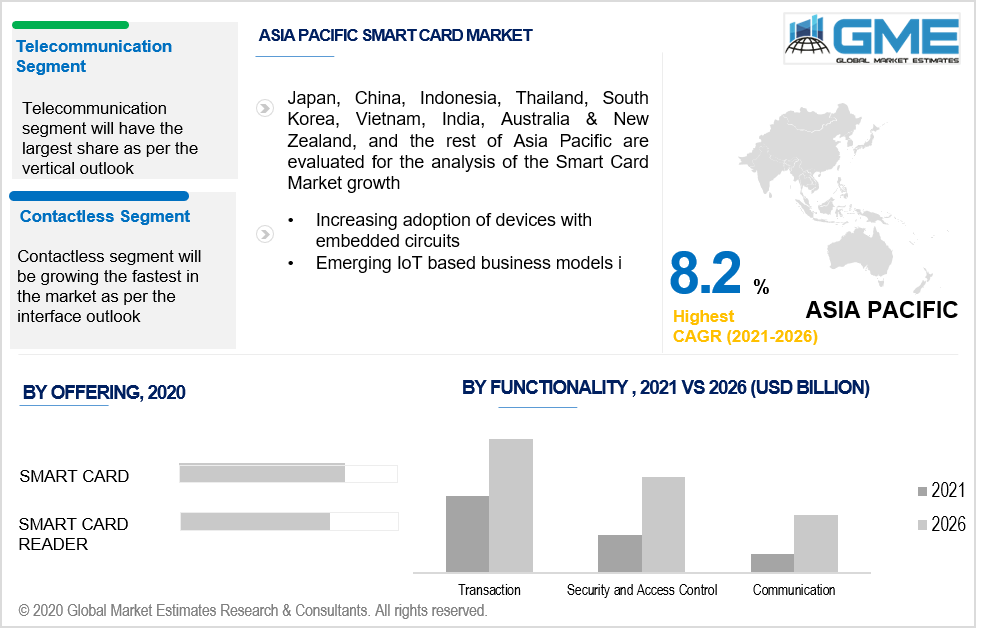
As per the geographical analysis, the market of Smart Card can be classified into North America (the US, Canada, and Mexico), Asia Pacific (India, China, Japan, Malaysia, Singapore, and Rest of Asia Pacific), Europe (Germany, United Kingdom, Italy, France, Spain, Netherlands, and Rest of Europe), Middle East & Africa and Central South America. The Asia Pacific is dominating this market and is also the fastest-growing market. The reason for this growth is the adoption of digital technology by various countries in their daily uses or various sectors such as banking, government process, etc. The need for safer payment options among people in this region is further driving the demand. North America is also emerging in this market owing to the highest usage of credit cards and growing technological advancements in the region. Moreover, the dynamic financial infrastructure that is rapidly being digitized, as well as government departments adopting smart chip-based platforms for improved system integration, are driving many North American countries to incorporate smart card solutions due to growing demand from various end-users.
Thales Group, IDEMIA, Giesecke + Devrient GmBH, CPI Card Group, HID Global Corporation, Watchdata, Eastcompeace, Inteligensa, ABCorp, CardLogix among others are the top players in the smart card market.
Please note: This is not an exhaustive list of companies profiled in the report.
Chapter 1 Methodology
1.1 Market Scope & Definitions
1.2 Estimates & Forecast Calculation
1.3 Historical Data Overview And Validation
1.4 Data Sources
1.4.1 Secondary
1.4.2 Primary
Chapter 2 Report Outlook
2.1 Smart Card Overview, 2019-2026
2.1.1 Industry Overview
2.1.2 Interface Overview
2.1.3 Type Overview
2.1.4 Functionality Overview
2.1.5 Offering Overview
2.1.6 Vertical Overview
2.1.7 Regional Overview
Chapter 3 Smart Card Market Trends
3.1 Market Segmentation
3.2 Industry Background, 2019-2026
3.3 Market Key Trends
3.3.1 Positive Trends
3.3.1.1 Awareness among people for contact less cards for
safety reasons
3.3.1.2 The rise in requirement of security applications
3.3.2 Industry Challenges
3.3.2.1 Involves high cost at initial stage
3.4 Prospective Growth Scenario
3.4.1 Interface Scenario
3.4.2 Type Scenario
3.4.3 Functionality Scenario
3.4.4 Offering Scenario
3.4.5 Vertical Scenario
3.5 COVID-19 Influence over Industry Growth
3.6 Porter’s Analysis
3.7 PESTEL Analysis
3.8 Value Chain & Supply Chain Analysis
3.9 Regulatory Framework
3.9.1 North America
3.9.2 Europe
3.9.3 APAC
3.9.4 LATAM
3.9.5 MEA
3.10 Technology Overview
3.11 Market Share Analysis, 2020
3.11.1 Company Positioning Overview, 2020
Chapter 4 Smart Card Market, By Interface
4.1 Interface Outlook
4.2 Contact
4.2.1 Market Size, By Region, 2019-2026 (USD Million)
4.3 Contactless
4.3.1 Market Size, By Region, 2019-2026 (USD Million)
4.4 Dual
4.4.1 Market Size, By Region, 2019-2026 (USD Million)
Chapter 5 Smart Card Market, By Type
5.1 Type Outlook
5.2 Memory
5.2.1 Market Size, By Region, 2019-2026 (USD Million)
5.3 MPU Microprocessor
5.3.1 Market Size, By Region, 2019-2026 (USD Million)
Chapter 6 Smart Card Market, By Functionality
6.1 Functionality Outlook
6.2 Transaction
6.2.1 Market Size, By Region, 2019-2026 (USD Million)
6.3 Communication, Security and Access Control
6.3.1 Market Size, By Region, 2019-2026 (USD Million)
6.3 Security and Access Control
6.3.1 Market Size, By Region, 2019-2026 (USD Million)
Chapter 7 Smart Card Market, By Offering
7.1 Offering Outlook
7.2 Smart Card
7.2.1 Market Size, By Region, 2019-2026 (USD Million)
7.3 Smart Card Readers
7.3.1 Market Size, By Region, 2019-2026 (USD Million)
Chapter 8 Smart Card Market, By Vertical
8.1 Vertical Outlook
8.2 BFSI
8.2.1 Market Size, By Region, 2019-2026 (USD Million)
8.3 Telecommunications
8.3.1 Market Size, By Region, 2019-2026 (USD Million)
8.4 Government and Healthcare
8.4.1 Market Size, By Region, 2019-2026 (USD Million)
8.5 Education
8.5.1 Market Size, By Region, 2019-2026 (USD Million)
8.6 Retail
8.6.1 Market Size, By Region, 2019-2026 (USD Million)
8.7 Transportation
8.7.1 Market Size, By Region, 2019-2026 (USD Million)
8.8 Others
8.8.1 Market Size, By Region, 2019-2026 (USD Million)
Chapter 9 Smart Card Market, By Region
9.1 Regional outlook
9.2 North America
9.2.1 Market Size, By Country 2019-2026 (USD Million)
9.2.2 Market Size, By Interface, 2019-2026 (USD Million)
9.2.3 Market Size, By Type, 2019-2026 (USD Million)
9.2.4 Market Size, By Functionality, 2019-2026 (USD Million)
9.2.5 Market Size, By Offering, 2019-2026 (USD Million)
9.2.5 Market Size, By Vertical, 2019-2026 (USD Million)
9.2.6 U.S.
9.2.6.1 Market Size, By Interface, 2019-2026 (USD Million)
9.2.6.2 Market Size, By Type, 2019-2026 (USD Million)
9.2.6.3 Market Size, By Functionality, 2019-2026 (USD Million)
9.2.6.4 Market Size, By Offering, 2019-2026 (USD Million)
9.2.6.5 Market Size, By Vertical, 2019-2026 (USD Million)
9.2.7 Canada
9.2.7.1 Market Size, By Interface, 2019-2026 (USD Million)
9.2.7.2 Market Size, By Type, 2019-2026 (USD Million)
9.2.7.3 Market Size, By Functionality, 2019-2026 (USD Million)
9.2.7.4 Market Size, By Offering, 2019-2026 (USD Million)
9.2.7.5 Market Size, By Vertical, 2019-2026 (USD Million)
9.3 Europe
9.3.1 Market Size, By Country 2019-2026 (USD Million)
9.3.2 Market Size, By Interface, 2019-2026 (USD Million)
9.3.3 Market Size, By Type, 2019-2026 (USD Million)
9.3.4 Market Size, By Functionality, 2019-2026 (USD Million)
9.3.5 Market Size, By Offering, 2019-2026 (USD Million)
9.3.6 Market Size, By Vertical, 2019-2026 (USD Million)
9.3.7 Germany
9.2.7.1 Market Size, By Interface, 2019-2026 (USD Million)
9.2.7.2 Market Size, By Type, 2019-2026 (USD Million)
9.2.7.3 Market Size, By Functionality, 2019-2026 (USD Million)
9.2.7.4 Market Size, By Offering, 2019-2026 (USD Million)
9.2.7.5 Market Size, By Vertical, 2019-2026 (USD Million)
9.3.8 UK
9.3.8.1 Market Size, By Interface, 2019-2026 (USD Million)
9.3.8.2 Market Size, By Type, 2019-2026 (USD Million)
9.3.8.3 Market Size, By Functionality, 2019-2026 (USD Million)
9.3.8.4 Market Size, By Offering, 2019-2026 (USD Million)
9.3.8.5 Market Size, By Vertical, 2019-2026 (USD Million)
9.3.9 France
9.3.9.1 Market Size, By Interface, 2019-2026 (USD Million)
9.3.9.2 Market Size, By Type, 2019-2026 (USD Million)
9.3.9.3 Market Size, By Functionality, 2019-2026 (USD Million)
9.3.9.4 Market Size, By Offering, 2019-2026 (USD Million)
9.3.9.5 Market Size, By Vertical, 2019-2026 (USD Million)
9.3.10 Italy
9.3.10.1 Market Size, By Interface, 2019-2026 (USD Million)
9.3.10.2 Market Size, By Type, 2019-2026 (USD Million)
9.3.10.3 Market Size, By Functionality, 2019-2026 (USD Million)
9.3.10.4 Market Size, By Offering, 2019-2026 (USD Million)
9.3.10.5 Market Size, By Vertical, 2019-2026 (USD Million)
9.3.11 Spain
9.3.11.1 Market Size, By Interface, 2019-2026 (USD Million)
9.3.11.2 Market Size, By Type, 2019-2026 (USD Million)
9.3.11.3 Market Size, By Functionality, 2019-2026 (USD Million)
9.3.11.4 Market Size, By Offering, 2019-2026 (USD Million)
9.3.11.5 Market Size, By Vertical, 2019-2026 (USD Million)
9.3.12 Russia
9.3.12.1 Market Size, By Interface, 2019-2026 (USD Million)
9.3.12.2 Market Size, By Type, 2019-2026 (USD Million)
9.3.12.3 Market Size, By Functionality, 2019-2026 (USD Million)
9.3.12.4 Market Size, By Offering, 2019-2026 (USD Million)
9.3.12.5 Market Size, By Vertical, 2019-2026 (USD Million)
9.4 Asia Pacific
9.4.1 Market Size, By Country 2019-2026 (USD Million)
9.4.2 Market Size, By Interface, 2019-2026 (USD Million)
9.4.3 Market Size, By Type, 2019-2026 (USD Million)
9.4.4 Market Size, By Functionality, 2019-2026 (USD Million)
9.4.5 Market Size, By Offering, 2019-2026 (USD Million)
9.4.6 Market Size, By Vertical, 2019-2026 (USD Million)
9.4.7 China
9.4.7.1 Market Size, By Interface, 2019-2026 (USD Million)
9.4.7.2 Market Size, By Type, 2019-2026 (USD Million)
9.4.7.3 Market Size, By Functionality, 2019-2026 (USD Million)
9.4.7.4 Market Size, By Offering, 2019-2026 (USD Million)
9.4.7.5 Market Size, By Vertical, 2019-2026 (USD Million)
9.4.8 India
9.4.8.1 Market Size, By Interface, 2019-2026 (USD Million)
9.4.8.2 Market Size, By Type, 2019-2026 (USD Million)
9.4.8.3 Market Size, By Functionality, 2019-2026 (USD Million)
9.4.8.4 Market Size, By Offering, 2019-2026 (USD Million)
9.4.8.5 Market Size, By Vertical, 2019-2026 (USD Million)
9.4.9 Japan
9.4.9.1 Market Size, By Interface, 2019-2026 (USD Million)
9.4.9.2 Market Size, By Type, 2019-2026 (USD Million)
9.4.9.3 Market Size, By Functionality, 2019-2026 (USD Million)
9.4.9.4 Market Size, By Offering, 2019-2026 (USD Million)
9.4.9.5 Market Size, By Vertical, 2019-2026 (USD Million)
9.4.10 Australia
9.4.10.1 Market Size, By Interface, 2019-2026 (USD Million)
9.4.10.2 Market size, By Type, 2019-2026 (USD Million)
9.4.10.3 Market size, By Functionality, 2019-2026 (USD Million)
9.4.10.4 Market size, By Offering, 2019-2026 (USD Million)
9.4.10.5 Market size, By Vertical, 2019-2026 (USD Million)
9.4.11 South Korea
9.4.11.1 Market Size, By Interface, 2019-2026 (USD Million)
9.4.11.2 Market Size, By Type, 2019-2026 (USD Million)
9.4.11.3 Market Size, By Functionality, 2019-2026 (USD Million)
9.4.11.4 Market Size, By Offering, 2019-2026 (USD Million)
9.4.11.5 Market Size, By Vertical, 2019-2026 (USD Million)
9.5 Latin America
9.5.1 Market Size, By Country 2019-2026 (USD Million)
9.5.2 Market Size, By Interface, 2019-2026 (USD Million)
9.5.3 Market Size, By Type, 2019-2026 (USD Million)
9.5.4 Market Size, By Functionality, 2019-2026 (USD Million)
9.5.5 Market Size, By Offering, 2019-2026 (USD Million)
9.5.6 Market Size, By Vertical, 2019-2026 (USD Million)
9.5.7 Brazil
9.5.7.1 Market Size, By Interface, 2019-2026 (USD Million)
9.5.7.2 Market Size, By Type, 2019-2026 (USD Million)
9.5.7.3 Market Size, By Functionality, 2019-2026 (USD Million)
9.5.7.4 Market Size, By Offering, 2019-2026 (USD Million)
9.5.7.5 Market Size, By Vertical, 2019-2026 (USD Million)
9.5.8 Mexico
9.5.8.1 Market Size, By Interface, 2019-2026 (USD Million)
9.5.8.2 Market Size, By Type, 2019-2026 (USD Million)
9.5.8.3 Market Size, By Functionality, 2019-2026 (USD Million)
9.5.8.4 Market Size, By Offering, 2019-2026 (USD Million)
9.5.8.5 Market Size, By Vertical, 2019-2026 (USD Million)
9.5.9 Argentina
9.5.9.1 Market Size, By Interface, 2019-2026 (USD Million)
9.5.9.2 Market Size, By Type, 2019-2026 (USD Million)
9.5.9.3 Market Size, By Functionality, 2019-2026 (USD Million)
9.5.9.4 Market Size, By Offering, 2019-2026 (USD Million)
9.5.9.5 Market Size, By Vertical, 2019-2026 (USD Million)
9.6 MEA
9.6.1 Market Size, By Country 2019-2026 (USD Million)
9.6.2 Market Size, By Interface, 2019-2026 (USD Million)
9.6.3 Market Size, By Type, 2019-2026 (USD Million)
9.6.4 Market Size, By Functionality, 2019-2026 (USD Million)
9.6.5 Market Size, By Offering, 2019-2026 (USD Million)
9.6.6 Market Size, By Vertical, 2019-2026 (USD Million)
9.6.7 Saudi Arabia
9.6.7.1 Market Size, By Interface, 2019-2026 (USD Million)
9.6.7.2 Market Size, By Type, 2019-2026 (USD Million)
9.6.7.3 Market Size, By Functionality, 2019-2026 (USD Million)
9.6.7.4 Market Size, By Offering, 2019-2026 (USD Million)
9.6.7.5 Market Size, By Vertical, 2019-2026 (USD Million)
9.6.8 UAE
9.6.8.1 Market Size, By Interface, 2019-2026 (USD Million)
9.6.8.2 Market Size, By Type, 2019-2026 (USD Million)
9.6.8.3 Market Size, By Functionality, 2019-2026 (USD Million)
9.6.8.4 Market Size, By Offering, 2019-2026 (USD Million)
9.6.8.5 Market Size, By Vertical, 2019-2026 (USD Million)
9.6.9 South Africa
9.6.9.1 Market Size, By Product, 2019-2026 (USD Million)
9.6.9.2 Market Size, By Type, 2019-2026 (USD Million)
9.6.9.3 Market Size, By Functionality, 2019-2026 (USD Million)
9.6.9.4 Market Size, By Offering, 2019-2026 (USD Million)
9.6.9.5 Market Size, By Vertical, 2019-2026 (USD Million)
Chapter 10 Company Landscape
10.1 Competitive Analysis, 2020
10.2 Thales Group
10.2.1 Company Overview
10.2.2 Financial Analysis
10.2.3 Strategic Positioning
10.2.4 Info Graphic Analysis
10.3 IDEMIA
10.3.1 Company Overview
10.3.2 Financial Analysis
10.3.3 Strategic Positioning
10.3.4 Info Graphic Analysis
10.4 Giesecke + Devrient GmBH
10.4.1 Company Overview
10.4.2 Financial Analysis
10.4.3 Strategic Positioning
10.4.4 Info Graphic Analysis
10.5 CPI Card Group
10.5.1 Company Overview
10.5.2 Financial Analysis
10.5.3 Strategic Positioning
10.5.4 Info Graphic Analysis
10.6 HID Global Corporation
10.6.1 Company Overview
10.6.2 Financial Analysis
10.6.3 Strategic Positioning
10.6.4 Info Graphic Analysis
10.7 Watchdata
10.7.1 Company Overview
10.7.2 Financial Analysis
10.7.3 Strategic Positioning
10.7.4 Info Graphic Analysis
10.8 Eastcompeace
10.8.1 Company Overview
10.8.2 Financial Analysis
10.8.3 Strategic Positioning
10.8.4 Info Graphic Analysis
10.9 Inteligensa
10.9.1 Company Overview
10.9.2 Financial Analysis
10.9.3 Strategic Positioning
10.9.4 Info Graphic Analysis
10.10 ABCorp
10.10.1 Company Overview
10.10.2 Financial Analysis
10.10.3 Strategic Positioning
10.10.4 Info Graphic Analysis
10.11 CardLogix
10.11.1 Company Overview
10.11.2 Financial Analysis
10.11.3 Strategic Positioning
10.11.4 Info Graphic Analysis
The Global Smart Card Market has been studied from the year 2019 till 2026. However, the CAGR provided in the report is from the year 2021 to 2026. The research methodology involved three stages: Desk research, Primary research, and Analysis & Output from the entire research process.

The desk research involved a robust background study which meant referring to paid and unpaid databases to understand the market dynamics; mapping contracts from press releases; identifying the key players in the market, studying their product portfolio, competition level, annual reports/SEC filings & investor presentations; and learning the demand and supply-side analysis for the Smart Card Market.

The primary research activity included telephonic conversations with more than 50 tier 1 industry consultants, distributors, and end-use product manufacturers.

Finally, based on the above thorough research process, an in-depth analysis was carried out considering the following aspects: market attractiveness, current & future market trends, market share analysis, SWOT analysis of the company and customer analytics.


This FREE sample includes market data points, ranging from trend analyses to market estimates & forecasts. See for yourself.
Or view our licence options:
Tailor made solutions just for you
80% of our clients seek made-to-order reports. How do you want us to tailor yours?
OUR CLIENTS


