This report was recently updated on August 24 2025 with the latest and most recent
market numbers
Global Smart Dentistry Market Size, Trends & Analysis - Forecasts to 2026 By Product (Virtual Dentistry [Software & Services, Hardware], Smart Electric Toothbrush [Battery, Rechargeable]), By End-Use (Patients, Payers, Providers), By Region (North America, Asia Pacific, Europe, Latin America, Middle East & Africa); End-User Landscape, Company Market Share Analysis, and Competitor Analysis
A rise in disposable income accompanied by increasing consumer spending on oral care will drive the smart dentistry market. Technology advancement with respect to better solutions in dental care such as electric toothbrushes and virtual dentistry solutions are key factors attributing to industry growth.
Increasing oral hygiene problems due to poor eating habits and lack of discipline to maintain mouth hygiene have resulted in an increased requirement for better dentistry solutions. Excessive drinking and smoking habits among adults and increasing consumption of junk food among children will stimulate the product demand.
As per the report published by American Dental Association, more than 40% of adults avoid visiting dentists due to their limited financial conditions. Hence, technological advancement with teledentistry can uplift that financial pressure by offering remote consultations at economical costing. In the virtual dentistry market, the patient can consult the health provider over a video call or phone chat. By this process, the patient can at least secure an initial consultation and address the minor oral needs.
Increasing dental problems among the geriatric population and their disability to travel and wait for longer duration at clinics has influenced the smart dentistry market trend. As per WHO, globally more than 3.5 people were impacted with the oral disease in 2020. Also, over 525 million children are facing dental issues once in their life. It is also estimated that periodontal diseases impact around 20 to 30% of the population residing in developed countries. As per the World Dental Federation, around 2 billion people face permanent teeth problems due to lack of care during the initial dental problem.
Dental treatments are expensive and are also not covered in the healthcare insurance policy which leads to rising oral hygiene problems. Offering smart dentistry solutions through virtual visits and devices such as electric toothbrushes will reduce the financial pressure on the patient.
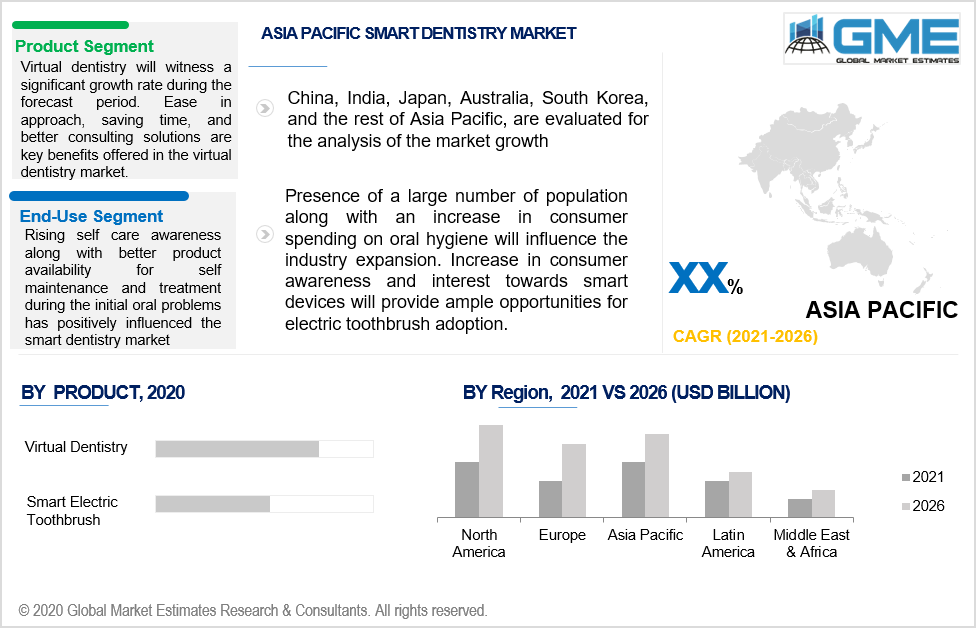
Virtual dentistry and electric toothbrushes are two major contributing products in the smart dentistry market. Virtual dentistry will witness a significant growth rate during the forecast period. Ease in approach, saving time, and better consulting solutions are key benefits offered in the virtual dentistry market. As per American Teledentistry Associations, patients are much more comfortable in consulting online rather than going for a physical visit during the initial consultation days. The report also states that more than 70% of the patients have a preference for remote contact and around 20% live in areas where direct care is inaccessible.
Smart electric toothbrushes hold the highest potential in the self dental care segment. It is an easy and productive solution for people who are cautious about their oral hygiene. These products are self-care solutions and are highly recommended by dentists. Usage of electric toothbrushes minimizes the further oral problems incurred due to lack of care by the patients.
Providers are expected to account for the largest share in the end-use segment. Technological advancement along with the introduction of updated devices will influence the product demand in this segment. Virtually smart dentistry is generating various prospects for the dental care professionals by offering ease in access to conduct educational programs to raise awareness and thereby providing consultation.
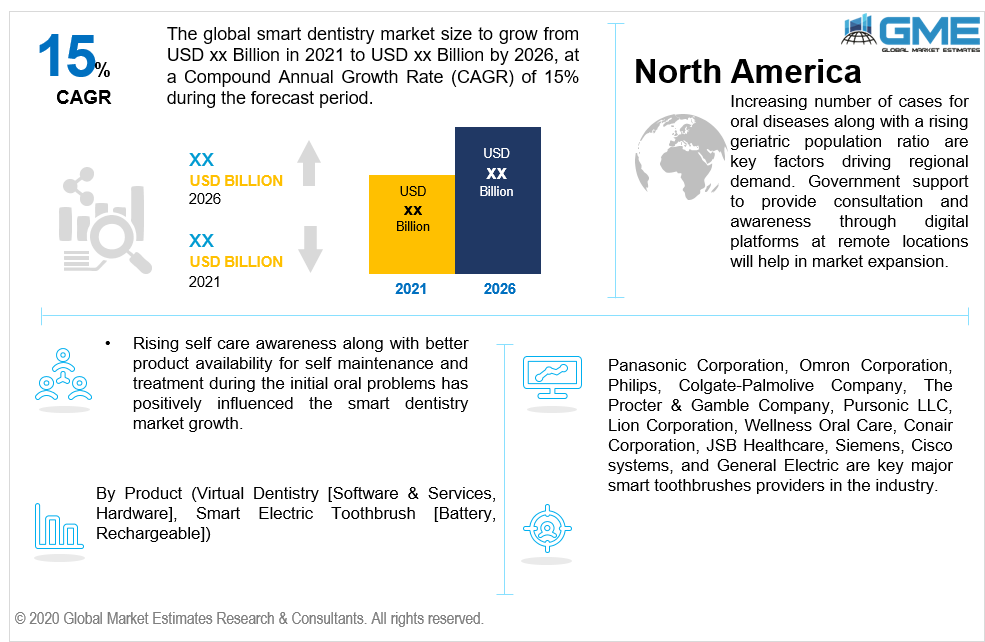
The patient segment is predicted to witness the highest gains during the forecast period. Rising self-care awareness along with better product availability for self-maintenance and treatment during the initial oral problems has positively influenced the smart dentistry market growth.
The North American smart dentistry market is expected to witness high gains up to 2026. An increasing number of cases for oral diseases along with a rising geriatric population ratio are key factors driving regional demand. Government support to provide consultation and awareness through digital platforms at remote locations will help in market expansion.
Asia Pacific smart dentistry market will hold a significant market share during the forecast period. The presence of a large population along with an increase in consumer spending on oral hygiene will influence the industry expansion. An increase in consumer awareness and interest in smart devices will provide ample opportunities for electric toothbrush adoption. However, high product pricing may impact the demand from the middle-income population.
Smart dentistry market share is fragmented in nature due to the presence of a large number of companies offering diversified product range. Panasonic Corporation, Omron Corporation, Philips, Colgate-Palmolive Company, The Procter & Gamble Company, Pursonic LLC, Lion Corporation, Wellness Oral Care, Conair Corporation, JSB Healthcare, Siemens, Cisco Systems, and General Electric are key major smart toothbrushes providers in the industry.
Other key players include Church & Dwight Co. Inc, Water Pik Inc., FOREO, Kolibree SAS, Medtronic plc, Medweb, Medici Technologies, and Zipnosis.
Global virtual dentistry providers are Teladoc Health Inc, Cerner Corporation, Flexaust Inc., Doctor on Demand, Medvivo Group Ltd, Iron Bow Technologies, VSee, Amwell, MDLIVE, IMediplus Inc, and Chiron Health.
Please note: This is not an exhaustive list of companies profiled in the report.
Chapter 1 Methodology
1.1 Market scope & definitions
1.2 Estimates & forecast calculation
1.3 Historical data overview and validation
1.4 Data sources
1.4.1 Secondary
1.4.2 Primary
Chapter 2 Report Outlook
2.1 Smart Dentistry Market industry overview, 2016-2026
2.1.1 Industry overview
2.1.2 Product overview
2.1.3 End-Use overview
2.1.4 Regional overview
Chapter 3 Smart Dentistry Market Trends
3.1 Market segmentation
3.2 Industry background, 2016-2026
3.3 Market key trends
3.3.1 Positive trends
3.3.2 Industry challenges
3.4 Prospective growth scenario
3.4.1 Product growth scenario
3.4.2 Distribution channel growth scenario
3.5 COVID-19 influence over industry growth
3.6 Porter’s analysis
3.7 PESTEL analysis
3.8 Value chain & supply chain analysis
3.9 Regulatory framework
3.9.1 North America
3.9.2 Europe
3.9.3 APAC
3.9.4 LATAM
3.9.5 MEA
3.10 Product innovation
3.11 Market share analysis, 2020
3.11.1 Company positioning overview, 2020
Chapter 4 Smart Dentistry Market, By Product
4.1 Product Outlook
4.2 Virtual Dentistry
4.2.1 Market size, by region, 2016-2026 (USD Million)
4.2.2 Software & services
4.2.2.1 Market size, by region, 2016-2026 (USD Million)
4.2.3 Hardware
4.2.3.1 Market size, by region, 2016-2026 (USD Million)
4.3 Smart Electric Toothbrush
4.3.1 Market size, by region, 2016-2026 (USD Million)
4.3.2 Battery
4.3.2.1 Market size, by region, 2016-2026 (USD Million)
4.3.3 Rechargeable
4.3.3.1 Market size, by region, 2016-2026 (USD Million)
Chapter 5 Smart Dentistry Market, By End-Use
5.1 End-Use Outlook
5.2 Patients
5.2.1 Market size, by region, 2016-2026 (USD Million)
5.3 Payers
5.3.1 Market size, by region, 2016-2026 (USD Million)
5.4 Providers
5.4.1 Market size, by region, 2016-2026 (USD Million)
5.5 Others
5.5.1 Market size, by region, 2016-2026 (USD Million)
Chapter 6 Smart Dentistry Market, By Region
6.1 Regional outlook
6.2 North America
6.2.1 Market size, by country 2016-2026 (USD Million)
6.2.2 Market size, by product, 2016-2026 (USD Million)
6.2.3 Market size, by end-use, 2016-2026 (USD Million)
6.2.4 U.S.
6.2.4.1 Market size, by product, 2016-2026 (USD Million)
6.2.4.2 Market size, by end-use, 2016-2026 (USD Million)
6.2.5 Canada
6.2.5.1 Market size, by product, 2016-2026 (USD Million)
6.2.5.2 Market size, by end-use, 2016-2026 (USD Million)
6.3 Europe
6.3.1 Market size, by country 2016-2026 (USD Million)
6.3.2 Market size, by product, 2016-2026 (USD Million)
6.3.3 Market size, by end-use, 2016-2026 (USD Million)
6.3.4 Germany
6.2.4.1 Market size, by product, 2016-2026 (USD Million)
6.2.4.2 Market size, by end-use, 2016-2026 (USD Million)
6.3.5 UK
6.3.5.1 Market size, by product, 2016-2026 (USD Million)
6.3.5.2 Market size, by end-use, 2016-2026 (USD Million)
6.3.6 France
6.3.6.1 Market size, by product, 2016-2026 (USD Million)
6.3.6.2 Market size, by end-use, 2016-2026 (USD Million)
6.3.7 Italy
6.3.7.1 Market size, by product, 2016-2026 (USD Million)
6.3.7.2 Market size, by end-use, 2016-2026 (USD Million)
6.3.8 Spain
6.3.8.1 Market size, by product, 2016-2026 (USD Million)
6.3.8.2 Market size, by end-use, 2016-2026 (USD Million)
6.3.9 Russia
6.3.9.1 Market size, by product, 2016-2026 (USD Million)
6.3.9.2 Market size, by end-use, 2016-2026 (USD Million)
6.4 Asia Pacific
6.4.1 Market size, by country 2016-2026 (USD Million)
6.4.2 Market size, by product, 2016-2026 (USD Million)
6.4.3 Market size, by end-use, 2016-2026 (USD Million)
6.4.4 China
6.4.4.1 Market size, by product, 2016-2026 (USD Million)
6.4.4.2 Market size, by end-use, 2016-2026 (USD Million)
6.4.5 India
6.4.5.1 Market size, by product, 2016-2026 (USD Million)
6.4.5.2 Market size, by end-use, 2016-2026 (USD Million)
6.4.6 Japan
6.4.6.1 Market size, by product, 2016-2026 (USD Million)
6.4.6.2 Market size, by end-use, 2016-2026 (USD Million)
6.4.7 Australia
6.4.7.1 Market size, by product, 2016-2026 (USD Million)
6.4.7.2 Market size, by end-use, 2016-2026 (USD Million)
6.4.8 South Korea
6.4.8.1 Market size, by product, 2016-2026 (USD Million)
6.4.8.2 Market size, by end-use, 2016-2026 (USD Million)
6.5 Latin America
6.5.1 Market size, by country 2016-2026 (USD Million)
6.5.2 Market size, by product, 2016-2026 (USD Million)
6.5.3 Market size, by end-use, 2016-2026 (USD Million)
6.5.4 Brazil
6.5.4.1 Market size, by product, 2016-2026 (USD Million)
6.5.4.2 Market size, by end-use, 2016-2026 (USD Million)
6.5.5 Mexico
6.5.5.1 Market size, by product, 2016-2026 (USD Million)
6.5.5.2 Market size, by end-use, 2016-2026 (USD Million)
6.5.6 Argentina
6.5.6.1 Market size, by product, 2016-2026 (USD Million)
6.5.6.2 Market size, by end-use, 2016-2026 (USD Million)
6.6 MEA
6.6.1 Market size, by country 2016-2026 (USD Million)
6.6.2 Market size, by product, 2016-2026 (USD Million)
6.6.3 Market size, by end-use, 2016-2026 (USD Million)
6.6.4 Saudi Arabia
6.6.4.1 Market size, by product, 2016-2026 (USD Million)
6.6.4.2 Market size, by end-use, 2016-2026 (USD Million)
6.6.5 UAE
6.6.5.1 Market size, by product, 2016-2026 (USD Million)
6.6.5.2 Market size, by end-use, 2016-2026 (USD Million)
6.6.6 South Africa
6.6.6.1 Market size, by product, 2016-2026 (USD Million)
6.6.6.2 Market size, by end-use, 2016-2026 (USD Million)
Chapter 7 Company Landscape
7.1 Competitive analysis, 2020
7.2 Omron Corporation
7.2.1 Company overview
7.2.2 Financial analysis
7.2.3 Strategic positioning
7.2.4 Info graphic analysis
7.3 Panasonic Corporation
7.3.1 Company overview
7.3.2 Financial analysis
7.3.3 Strategic positioning
7.3.4 Info graphic analysis
7.4 Colgate-Palmolive Company
7.4.1 Company overview
7.4.2 Financial analysis
7.4.3 Strategic positioning
7.4.4 Info graphic analysis
7.5 Pursonic LLC
7.5.1 Company overview
7.5.2 Financial analysis
7.5.3 Strategic positioning
7.5.4 Info graphic analysis
7.6 Koninklijke Philips NV
7.6.1 Company overview
7.6.2 Financial analysis
7.6.3 Strategic positioning
7.6.4 Info graphic analysis
7.7 The Procter & Gamble Company
7.7.1 Company overview
7.7.2 Financial analysis
7.7.3 Strategic positioning
7.7.4 Info graphic analysis
7.8 Lion Corporation
7.8.1 Company overview
7.8.2 Financial analysis
7.8.3 Strategic positioning
7.8.4 Info graphic analysis
7.9 Wellness Oral Care
7.9.1 Company overview
7.9.2 Financial analysis
7.9.3 Strategic positioning
7.9.4 Info graphic analysis
7.10 Conair Corporation
7.10.1 Company overview
7.10.2 Financial analysis
7.10.3 Strategic positioning
7.10.4 Info graphic analysis
7.11 Church & Dwight Co. Inc.
7.11.1 Company overview
7.11.2 Financial analysis
7.11.3 Strategic positioning
7.11.4 Info graphic analysis
7.12 Water Pik Inc.
7.12.1 Company overview
7.12.2 Financial analysis
7.12.3 Strategic positioning
7.12.4 Info graphic analysis
7.13 JSB Healthcare
7.13.1 Company overview
7.13.2 Financial analysis
7.13.3 Strategic positioning
7.13.4 Info graphic analysis
7.14 FOREO
7.14.1 Company overview
7.14.2 Financial analysis
7.14.3 Strategic positioning
7.14.4 Info graphic analysis
7.15 Kolibree SAS
7.15.1 Company overview
7.15.2 Financial analysis
7.15.3 Strategic positioning
7.15.4 Info graphic analysis
7.16 Medtronic plc
7.16.1 Company overview
7.16.2 Financial analysis
7.16.3 Strategic positioning
7.16.4 Info graphic analysis
7.17 Seimens
7.17.1 Company overview
7.17.2 Financial analysis
7.17.3 Strategic positioning
7.17.4 Info graphic analysis
7.18 Cisco systems Inc.
7.18.1 Company overview
7.18.2 Financial analysis
7.18.3 Strategic positioning
7.18.4 Info graphic analysis
7.19 Medweb
7.19.1 Company overview
7.19.2 Financial analysis
7.19.3 Strategic positioning
7.19.4 Info graphic analysis
7.20 Medici Technologies
7.20.1 Company overview
7.20.2 Financial analysis
7.20.3 Strategic positioning
7.20.4 Info graphic analysis
7.21 Zipnosis
7.21.1 Company overview
7.21.2 Financial analysis
7.21.3 Strategic positioning
7.21.4 Info graphic analysis
7.22 General Electric
7.22.1 Company overview
7.22.2 Financial analysis
7.22.3 Strategic positioning
7.22.4 Info graphic analysis
7.23 Teladoc Health Inc
7.23.1 Company overview
7.23.2 Financial analysis
7.23.3 Strategic positioning
7.23.4 Info graphic analysis
7.24 Cerner Corporation
7.24.1 Company overview
7.24.2 Financial analysis
7.24.3 Strategic positioning
7.24.4 Info graphic analysis
7.25 Flexaust Inc.
7.25.1 Company overview
7.25.2 Financial analysis
7.25.3 Strategic positioning
7.25.4 Info graphic analysis
7.26 Doctor on Demand
7.26.1 Company overview
7.26.2 Financial analysis
7.26.3 Strategic positioning
7.26.4 Info graphic analysis
7.27 Medvivo Group Ltd
7.27.1 Company overview
7.27.2 Financial analysis
7.27.3 Strategic positioning
7.27.4 Info graphic analysis
7.28 Iron Bow Technologies
7.28.1 Company overview
7.28.2 Financial analysis
7.28.3 Strategic positioning
7.28.4 Info graphic analysis
7.29 VSee
7.29.1 Company overview
7.29.2 Financial analysis
7.29.3 Strategic positioning
7.29.4 Info graphic analysis
7.30 Amwell
7.30.1 Company overview
7.30.2 Financial analysis
7.30.3 Strategic positioning
7.30.4 Info graphic analysis
7.31 MDLIVE
7.31.1 Company overview
7.31.2 Financial analysis
7.31.3 Strategic positioning
7.31.4 Info graphic analysis
7.32 IMediplus Inc.
7.32.1 Company overview
7.32.2 Financial analysis
7.32.3 Strategic positioning
7.32.4 Info graphic analysis
7.33 Chiron Health
7.33.1 Company overview
7.33.2 Financial analysis
7.33.3 Strategic positioning
7.33.4 Info graphic analysis
The Global Smart Dentistry Market has been studied from the year 2019 till 2026. However, the CAGR provided in the report is from the year 2021 to 2026. The research methodology involved three stages: Desk research, Primary research, and Analysis & Output from the entire research process.

The desk research involved a robust background study which meant referring to paid and unpaid databases to understand the market dynamics; mapping contracts from press releases; identifying the key players in the market, studying their product portfolio, competition level, annual reports/SEC filings & investor presentations; and learning the demand and supply-side analysis for the Smart Dentistry Market.

The primary research activity included telephonic conversations with more than 50 tier 1 industry consultants, distributors, and end-use product manufacturers.

Finally, based on the above thorough research process, an in-depth analysis was carried out considering the following aspects: market attractiveness, current & future market trends, market share analysis, SWOT analysis of the company and customer analytics.

![Global Smart Dentistry Market Size, Trends & Analysis - Forecasts to 2026 By Product (Virtual Dentistry [Software & Services, Hardware], Smart Electric Toothbrush [Battery, Rechargeable]), By End-Use (Patients, Payers, Providers), By Region (North America, Asia Pacific, Europe, Latin America, Middle East & Africa); End-User Landscape, Company Market Share Analysis, and Competitor Analysis](https://www.globalmarketestimates.com/images/cat/Healthcare.png)
This FREE sample includes market data points, ranging from trend analyses to market estimates & forecasts. See for yourself.
Or view our licence options:
Tailor made solutions just for you
80% of our clients seek made-to-order reports. How do you want us to tailor yours?
OUR CLIENTS


