This report was recently updated on August 28 2025 with the latest and most recent
market numbers
Global Threonine Acids Market Size, Trends, and Analysis - Forecasts To 2026 By Product Types (D-Threonine, L-Threonine, Others), By Application (Food & Dietary Supplements, Animal Feed, Pharmaceuticals, Others), By Sources (Animal Based, Plant Based), By Livestock (Cattle, Swine, Poultry, Aquatic animal, Others), By Region (North America, Asia Pacific, CSA, Europe, and the Middle East and Africa); End-User Landscape, Company Market Share Analysis & Competitor Analysis
In human beings, threonine is a required amino acid. Human plasma contains a lot of it, especially in newborn babies. In laboratory animals, serious threonine deficiency can cause cognitive dysfunction and lameness. Being immunostimulants, Threonine is a chemical that helps to stimulate the thymus gland in the body. It has also been shown to help in curing multiple sclerosis and inherited spasticity conditions.
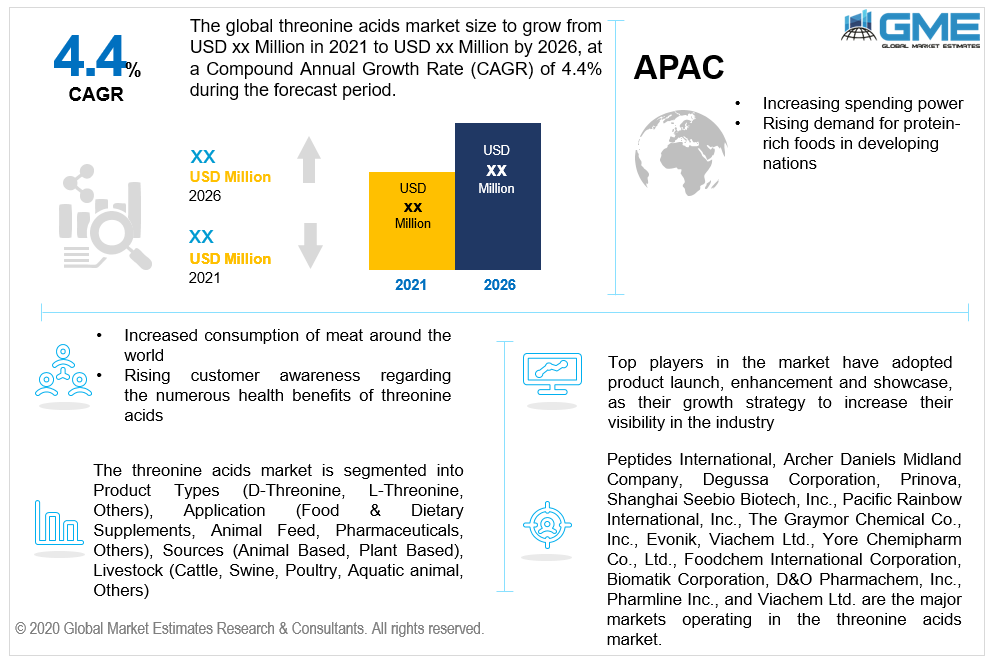
Over the projected timeframe, the demand is anticipated to be driven by increased consumption of meat around the world, as well as the increasing population in developing nations. In comparison to other conventional amino acids such as methionine and lysine, enhanced efficiency and decreased waste play a significant role in transforming the market. The growing demand for threonine acids in the animal feed sector to boost amino acid ingestion and animal health is one of the major factors spurring the global threonine acids sector. Another factor anticipated to promote the development of the global threonine acids industry over the estimated timeframe is rising customer awareness regarding the numerous health benefits of threonine acids, combined with rising spending power in developing economies such as China and India.
Other significant factors projected to augment market development include the growing use of threonine acids to cure nervous system diseases and as nutritional supplements in numerous weight loss programs. Another factor driving the global threonine acids industry is the increasing demand for threonine acids in the pharmaceutical sector to cure diseases like nervous system disorders.
However, rising threonine acid prices are a big stumbling block to the global threonine industry's expansion. Another aspect that is likely to stifle demand growth over the projected timeframe is scarcity of raw materials and strict regulatory standards.
During the projected timeframe, research and development on threonine acid is anticipated to create new opportunities for the industry. In order to be incorporated in products like infant formula and nutritional supplements, rigorous R&D on threonine is needed.
Based on product type, the market has been categorized into D-Threonine and L-Threonine. Because of its ability to protect the digestive system, endogenous secretions, and tissue growth, L-threonine is anticipated to dominate the industry. Since L-threonine acids are critical elements of enamel, elastin, and collagen proteins, threonine is increasingly being used in cosmetics, personal care, and oral care items.
Food and dietary supplements had the highest profit share in 2019 and are expected to continue to do so in the projected timeframe. Threonine acids are used as flavoring agents, preservatives, and nutrient enhancers in the food processing sector.
Over the projected timeframe, the animal feed category is anticipated to rise at a rapid rate. Threonine acids are used as additives in animal feed formulas to support growth performance, reproduce, and meet their protein needs. Feed conversion performance is improved by supplementing with threonine acids, which lowers the feed cost of each unit of weight gain. Furthermore, the threonine acid requirement differs based on species and is dependent on the animal's developmental stage.
Plant-based threonine is projected to expand steadily over the forthcoming years due to its low cost of processing, high carbohydrate content, and ability to lower cholesterol levels and aid in preventing cancer. Because of its higher intake and large-scale processing, soybean is primarily used for the commercial growth of the product. The global consumption and production of plant-based threonine acids are anticipated to increase as customer awareness about organic and natural products grows. Wheat, peas, corn, soybeans, and potato are among the plant sources. Additionally, increased public concern about livestock slaughter is likely to boost demand for plant-based sources.
Threonine is used as a livestock feed supplement and in the treatment of various nervous system disorders. The poultry sector is the largest consumer of feed additives, followed by the swine breeding sector. Rising demand for feed additives in livestock is projected to benefit the entire market. The worldwide growth in demand for protein-rich products such as meat and dairy is accelerating the protected feed threonine acids industry. Feed threonine acids are essential for animal nutrition because they promote productivity, activity, development, reproduction, and total animal health. They give the energy necessary for muscle and bone development, as well as digestion, blood flow, and muscle movement.
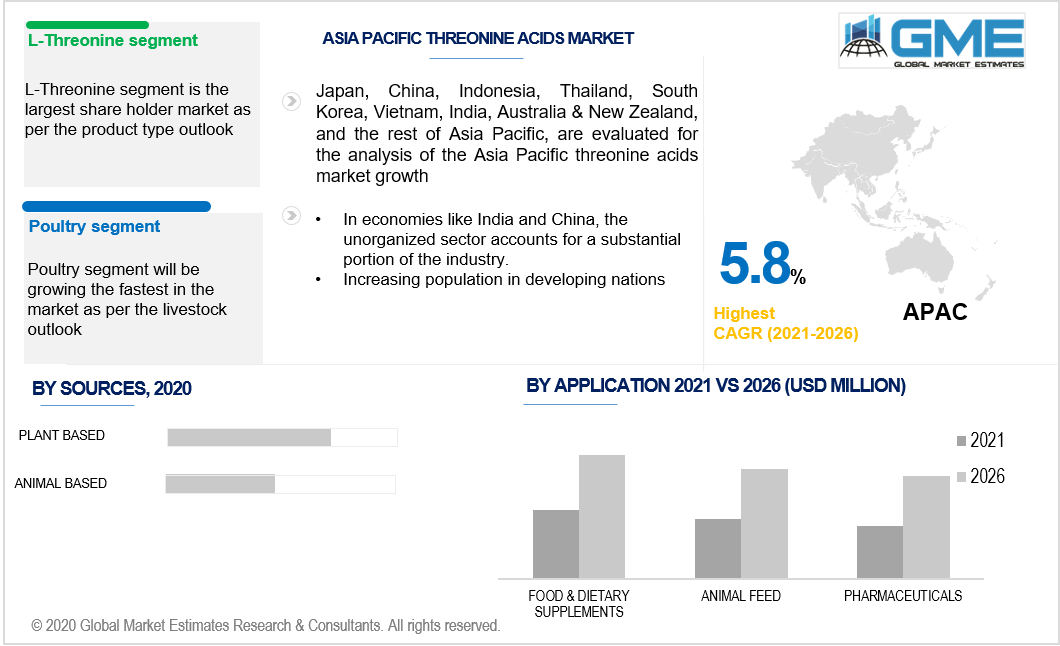
The Asia Pacific threonine acids industry is the most influential, with the highest CAGR rate. Increasing spending power combined with higher demand for protein-rich foods in developing nations like Pakistan, China, Malaysia, Indonesia, Vietnam, Bangladesh, and India is projected to drive regional industry growth. The commercial market for threonine acids is extremely fragmented. This trend is caused by the presence of various small or medium-sized producers in the threonine acids market. In economies like India and China, the unorganized sector accounts for a substantial portion of the industry. The total demand for threonine acids is expected to be driven by high feed additive demand and huge consumption of meat in North America. Within the next six years, Brazil is anticipated to expand significantly. Within the next seven years, nations like France, the United Kingdom, Russia, and Germany are expected to expand rapidly. However, the European economic crisis could result in more modest market growth.
Peptides International, Archer Daniels Midland Company, Biomatik Corporation, Shanghai Seebio Biotech, Inc., Prinova, Pacific Rainbow International, Inc., Evonik, Viachem Ltd., The Graymor Chemical Co., Inc., Foodchem, D&O Pharmachem, Inc., Yore Chemipharm Co., Ltd., and Degussa are the major markets operating in the threonine acids market.
Please note: This is not an exhaustive list of companies profiled in the report.
In November 2016, Evonik Industries AG announced that it had reached an agreement with METabolic EXplorer of France to purchase the corporation's technology platform for amino acid processing. Patents, brands, and amino acid ingredients are also part of the system's acquisition strategy. This partnership would allow both businesses to concentrate on technology development and core business activities.
Chapter 1 Methodology
1.1 Market Scope & Definitions
1.2 Estimates & Forecast Calculation
1.3 Historical Data Overview and Validation
1.4 Data Sources
1.4.1 Secondary
1.4.2 Primary
Chapter 2 Report Outlook
2.1 Threonine Acids Industry Overview, 2016-2026
2.1.1 Industry Overview
2.1.2 Product Type Overview
2.1.3 Application Overview
2.1.4 Source Overview
2.1.5 Live-Stock Overview
2.1.6 Regional Overview
Chapter 3 Threonine Acids Market Trends
3.1 Market Segmentation
3.2 Industry Background, 2016-2026
3.3 Market Key Trends
3.3.1 Positive Trends
3.3.1.1 Flourishing Meat and Meat Product Industry
3.3.2 Industry Challenges
3.3.2.1 Rising Preference for Vegan Meal across the Globe
3.4 Prospective Growth Scenario
3.4.1 Product Type Growth Scenario
3.4.2 Application Growth Scenario
3.4.3 Source Growth Scenario
3.4.4 Live-Stock Growth Scenario
3.5 COVID-19 Influence over Industry Growth
3.6 Porter’s Analysis
3.7 PESTEL Analysis
3.8 Value Chain & Supply Chain Analysis
3.9 Regulatory Framework
3.9.1 North America
3.9.2 Europe
3.9.3 APAC
3.9.4 LATAM
3.9.5 MEA
3.10 Live-Stock Overview
3.11 Market Share Analysis, 2020
3.11.1 Company Positioning Overview, 2020
Chapter 4 Threonine Acids Market, By Product Type
4.1 Product Type Outlook
4.2 D-Threonine
4.2.1 Market Size, By Region, 2016-2026 (USD Million)
4.3 L-Threonine
4.3.1 Market Size, By Region, 2016-2026 (USD Million)
Chapter 5 Threonine Acids Market, By Application
5.1 Application Outlook
5.2 Food & Dietary Supplements
5.2.1 Market Size, By Region, 2016-2026 (USD Million)
5.3 Animal Feed
5.3.1 Market Size, By Region, 2016-2026 (USD Million)
5.4 Pharmaceuticals
5.4.1 Market Size, By Region, 2016-2026 (USD Million)
5.5 Others
5.5.1 Market Size, By Region, 2016-2026 (USD Million)
Chapter 6 Threonine Acids Market, By Source
6.1 Animal Based
6.1.1 Market Size, By Region, 2016-2026 (USD Million)
6.2 Plant Based
6.2.1 Market Size, By Region, 2016-2026 (USD Million)
Chapter 7 Threonine Acids Market, By Live-Stock
7.1 Cattle
7.1.1 Market Size, By Region, 2016-2026 (USD Million)
7.2 Swine
7.2.1 Market Size, By Region, 2016-2026 (USD Million)
7.3 Poultry
7.3.1 Market Size, By Region, 2016-2026 (USD Million)
7.4 Aquatic Animal
7.4.1 Market Size, By Region, 2016-2026 (USD Million)
Chapter 8 Threonine Acids Market, By Region
8.1 Regional outlook
8.2 North America
8.2.1 Market Size, By Country 2016-2026 (USD Million)
8.2.2 Market Size, By Product Type, 2016-2026 (USD Million)
8.2.3 Market Size, By Application, 2016-2026 (USD Million)
8.2.4 Market Size, By Source, 2016-2026 (USD Million)
8.2.5 Market Size, By Live-Stock, 2016-2026 (USD Million)
8.2.6 U.S.
8.2.6.1 Market Size, By Product Type, 2016-2026 (USD Million)
8.2.4.2 Market Size, By Application, 2016-2026 (USD Million)
8.2.4.3 Market Size, By Source, 2016-2026 (USD Million)
Market Size, By Live-Stock, 2016-2026 (USD Million)
8.2.7 Canada
8.2.7.1 Market Size, By Product Type, 2016-2026 (USD Million)
8.2.7.2 Market Size, By Application, 2016-2026 (USD Million)
8.2.7.3 Market Size, By Source, 2016-2026 (USD Million)
8.2.7.4 Market Size, By Live-Stock, 2016-2026 (USD Million)
8.3 Europe
8.3.1 Market Size, By Country 2016-2026 (USD Million)
8.3.2 Market Size, By Product Type, 2016-2026 (USD Million)
8.3.3 Market Size, By Application, 2016-2026 (USD Million)
8.3.4 Market Size, By Source, 2016-2026 (USD Million)
8.3.5 Market Size, By Live-Stock, 2016-2026 (USD Million)
8.3.6 Germany
8.3.6.1 Market Size, By Product Type, 2016-2026 (USD Million)
8.3.6.2 Market Size, By Application, 2016-2026 (USD Million)
8.3.6.3 Market Size, By Source, 2016-2026 (USD Million)
8.3.6.4 Market Size, By Live-Stock, 2016-2026 (USD Million)
8.3.7 UK
8.3.7.1 Market Size, By Product Type, 2016-2026 (USD Million)
8.3.7.2 Market Size, By Application, 2016-2026 (USD Million)
8.3.7.3 Market Size, By Source, 2016-2026 (USD Million)
8.3.7.4 Market Size, By Live-Stock, 2016-2026 (USD Million)
8.3.8 France
8.3.8.1 Market Size, By Product Type, 2016-2026 (USD Million)
8.3.8.2 Market Size, By Application, 2016-2026 (USD Million)
8.3.8.3 Market Size, By Source, 2016-2026 (USD Million)
8.3.8.4 Market Size, By Live-Stock, 2016-2026 (USD Million)
8.3.9 Italy
8.3.9.1 Market Size, By Product Type, 2016-2026 (USD Million)
8.3.9.2 Market Size, By Application, 2016-2026 (USD Million)
8.3.9.3 Market Size, By Source, 2016-2026 (USD Million)
8.3.9.4 Market Size, By Live-Stock, 2016-2026 (USD Million)
8.3.10 Spain
8.3.10.1 Market Size, By Product Type, 2016-2026 (USD Million)
8.3.10.2 Market Size, By Application, 2016-2026 (USD Million)
8.3.10.3 Market Size, By Source, 2016-2026 (USD Million)
8.3.10.4 Market Size, By Live-Stock, 2016-2026 (USD Million)
8.3.11 Russia
8.3.11.1 Market Size, By Product Type, 2016-2026 (USD Million)
8.3.11.2 Market Size, By Application, 2016-2026 (USD Million)
8.3.11.3 Market Size, By Source, 2016-2026 (USD Million)
8.3.11.4 Market Size, By Live-Stock, 2016-2026 (USD Million)
8.4 Asia Pacific
8.4.1 Market Size, By Country 2016-2026 (USD Million)
8.4.2 Market Size, By Product Type, 2016-2026 (USD Million)
8.4.3 Market Size, By Application, 2016-2026 (USD Million)
8.4.4 Market Size, By Source, 2016-2026 (USD Million)
8.4.5 Market Size, By Live-Stock, 2016-2026 (USD Million)
8.4.6 China
8.4.6.1 Market Size, By Product Type, 2016-2026 (USD Million)
8.4.6.2 Market Size, By Application, 2016-2026 (USD Million)
8.4.6.3 Market Size, By Source, 2016-2026 (USD Million)
8.4.6.4 Market Size, By Live-Stock, 2016-2026 (USD Million)
8.4.7 India
8.4.7.1 Market Size, By Product Type, 2016-2026 (USD Million)
8.4.7.2 Market Size, By Application, 2016-2026 (USD Million)
8.4.7.3 Market Size, By Source, 2016-2026 (USD Million)
8.4.7.4 Market Size, By Live-Stock, 2016-2026 (USD Million)
8.4.8 Japan
8.4.8.1 Market Size, By Product Type, 2016-2026 (USD Million)
8.4.8.2 Market Size, By Application, 2016-2026 (USD Million)
8.4.8.3 Market Size, By Source, 2016-2026 (USD Million)
8.4.8.4 Market Size, By Live-Stock, 2016-2026 (USD Million)
8.4.9 Australia
8.4.9.1 Market Size, By Product Type, 2016-2026 (USD Million)
8.4.9.2 Market size, By Application, 2016-2026 (USD Million)
8.4.9.3 Market Size, By Source, 2016-2026 (USD Million)
8.4.9.4 Market Size, By Live-Stock, 2016-2026 (USD Million)
8.4.10 South Korea
8.4.10.1 Market Size, By Product Type, 2016-2026 (USD Million)
8.4.10.2 Market Size, By Application, 2016-2026 (USD Million)
8.4.10.3 Market Size, By Source, 2016-2026 (USD Million)
8.4.10.4 Market Size, By Live-Stock, 2016-2026 (USD Million)
8.5 Latin America
8.5.1 Market Size, By Country 2016-2026 (USD Million)
8.5.2 Market Size, By Product Type, 2016-2026 (USD Million)
8.5.3 Market Size, By Application, 2016-2026 (USD Million)
8.5.4 Market Size, By Source, 2016-2026 (USD Million)
8.5.5 Market Size, By Live-Stock, 2016-2026 (USD Million)
8.5.6 Brazil
8.5.6.1 Market Size, By Product Type, 2016-2026 (USD Million)
8.5.6.2 Market Size, By Application, 2016-2026 (USD Million)
8.5.6.3 Market Size, By Source, 2016-2026 (USD Million)
8.5.6.4 Market Size, By Live-Stock, 2016-2026 (USD Million)
8.5.7 Mexico
8.5.7.1 Market Size, By Product Type, 2016-2026 (USD Million)
8.5.7.2 Market Size, By Application, 2016-2026 (USD Million)
8.5.7.3 Market Size, By Source, 2016-2026 (USD Million)
8.5.7.4 Market Size, By Live-Stock, 2016-2026 (USD Million)
8.5.8 Argentina
8.5.8.1 Market Size, By Product Type, 2016-2026 (USD Million)
8.5.8.2 Market Size, By Application, 2016-2026 (USD Million)
8.5.8.3 Market Size, By Source, 2016-2026 (USD Million)
8.5.8.4 Market Size, By Live-Stock, 2016-2026 (USD Million)
8.6 MEA
8.6.1 Market Size, By Country 2016-2026 (USD Million)
8.6.2 Market Size, By Product Type, 2016-2026 (USD Million)
8.6.3 Market Size, By Application, 2016-2026 (USD Million)
8.6.4 Market Size, By Source, 2016-2026 (USD Million)
8.6.5 Market Size, By Live-Stock, 2016-2026 (USD Million)
8.6.6 Saudi Arabia
8.6.6.1 Market Size, By Product Type, 2016-2026 (USD Million)
8.6.6.2 Market Size, By Application, 2016-2026 (USD Million)
8.6.6.3 Market Size, By Source, 2016-2026 (USD Million)
8.6.6.4 Market Size, By Live-Stock, 2016-2026 (USD Million)
8.6.7 UAE
8.6.7.1 Market Size, By Product Type, 2016-2026 (USD Million)
8.6.7.2 Market Size, By Application, 2016-2026 (USD Million)
8.6.7.3 Market Size, By Source, 2016-2026 (USD Million)
8.6.7.4 Market Size, By Live-Stock, 2016-2026 (USD Million)
8.6.8 South Africa
8.6.8.1 Market Size, By Product Type, 2016-2026 (USD Million)
8.6.8.2 Market Size, By Application, 2016-2026 (USD Million)
8.6.8.3 Market Size, By Source, 2016-2026 (USD Million)
8.6.8.4 Market Size, By Live-Stock, 2016-2026 (USD Million)
Chapter 9 Company Landscape
9.1 Competitive Analysis, 2020
9.2 Peptides International
9.2.1 Company Overview
9.2.2 Financial Analysis
9.2.3 Strategic Positioning
9.2.4 Info Graphic Analysis
9.3 Archer Daniels Midland Company
9.3.1 Company Overview
9.3.2 Financial Analysis
9.3.3 Strategic Positioning
9.3.4 Info Graphic Analysis
9.4 Degussa Corporation
9.4.1 Company Overview
9.4.2 Financial Analysis
9.4.3 Strategic Positioning
9.4.4 Info Graphic Analysis
9.5 Prinova
9.5.1 Company Overview
9.5.2 Financial Analysis
9.5.3 Strategic Positioning
9.5.4 Info Graphic Analysis
9.6 Shanghai Seebio Biotech, Inc.
9.6.1 Company Overview
9.6.2 Financial Analysis
9.6.3 Strategic Positioning
9.6.4 Info Graphic Analysis
9.7 Pacific Rainbow International, Inc.
9.7.1 Company Overview
9.7.2 Financial Analysis
9.7.3 Strategic Positioning
9.7.4 Info Graphic Analysis
9.8 The Graymor Chemical Co., Inc.
9.8.1 Company Overview
9.8.2 Financial Analysis
9.8.3 Strategic Positioning
9.8.4 Info Graphic Analysis
9.9 Evonik, Viachem Ltd.
9.9.1 Company Overview
9.9.2 Financial Analysis
9.9.3 Strategic Positioning
9.9.4 Info Graphic Analysis
9.10 Yore Chemipharm
9.10.1 Company Overview
9.10.2 Financial Analysis
9.10.3 Strategic Positioning
9.10.4 Info Graphic Analysis
9.11 Other Companies
9.11.1 Company Overview
9.11.2 Financial Analysis
9.11.3 Strategic Positioning
9.11.4 Info Graphic Analysis
The Global Threonine Acids Market has been studied from the year 2019 till 2026. However, the CAGR provided in the report is from the year 2021 to 2026. The research methodology involved three stages: Desk research, Primary research, and Analysis & Output from the entire research process.

The desk research involved a robust background study which meant referring to paid and unpaid databases to understand the market dynamics; mapping contracts from press releases; identifying the key players in the market, studying their product portfolio, competition level, annual reports/SEC filings & investor presentations; and learning the demand and supply-side analysis for the Threonine Acids Market.

The primary research activity included telephonic conversations with more than 50 tier 1 industry consultants, distributors, and end-use product manufacturers.

Finally, based on the above thorough research process, an in-depth analysis was carried out considering the following aspects: market attractiveness, current & future market trends, market share analysis, SWOT analysis of the company and customer analytics.


This FREE sample includes market data points, ranging from trend analyses to market estimates & forecasts. See for yourself.
Or view our licence options:
Tailor made solutions just for you
80% of our clients seek made-to-order reports. How do you want us to tailor yours?
OUR CLIENTS


