This report was recently updated on July 6 2025 with the latest and most recent
market numbers
Global Green Ammonia Market Size, Trends & Analysis - Forecasts to 2028 By Technology (Alkaline Water Electrolysis (AWE), Proton Exchange Membrane (PEM) Electrolysis, Solid Oxide Electrolysis), By End-Use Application (Transportation, Power Generation, Industrial Feedstock), By Region (North America, Asia Pacific, Central and South America, Europe, Middle East and Africa), Competitive Landscape, Company Market Share Analysis, and Competitor Analysis
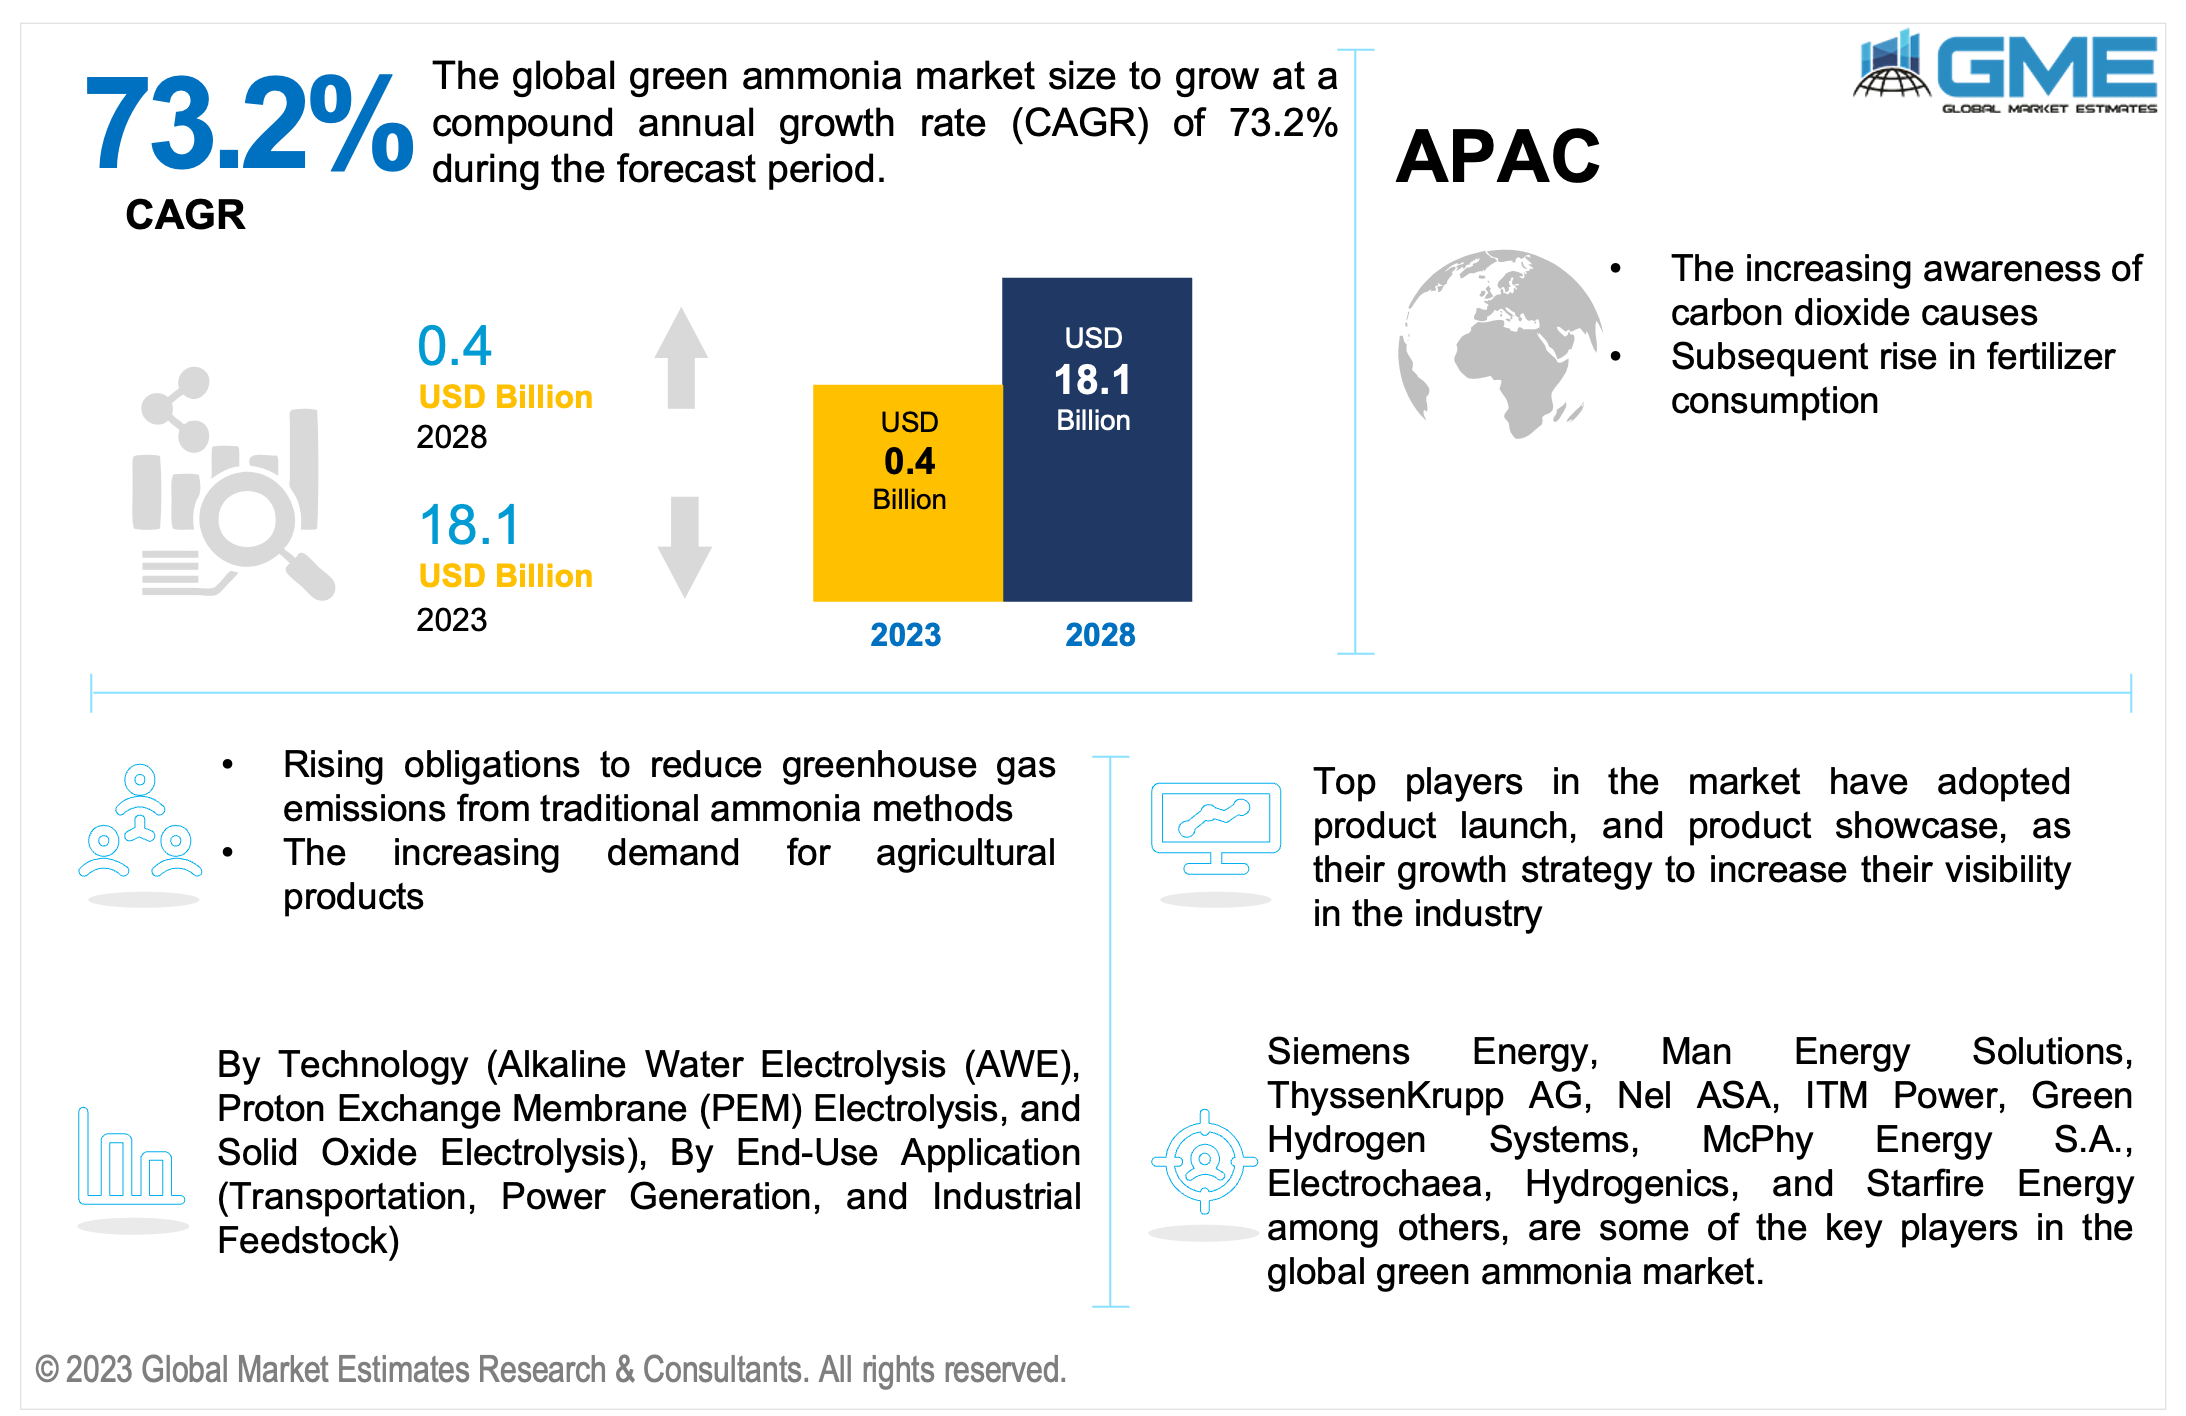
The Global Green Ammonia Market is expected to grow from USD 0.4 billion in 2023 to USD 18.1 billion by 2028, at a CAGR of 73.2% from 2023 to 2028.
The increasing demand for agricultural products, the increasing number of green ammonia projects, and government initiatives for a significant shift towards zero-carbon emission via carbon reduction are expected to support the green ammonia market in the forecast period. The governments of many countries have established a number of objectives and initiatives to lower carbon emissions globally. Due to growing efforts to reduce carbon emissions, it is estimated that the market for green ammonia would expand throughout the projected period. Additionally, the industry is anticipated to increase as a result of the rising demand for green ammonia in a number of end-use sectors, including fertiliser, power production, transportation, and others. In addition, rising demand for green ammonia in medicinal and industrial feedstock goods is anticipated to drive market expansion.
Globally, the soil condition has significantly declined due to the widespread utilization of fertilizer and pesticides which creates an opportunity for organic fertilizer manufacturers. Additionally, strict laws of government for the production of ammonia from fossil fuels and the rising focus of countries on achieving net zero carbon emission targets are boosting the growth of the market. However, the production of green ammonia is 1.5 times more expensive and it is not feasible for traditional ammonia producers which will be expected to hamper the growth of the market in the forecast period.
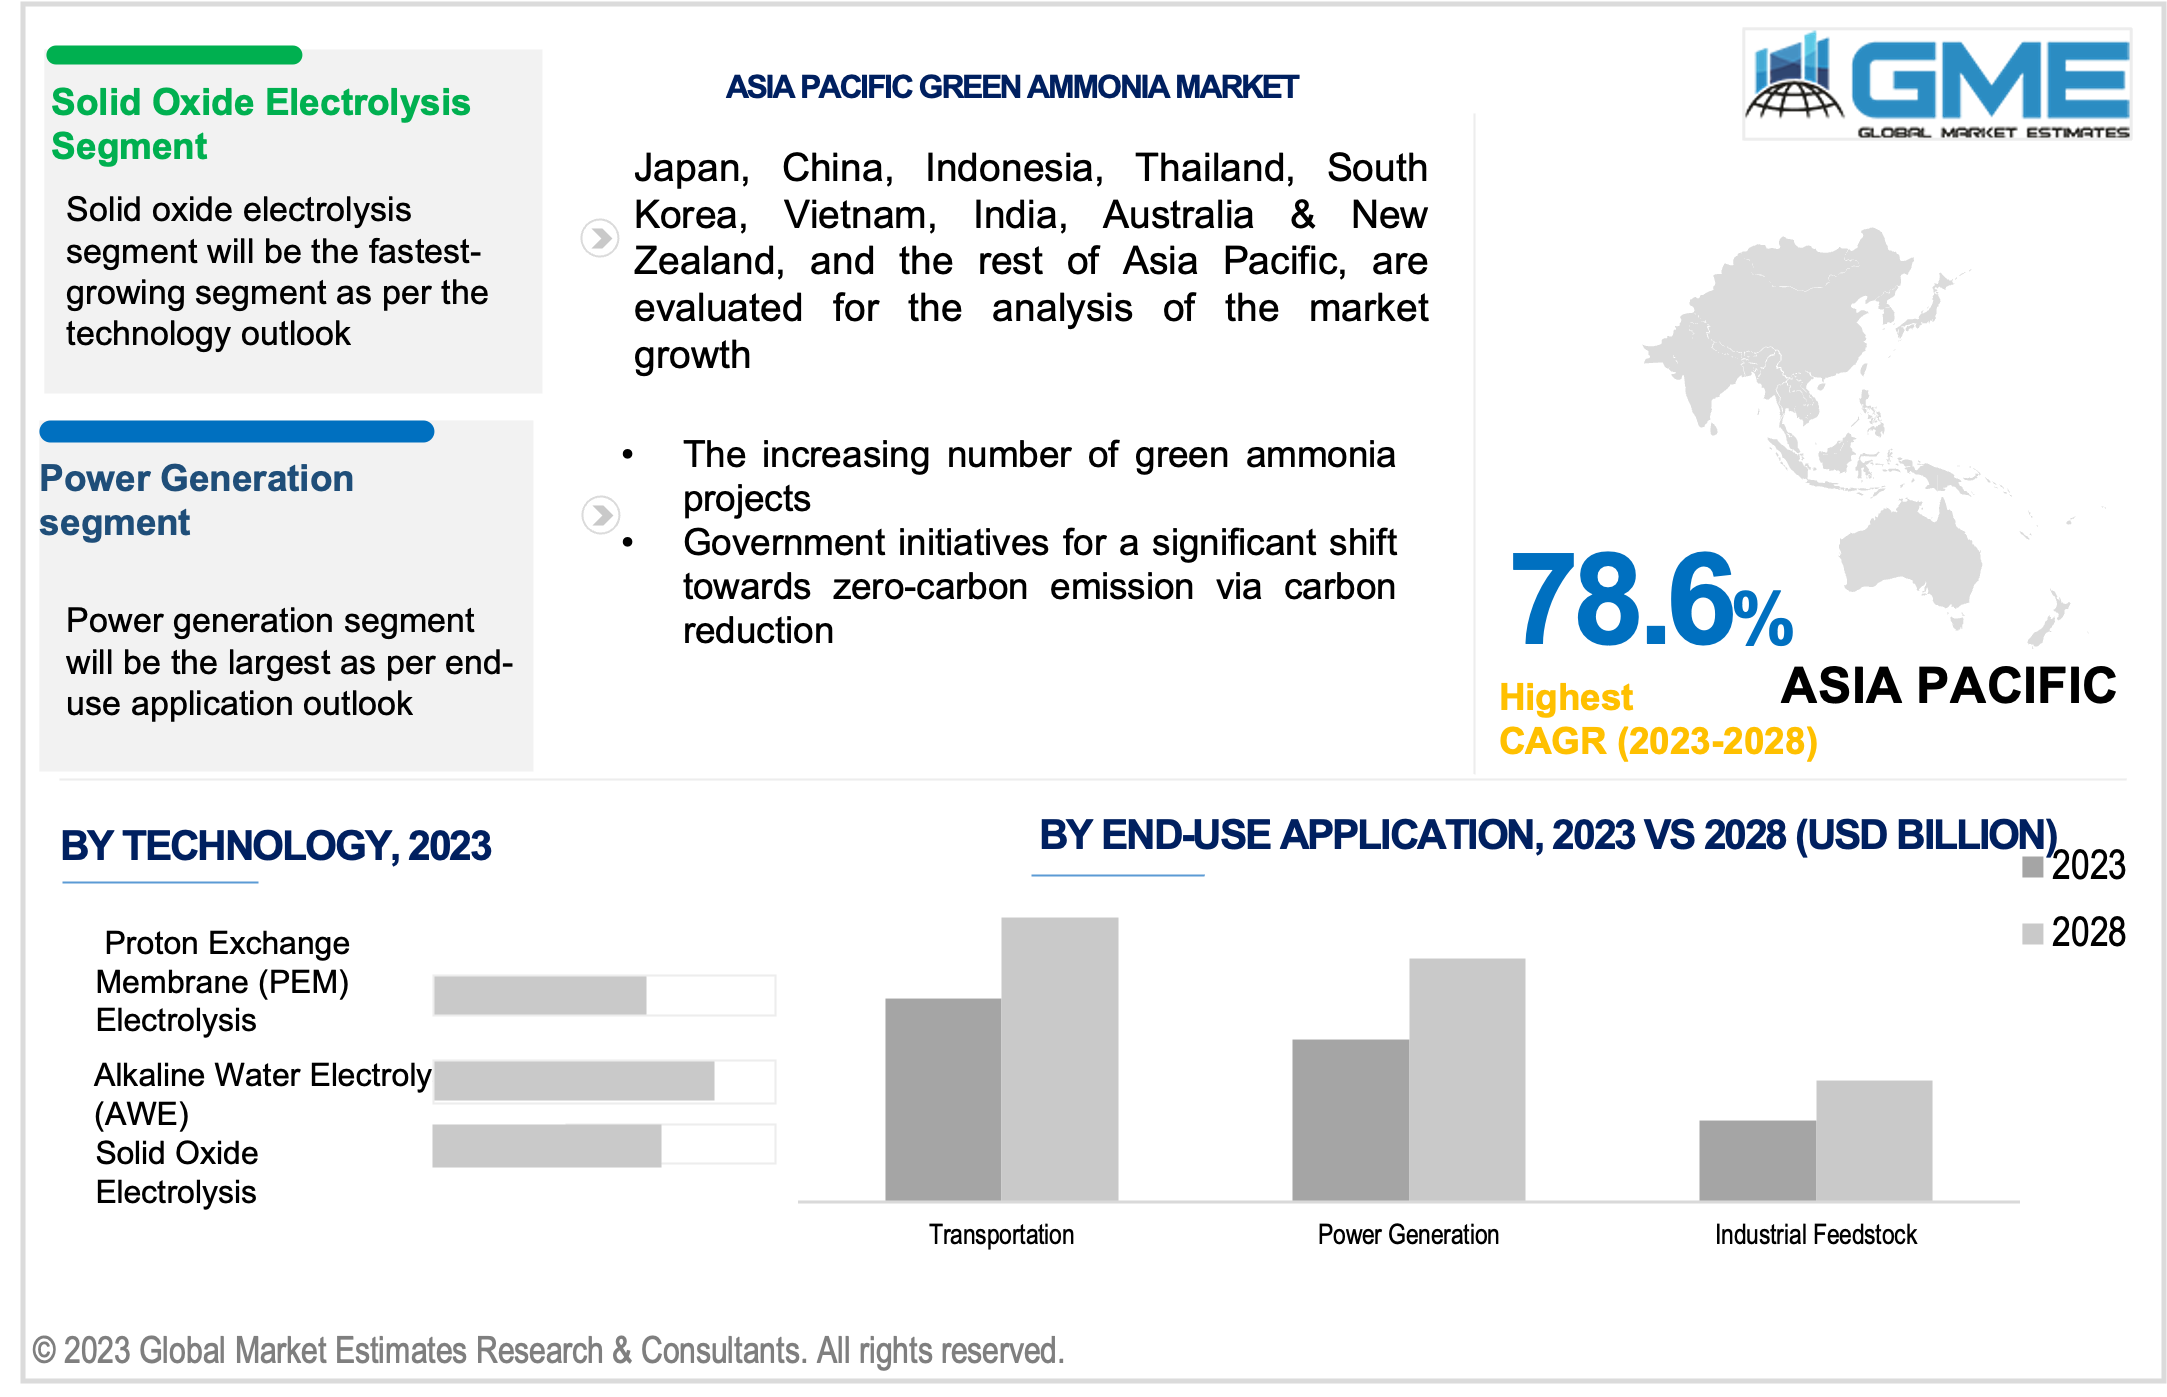
The solid oxide electrolysis segment is expected to be the fastest-growing segment in the market from 2023-2028 owing to increasing demand for fuel cells. The solid oxide electrolysis process is used to produce green hydrogen gas from surplus electricity generated from renewable energy sources which require less electrical energy to produce a large quantity of high-purity hydrogen.
Alkaline water electrolysis (AWE) holds the largest share of the green ammonia market owing to the increasing consumption of green hydrogen as a transportation fuel around the world. Alkaline water electrolysis (AWE) is a well-known, reliable, conventional, and dependable type of electrolysis and it's an economical innovation that is still a very new process. The AWE method is frequently used to produce green ammonia since the catalyst is cheaper and has a higher gas purity. The producers make these R&D efforts in order to produce effective outcomes that stimulate segment expansion.
The power generation segment is anticipated to be the fastest-growing segment in the market from 2023-2028. The cleaner form of gas is green ammonia, which may be created through electrolysis and used as a renewable energy source for power generation. By using an electrolysis process, surplus renewable energy generated in far-off places can be converted into carbon-free ammonia, which can be used as a long-term fuel for power production. The rising deployment of renewable energy sources is due to the growing government initiatives to promote completely zero-carbon agricultural activities as well as the growing acceptance of green ammonia in the power industry.
Transportation segment holds the largest share of the green ammonia market. The segment growth is attributed to the current fuel energy crisis, increasing consumption of green fuel to achieve zero CO2 emission. The transportation segment currently accounts for 3% of global greenhouse gas emissions which boosts the use of green ammonia and is expected to account for more than 24% of the fuel supply used in the marine industry for transportation.
Geographically, the market is anticipated to remain stable in North America due to the increasing number of renewable energy sources projects, government initiatives for the production of green fuel, rising investments for eco-friendly hydrogen, and the rising prevalence of employing environmental fertilizers.
Asia Pacific is predicted to have rapid growth. One of the key factors that are anticipated to provide the market with lucrative growth opportunities over the forecast period is the growing signi?cance of green ammonia as a source of hydrogen, and the rising focus on the development of renewable fuel for transportation and power generation. Additionally, there is a rising awareness that using green ammonia in the proper amounts to produce agricultural fertiliser, electricity, and other products does not affect the environment, which ultimately drives the market trend. Furthermore, Australia will experience the strongest growth in the APAC area during the projected period because of rising public spending on developing a green hydrogen economy there.
Europe’s green ammonia market is expected to have significant growth due to the increase in the production of green electricity in rural areas and government initiatives to reduce the carbon footprint of producing traditional ammonia.
Siemens energy, Man energy solutions, ThyssenKrupp AG, Nel ASA, ITM Power, Green Hydrogen Systems, McPhy Energy S.A., Electrochaea, Hydrogenics, and Starfire Energy among others, are some of the key players in the global green ammonia market.
Please note: This is not an exhaustive list of companies profiled in the report.
1 STRATEGIC INSIGHTS ON NEW REVENUE POCKETS
1.1 Strategic Opportunity & Attractiveness Analysis
1.1.1 Hot Revenue Pockets
1.1.2 Market Attractiveness Score
1.1.3 Revenue Impacting Opportunity
1.1.4 High Growing Region/Country
1.1.5 Competitor Analysis
1.1.6 Consumer Analysis
1.2 Global Market Estimates' View
1.3 Strategic Insights across Business Functions
1.3.1 For Chief Executive Officers
1.3.2 For Chief Marketing Officers
1.3.3 For Chief Strategy Officers
1.4 Evaluate the Potential of your Existing Business Lines vs. New Lines to Enter Into
2.1 Technological Adoption Rate
2.2 Current Trend Impact Analysis
2.3 Future Trend Impact Analysis
2.4 Data Metrics on Feed Stocks
3.1.2 Adjacent Market Opportunities
3.1.3 Ancillary Market Opportunities
3.2.1 Market Drivers: Impact Analysis
3.2.2 Market Restraints: Impact Analysis
3.2.3 Market Opportunities: Impact Analysis
3.2.4 Market Challenges: Impact Analysis
3.3.1 Porter’s Five Forces Analysis
3.3.1.1 Threat of New Entrants
3.3.1.2 Threat of New Substitutes
3.3.1.3 Bargaining Power of Suppliers
3.3.1.4 Bargaining Power of Buyers
3.3.1.5 Intensity of Competitive Rivalry
3.3.2 SWOT Analysis; By Factor (Political & Legal, Economic, and Technological)
4 GLOBAL GREEN AMMONIA MARKET, BY TECHNOLOGY
4.2 Green Ammonia Market: Technology Scope Key Takeaways
4.3 Revenue Growth Analysis, 2022 & 2028
4.4 Alkaline Water Electrolysis (AWE)
4.4.1 Alkaline Water Electrolysis (AWE) Market Estimates and Forecast, 2020-2028 (USD Million)
4.5 Proton Exchange Membrane (PEM) Electrolysis
4.6.1 Solid Oxide Electrolysis Market Estimates and Forecast, 2020-2028 (USD Million)
5 GLOBAL GREEN AMMONIA MARKET, BY END-USE APPLICATION
5.2 Green Ammonia Market: End-Use Application Scope Key Takeaways
5.3 Revenue Growth Analysis, 2022 & 2028
5.4.1 Transportation Market Estimates and Forecast, 2020-2028 (USD Million)
5.5.1 Power Generation Market Estimates and Forecast, 2020-2028 (USD Million)
5.6.1 Industrial Feedstock Market Estimates and Forecast, 2020-2028 (USD Million)
6 GLOBAL GREEN AMMONIA MARKET, BY REGION
6.2 North America Green Ammonia Market Estimates and Forecast, 2020-2028 (USD Million)
6.2.3.1 U.S. Green Ammonia Market Estimates and Forecast, 2020-2028 (USD Million)
6.2.3.1.2 By End-Use Application
6.2.3.2 Canada Green Ammonia Market Estimates and Forecast, 2020-2028 (USD Million)
6.2.3.2.2 By End-Use Application
6.2.3.3 Mexico Green Ammonia Market Estimates and Forecast, 2020-2028 (USD Million)
6.2.3.3.2 By End-Use Application
6.3 Europe Green Ammonia Market Estimates and Forecast, 2020-2028 (USD Million)
6.3.3.1 Germany Green Ammonia Market Estimates and Forecast, 2020-2028 (USD Million)
6.3.3.1.2 By End-Use Application
6.3.3.2 U.K. Green Ammonia Market Estimates and Forecast, 2020-2028 (USD Million)
6.3.3.2.2 By End-Use Application
6.3.3.3 France Green Ammonia Market Estimates and Forecast, 2020-2028 (USD Million)
6.3.3.3.2 By End-Use Application
6.3.3.4 Italy Green Ammonia Market Estimates and Forecast, 2020-2028 (USD Million)
6.3.3.4.2 By End-Use Application
6.3.3.5 Spain Green Ammonia Market Estimates and Forecast, 2020-2028 (USD Million)
6.3.3.5.2 By End-Use Application
6.3.3.6 Netherlands Green Ammonia Market Estimates and Forecast, 2020-2028 (USD Million)
6.3.3.6.2 By End-Use Application
6.3.3.7 Rest of Europe Green Ammonia Market Estimates and Forecast, 2020-2028 (USD Million)
6.3.3.6.2 By End-Use Application
6.4 Asia Pacific Green Ammonia Market Estimates and Forecast, 2020-2028 (USD Million)
6.4.3.1 China Green Ammonia Market Estimates and Forecast, 2020-2028 (USD Million)
6.4.3.1.2 By End-Use Application
6.4.3.2 Japan Green Ammonia Market Estimates and Forecast, 2020-2028 (USD Million)
6.4.3.2.2 By End-Use Application
6.4.3.3 India Green Ammonia Market Estimates and Forecast, 2020-2028 (USD Million)
6.4.3.3.2 By End-Use Application
6.4.3.4 South Korea Green Ammonia Market Estimates and Forecast, 2020-2028 (USD Million)
6.4.3.4.2 By End-Use Application
6.4.3.5 Singapore Green Ammonia Market Estimates and Forecast, 2020-2028 (USD Million)
6.4.3.5.2 By End-Use Application
6.4.3.6 Malaysia Green Ammonia Market Estimates and Forecast, 2020-2028 (USD Million)
6.4.3.6.2 By End-Use Application
6.4.3.7 Thailand Green Ammonia Market Estimates and Forecast, 2020-2028 (USD Million)
6.4.3.6.2 By End-Use Application
6.4.3.8 Indonesia Green Ammonia Market Estimates and Forecast, 2020-2028 (USD Million)
6.4.3.7.2 By End-Use Application
6.4.3.9 Vietnam Green Ammonia Market Estimates and Forecast, 2020-2028 (USD Million)
6.4.3.8.2 By End-Use Application
6.4.3.10 Taiwan Green Ammonia Market Estimates and Forecast, 2020-2028 (USD Million)
6.4.3.10.2 By End-Use Application
6.4.3.11 Rest of Asia Pacific Green Ammonia Market Estimates and Forecast, 2020-2028 (USD Million)
6.4.3.11.2 By End-Use Application
6.5 Middle East & Africa Green Ammonia Market Estimates and Forecast, 2020-2028 (USD Million)
6.5.3.1 Saudi Arabia Green Ammonia Market Estimates and Forecast, 2020-2028 (USD Million)
6.5.3.1.2 By End-Use Application
6.5.3.2 U.A.E. Green Ammonia Market Estimates and Forecast, 2020-2028 (USD Million)
6.5.3.2.2 By End-Use Application
6.5.3.3 Israel Green Ammonia Market Estimates and Forecast, 2020-2028 (USD Million)
6.5.3.3.2 By End-Use Application
6.5.3.4 South Africa Green Ammonia Market Estimates and Forecast, 2020-2028 (USD Million)
6.5.3.4.2 By End-Use Application
6.5.3.5.2 By End-Use Application
6.6 Central & South America Green Ammonia Market Estimates and Forecast, 2020-2028 (USD Million)
6.6.3.1 Brazil Green Ammonia Market Estimates and Forecast, 2020-2028 (USD Million)
6.6.3.1.2 By End-Use Application
6.6.3.2 Argentina Green Ammonia Market Estimates and Forecast, 2020-2028 (USD Million)
6.6.3.2.2 By End-Use Application
6.6.3.3 Chile Green Ammonia Market Estimates and Forecast, 2020-2028 (USD Million)
6.6.3.3.2 By End-Use Application
6.6.3.3.2 By End-Use Application
7.1 Company Market Share Analysis
7.2 Four Quadrant Positioning Matrix
7.4.1.1 Business Description & Financial Analysis
7.4.1.3 Products & Services Offered
7.4.1.4 Strategic Alliances between Business Partners
7.4.2.1 Business Description & Financial Analysis
7.4.2.3 Products & Services Offered
7.4.2.4 Strategic Alliances between Business Partners
7.4.3.1 Business Description & Financial Analysis
7.4.3.3 Products & Services Offered
7.4.3.4 Strategic Alliances between Business Partners
7.4.4.1 Business Description & Financial Analysis
7.4.4.3 Products & Services Offered
7.4.4.4 Strategic Alliances between Business Partners
7.4.5.1 Business Description & Financial Analysis
7.4.5.3 Products & Services Offered
7.4.5.4 Strategic Alliances between Business Partners
7.4.6.1 Business Description & Financial Analysis
7.4.6.3 Products & Services Offered
7.4.6.4 Strategic Alliances between Business Partners
7.4.7.1 Business Description & Financial Analysis
7.4.7.3 Products & Services Offered
7.4.7.4 Strategic Alliances between Business Partners
7.4.8.1 Business Description & Financial Analysis
7.4.8.3 Products & Services Offered
7.4.8.4 Strategic Alliances between Business Partners
7.4.9.1 Business Description & Financial Analysis
7.4.9.3 Products & Services Offered
7.4.9.4 Strategic Alliances between Business Partners
7.4.10.1 Business Description & Financial Analysis
7.4.10.3 Products & Services Offered
7.4.10.4 Strategic Alliances between Business Partners
7.4.11.1 Business Description & Financial Analysis
7.4.11.3 Products & Services Offered
7.4.11.4 Strategic Alliances between Business Partners
8.1.2 Market Scope & Segmentation
8.2.1.2 GMEs Internal Data Repository
8.2.1.3 Secondary Resources & Third Party Perspectives
8.2.1.4 Company Information Sources
8.2.2.1 Various End-Use Application of Respondents for Primary Interviews
8.2.2.2 Number of Interviews Conducted throughout the Research Process
8.2.2.4 Discussion Guide for Primary Participants
8.2.3.1 Expert Panels Across 30+ Industry
8.2.4.1 Paid Local Experts Across 30+ Industry Across each Region
8.3.1.1 Macro-Economic Indicators Considered
8.3.1.2 Micro-Economic Indicators Considered
8.3.2.1 Company Share Analysis Approach
8.3.2.2 Estimation of Potential Product Sales
8.4.2 Time Series, Cross Sectional & Panel Data Analysis
8.5.1 Inhouse AI Based Real Time Analytics Tool
8.5.2 Output From Desk & Primary Research
8.6 Research Assumptions & Limitations
LIST OF TABLES
1 Global Green Ammonia Market, By Technology, 2020-2028 (USD Mllion)
2 Alkaline Water Electrolysis (AWE) Market, By Region, 2020-2028 (USD Mllion)
3 Proton Exchange Membrane (PEM) Electrolysis Market, By Region, 2020-2028 (USD Mllion)
4 Solid Oxide Electrolysis Market, By Region, 2020-2028 (USD Mllion)
5 Global Green Ammonia Market, By End-Use Application, 2020-2028 (USD Mllion)
6 Transportation Market, By Region, 2020-2028 (USD Mllion)
7 Power Generation Market, By Region, 2020-2028 (USD Mllion)
8 Industrial Feedstock Market, By Region, 2020-2028 (USD Mllion)
9 Regional Analysis, 2020-2028 (USD Mllion)
10 North America Green Ammonia Market, By Technology, 2020-2028 (USD Mllion)
11 North America Green Ammonia Market, By End-Use Application, 2020-2028 (USD Mllion)
12 U.S. Green Ammonia Market, By Technology, 2020-2028 (USD Mllion)
13 U.S. Green Ammonia Market, By End-Use Application, 2020-2028 (USD Mllion)
14 Canada Green Ammonia Market, By Technology, 2020-2028 (USD Mllion)
15 Canada Green Ammonia Market, By End-Use Application, 2020-2028 (USD Mllion)
16 Mexico Green Ammonia Market, By Technology, 2020-2028 (USD Mllion)
17 Mexico Green Ammonia Market, By End-Use Application, 2020-2028 (USD Mllion)
18 Europe Green Ammonia Market, By Technology, 2020-2028 (USD Mllion)
19 Europe Green Ammonia Market, By End-Use Application, 2020-2028 (USD Mllion)
20 Germany Green Ammonia Market, By Technology, 2020-2028 (USD Mllion)
21 Germany Green Ammonia Market, By End-Use Application, 2020-2028 (USD Mllion)
22 U.K. Green Ammonia Market, By Technology, 2020-2028 (USD Mllion)
23 U.K. Green Ammonia Market, By End-Use Application, 2020-2028 (USD Mllion)
24 France Green Ammonia Market, By Technology, 2020-2028 (USD Mllion)
25 France Green Ammonia Market, By End-Use Application, 2020-2028 (USD Mllion)
26 Italy Green Ammonia Market, By Technology, 2020-2028 (USD Mllion)
27 Italy Green Ammonia Market, By End-Use Application, 2020-2028 (USD Mllion)
28 Spain Green Ammonia Market, By Technology, 2020-2028 (USD Mllion)
29 Spain Green Ammonia Market, By End-Use Application, 2020-2028 (USD Mllion)
30 Netherlands Green Ammonia Market, By Technology, 2020-2028 (USD Mllion)
31 Netherlands Green Ammonia Market, By End-Use Application, 2020-2028 (USD Mllion)
32 Rest Of Europe Green Ammonia Market, By Technology, 2020-2028 (USD Mllion)
33 Rest Of Europe Green Ammonia Market, By End-Use Application, 2020-2028 (USD Mllion)
34 Asia Pacific Green Ammonia Market, By Technology, 2020-2028 (USD Mllion)
35 Asia Pacific Green Ammonia Market, By End-Use Application, 2020-2028 (USD Mllion)
36 China Green Ammonia Market, By Technology, 2020-2028 (USD Mllion)
37 China Green Ammonia Market, By End-Use Application, 2020-2028 (USD Mllion)
38 Japan Green Ammonia Market, By Technology, 2020-2028 (USD Mllion)
39 Japan Green Ammonia Market, By End-Use Application, 2020-2028 (USD Mllion)
40 India Green Ammonia Market, By Technology, 2020-2028 (USD Mllion)
41 India Green Ammonia Market, By End-Use Application, 2020-2028 (USD Mllion)
42 South Korea Green Ammonia Market, By Technology, 2020-2028 (USD Mllion)
43 South Korea Green Ammonia Market, By End-Use Application, 2020-2028 (USD Mllion)
44 Singapore Green Ammonia Market, By Technology, 2020-2028 (USD Mllion)
45 Singapore Green Ammonia Market, By End-Use Application, 2020-2028 (USD Mllion)
46 Thailand Green Ammonia Market, By Technology, 2020-2028 (USD Mllion)
47 Thailand Green Ammonia Market, By End-Use Application, 2020-2028 (USD Mllion)
48 Malaysia Green Ammonia Market, By Technology, 2020-2028 (USD Mllion)
49 Malaysia Green Ammonia Market, By End-Use Application, 2020-2028 (USD Mllion)
50 Indonesia Green Ammonia Market, By Technology, 2020-2028 (USD Mllion)
51 Indonesia Green Ammonia Market, By End-Use Application, 2020-2028 (USD Mllion)
52 Vietnam Green Ammonia Market, By Technology, 2020-2028 (USD Mllion)
53 Vietnam Green Ammonia Market, By End-Use Application, 2020-2028 (USD Mllion)
54 Taiwan Green Ammonia Market, By Technology, 2020-2028 (USD Mllion)
55 Taiwan Green Ammonia Market, By End-Use Application, 2020-2028 (USD Mllion)
56 Rest of APAC Green Ammonia Market, By Technology, 2020-2028 (USD Mllion)
57 Rest of APAC Green Ammonia Market, By End-Use Application, 2020-2028 (USD Mllion)
58 Middle East & Africa Green Ammonia Market, By Technology, 2020-2028 (USD Mllion)
59 Middle East & Africa Green Ammonia Market, By End-Use Application, 2020-2028 (USD Mllion)
60 Saudi Arabia Green Ammonia Market, By Technology, 2020-2028 (USD Mllion)
61 Saudi Arabia Green Ammonia Market, By End-Use Application, 2020-2028 (USD Mllion)
62 UAE Green Ammonia Market, By Technology, 2020-2028 (USD Mllion)
63 UAE Green Ammonia Market, By End-Use Application, 2020-2028 (USD Mllion)
64 Israel Green Ammonia Market, By Technology, 2020-2028 (USD Mllion)
65 Israel Green Ammonia Market, By End-Use Application, 2020-2028 (USD Mllion)
66 South Africa Green Ammonia Market, By Technology, 2020-2028 (USD Mllion)
67 South Africa Green Ammonia Market, By End-Use Application, 2020-2028 (USD Mllion)
68 Rest Of Middle East & Africa Green Ammonia Market, By Technology, 2020-2028 (USD Mllion)
69 Rest Of Middle East & Africa Green Ammonia Market, By End-Use Application, 2020-2028 (USD Mllion)
70 Central & South America Green Ammonia Market, By Technology, 2020-2028 (USD Mllion)
71 Central & South America Green Ammonia Market, By End-Use Application, 2020-2028 (USD Mllion)
72 Brazil Green Ammonia Market, By Technology, 2020-2028 (USD Mllion)
73 Brazil Green Ammonia Market, By End-Use Application, 2020-2028 (USD Mllion)
74 Chile Green Ammonia Market, By Technology, 2020-2028 (USD Mllion)
75 Chile Green Ammonia Market, By End-Use Application, 2020-2028 (USD Mllion)
76 Argentina Green Ammonia Market, By Technology, 2020-2028 (USD Mllion)
77 Argentina Green Ammonia Market, By End-Use Application, 2020-2028 (USD Mllion)
78 Rest Of Central & South America Green Ammonia Market, By Technology, 2020-2028 (USD Mllion)
79 Rest Of Central & South America Green Ammonia Market, By End-Use Application, 2020-2028 (USD Mllion)
80 Siemens energy: Products & Services Offering
81 Man energy solutions: Products & Services Offering
82 ThyssenKrupp AG: Products & Services Offering
83 Nel ASA: Products & Services Offering
84 ITM Power: Products & Services Offering
85 STARFIRE ENERGY: Products & Services Offering
86 GREEN HYDROGEN SYSTEMS : Products & Services Offering
87 MCPHY ENERGY S.A.: Products & Services Offering
88 Electrochaea, Inc: Products & Services Offering
89 Hydrogenics: Products & Services Offering
90 Other Companies: Products & Services Offering
LIST OF FIGURES
1 Global Green Ammonia Market Overview
2 Global Green Ammonia Market Value From 2020-2028 (USD Mllion)
3 Global Green Ammonia Market Share, By Technology (2022)
4 Global Green Ammonia Market Share, By End-Use Application (2022)
5 Global Green Ammonia Market, By Region (Asia Pacific Market)
6 Technological Trends In Global Green Ammonia Market
7 Four Quadrant Competitor Positioning Matrix
8 Impact Of Macro & Micro Indicators On The Market
9 Impact Of Key Drivers On The Global Green Ammonia Market
10 Impact Of Challenges On The Global Green Ammonia Market
11 Porter’s Five Forces Analysis
12 Global Green Ammonia Market: By Technology Scope Key Takeaways
13 Global Green Ammonia Market, By Technology Segment: Revenue Growth Analysis
14 Alkaline Water Electrolysis (AWE) Market, By Region, 2020-2028 (USD Mllion)
15 Proton Exchange Membrane (PEM) Electrolysis Market, By Region, 2020-2028 (USD Mllion)
16 Solid Oxide Electrolysis Market, By Region, 2020-2028 (USD Mllion)
17 Global Green Ammonia Market: By End-Use Application Scope Key Takeaways
18 Global Green Ammonia Market, By End-Use Application Segment: Revenue Growth Analysis
19 Transportation Market, By Region, 2020-2028 (USD Mllion)
20 Power Generation Market, By Region, 2020-2028 (USD Mllion)
21 Industrial Feedstock Market, By Region, 2020-2028 (USD Mllion)
22 Regional Segment: Revenue Growth Analysis
23 Global Green Ammonia Market: Regional Analysis
24 North America Green Ammonia Market Overview
25 North America Green Ammonia Market, By Technology
26 North America Green Ammonia Market, By End-Use Application
27 North America Green Ammonia Market, By Country
28 U.S. Green Ammonia Market, By Technology
29 U.S. Green Ammonia Market, By End-Use Application
30 Canada Green Ammonia Market, By Technology
31 Canada Green Ammonia Market, By End-Use Application
32 Mexico Green Ammonia Market, By Technology
33 Mexico Green Ammonia Market, By End-Use Application
34 Four Quadrant Positioning Matrix
35 Company Market Share Analysis
36 Siemens energy: Company Snapshot
37 Siemens energy: SWOT Analysis
38 Siemens energy: Geographic Presence
39 Man energy solutions: Company Snapshot
40 Man energy solutions: SWOT Analysis
41 Man energy solutions: Geographic Presence
42 ThyssenKrupp AG: Company Snapshot
43 ThyssenKrupp AG: SWOT Analysis
44 ThyssenKrupp AG: Geographic Presence
45 Nel ASA: Company Snapshot
46 Nel ASA: Swot Analysis
47 Nel ASA: Geographic Presence
48 ITM Power: Company Snapshot
49 ITM Power: SWOT Analysis
50 ITM Power: Geographic Presence
51 STARFIRE ENERGY: Company Snapshot
52 STARFIRE ENERGY: SWOT Analysis
53 STARFIRE ENERGY: Geographic Presence
54 GREEN HYDROGEN SYSTEMS : Company Snapshot
55 GREEN HYDROGEN SYSTEMS : SWOT Analysis
56 GREEN HYDROGEN SYSTEMS : Geographic Presence
57 MCPHY ENERGY S.A.: Company Snapshot
58 MCPHY ENERGY S.A.: SWOT Analysis
59 MCPHY ENERGY S.A.: Geographic Presence
60 Electrochaea, Inc.: Company Snapshot
61 Electrochaea, Inc.: SWOT Analysis
62 Electrochaea, Inc.: Geographic Presence
63 Hydrogenics: Company Snapshot
64 Hydrogenics: SWOT Analysis
65 Hydrogenics: Geographic Presence
66 Other Companies: Company Snapshot
67 Other Companies: SWOT Analysis
68 Other Companies: Geographic Presence
The Global Green Ammonia Market has been studied from the year 2019 till 2028. However, the CAGR provided in the report is from the year 2023 to 2028. The research methodology involved three stages: Desk research, Primary research, and Analysis & Output from the entire research process.

The desk research involved a robust background study which meant referring to paid and unpaid databases to understand the market dynamics; mapping contracts from press releases; identifying the key players in the market, studying their product portfolio, competition level, annual reports/SEC filings & investor presentations; and learning the demand and supply-side analysis for the Green Ammonia Market.

The primary research activity included telephonic conversations with more than 50 tier 1 industry consultants, distributors, and end-use product manufacturers.

Finally, based on the above thorough research process, an in-depth analysis was carried out considering the following aspects: market attractiveness, current & future market trends, market share analysis, SWOT analysis of the company and customer analytics.

Frequently Asked Questions

This FREE sample includes market data points, ranging from trend analyses to market estimates & forecasts. See for yourself.
Or view our licence options:
Tailor made solutions just for you
80% of our clients seek made-to-order reports. How do you want us to tailor yours?
OUR CLIENTS


