This report was recently updated on August 13 2025 with the latest and most recent
market numbers
Global Green Energy Mobility Market Size, Trends & Analysis - Forecasts to 2029 By Type (Electric Mobility, Battery Electric Vehicle, Hybrid Electric Vehicle, Fuel Cell Electric Vehicle, Plug-in Hybrid Electric Vehicle, Gas Mobility, and Others), By Vehicle Type (Commercial Vehicles, Medium & Heavy Commercial Vehicles, Light Commercial Vehicles, Passengers Vehicles, Two & Three Wheelers, E-Scooters, E-Bikes, and Others), By Application (Urban Logistics, Mass Transit Infrastructure, and Others), and By Region (North America, Asia Pacific, Central and South America, Europe, and Middle East and Africa), Competitive Landscape, Company Market Share Analysis, and End User Analysis
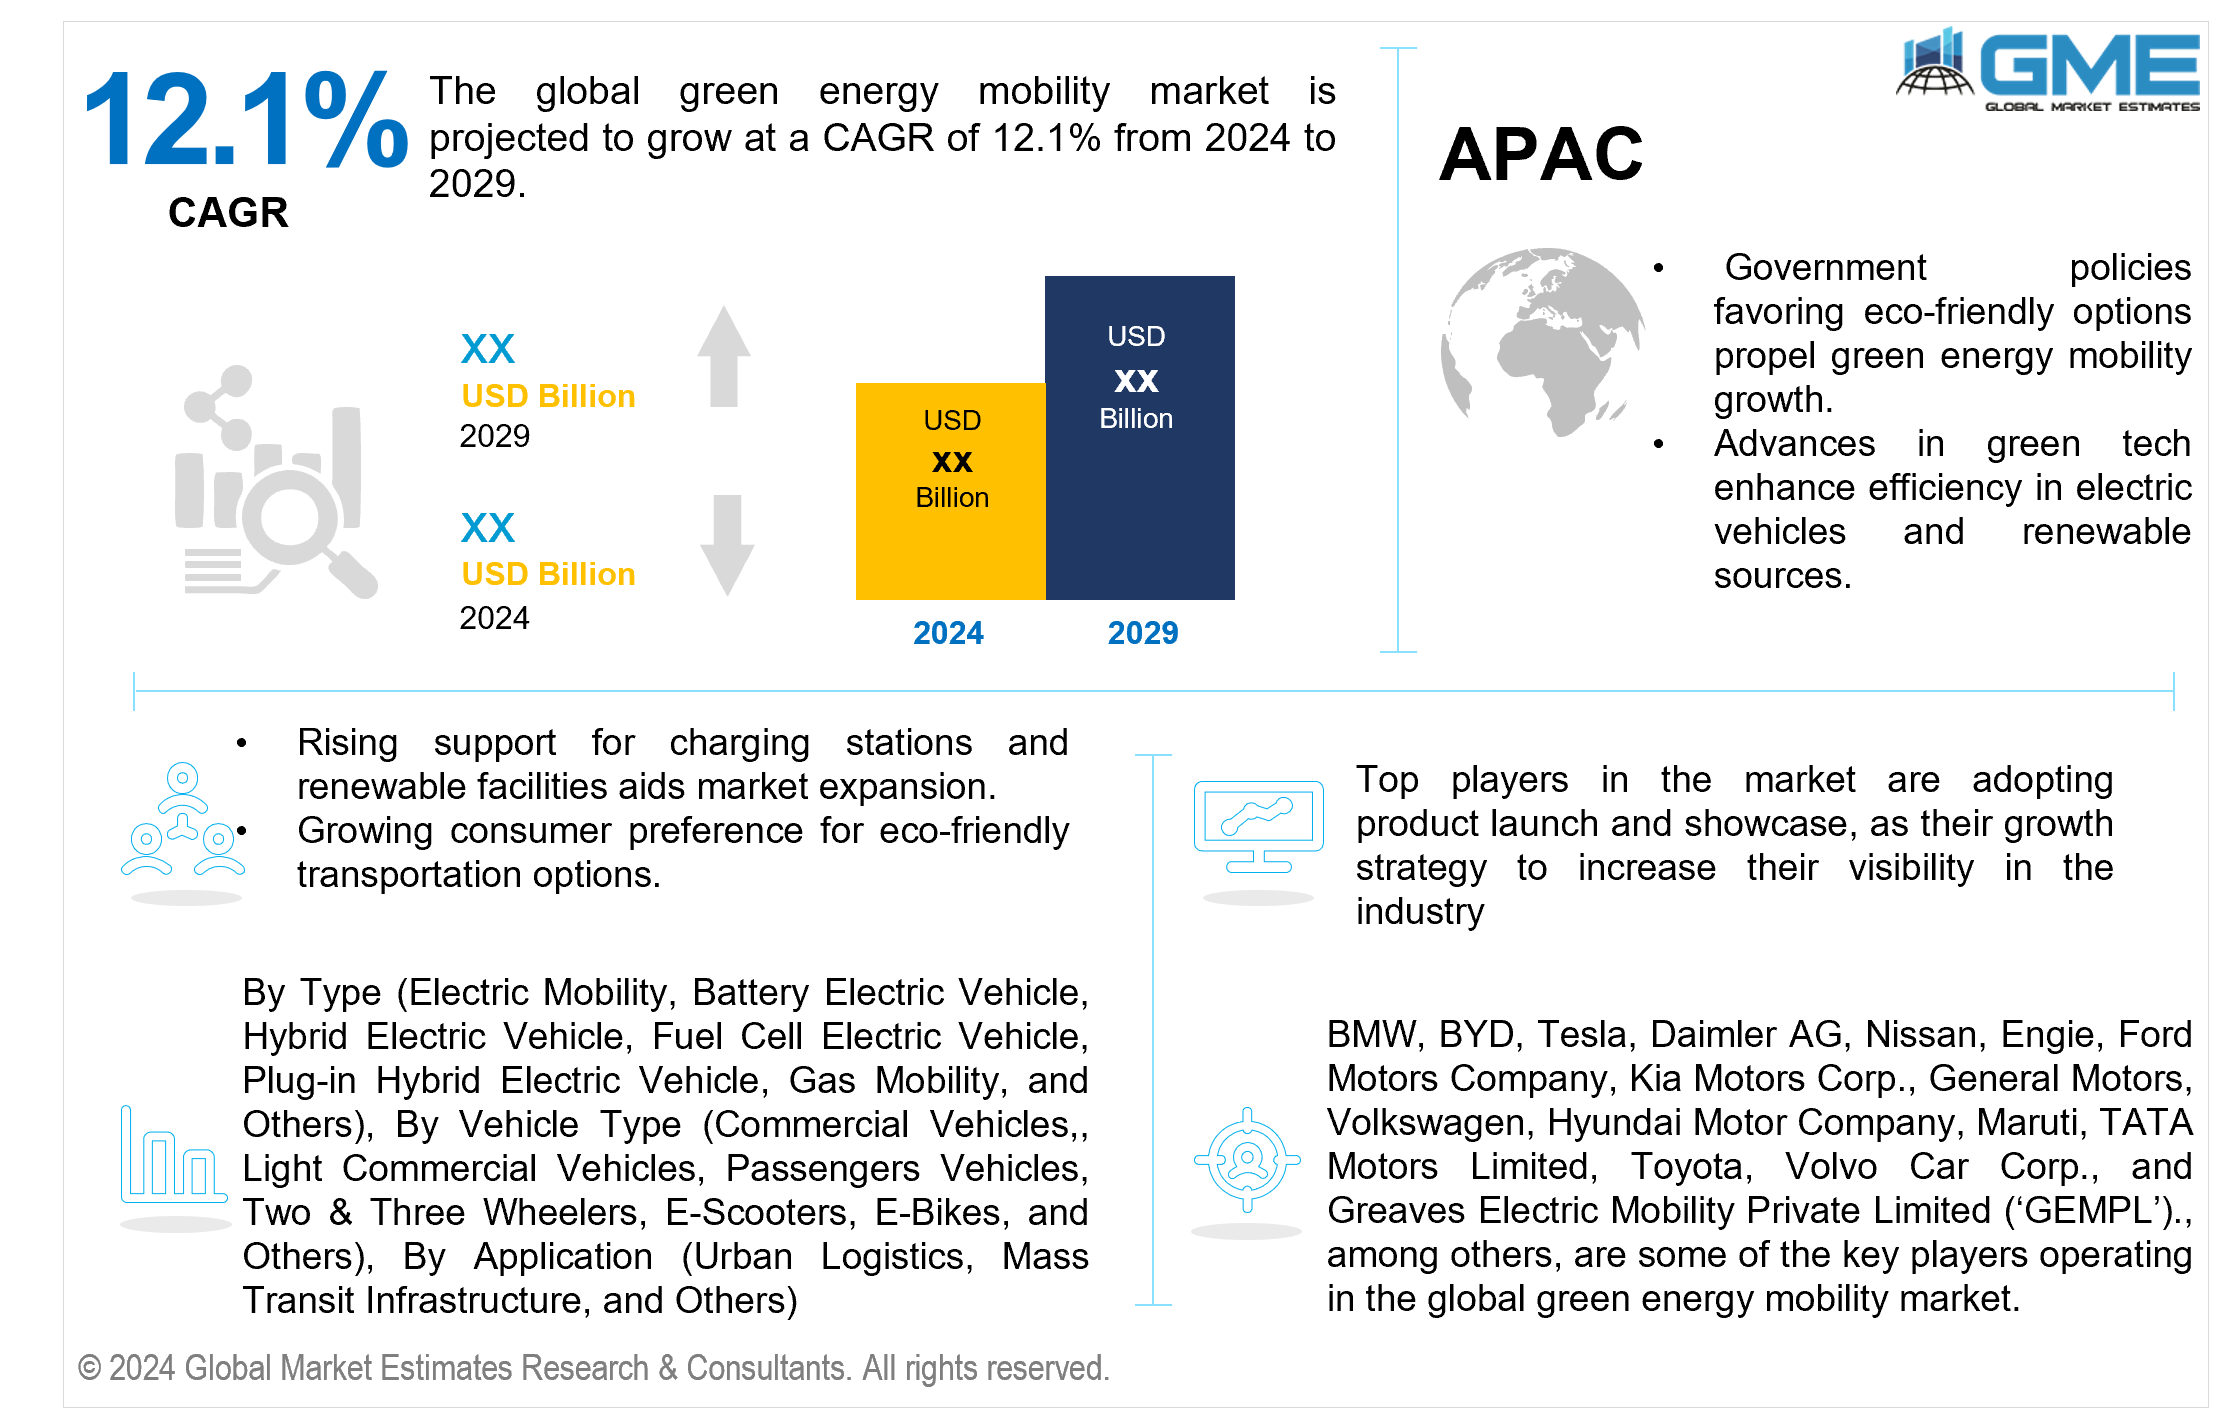
The global green energy mobility market is projected to grow at a CAGR of 12.1% from 2024 to 2029.
Global awareness of climate change drives a shift towards sustainable transportation. Governments, businesses, and consumers seek eco-friendly alternatives, especially electric vehicles, to reduce greenhouse gas emissions and address environmental concerns, emphasizing a commitment to sustainable practices in the transportation sector. According to Global EV Outlook 2023, in 2023 over 2.3 million electric cars were sold in the first quarter.
Increasing exceptionally high prices of oil is further contributing to the sales of electric vehicles which is further contributing to the growth of green energy mobility market. In January 2024, the Brent crude oil spot price increased to USD 80 per barrel, with the increase for USD 2 per barrel from December 2023.
Governments around the world are creating regulations and incentives to encourage the use of green energy transportation solutions. These policies include tax breaks, subsidies, and pollution requirements, with an emphasis on promoting electric cars (EVs) and other forms of sustainable mobility. The goal is to encourage a shift toward environmentally friendly mobility by lowering reliance on traditional automobiles and developing cleaner, more sustainable transportation infrastructure. These government efforts significantly impact market dynamics and the broad adoption of environmentally friendly alternatives in the transportation sector. For instance, on August 16, 2022, President Biden signed the Inflation Reduction Act of 2022, aligning with the Electrification Coalition's (EC) federal electric vehicle (EV) policy priorities. The act focuses on advancing electric transportation to generate jobs, cost savings, and environmental benefits. The EC advocates for four main policy pillars: purchase incentives, charging infrastructure funding, federal fleet electrification funding, and EV manufacturing and supply chain funding.
A restraint in the global green energy mobility market is the uneven and insufficient charging infrastructure for electric cars (EVs). The unequal distribution of charging infrastructure may inhibit EV adoption, particularly in locations with restricted access to charging stations.
The gas mobility segment is expected to hold the largest share of the market. The growth of the segment is due to its versatility and established infrastructure. CNG and LNG are commonly employed as cleaner transportation fuels. Furthermore, improvements in bio-methane and synthetic natural gas have increased the importance of gas mobility, providing a more sustainable and readily available solution for a wide range of vehicles.
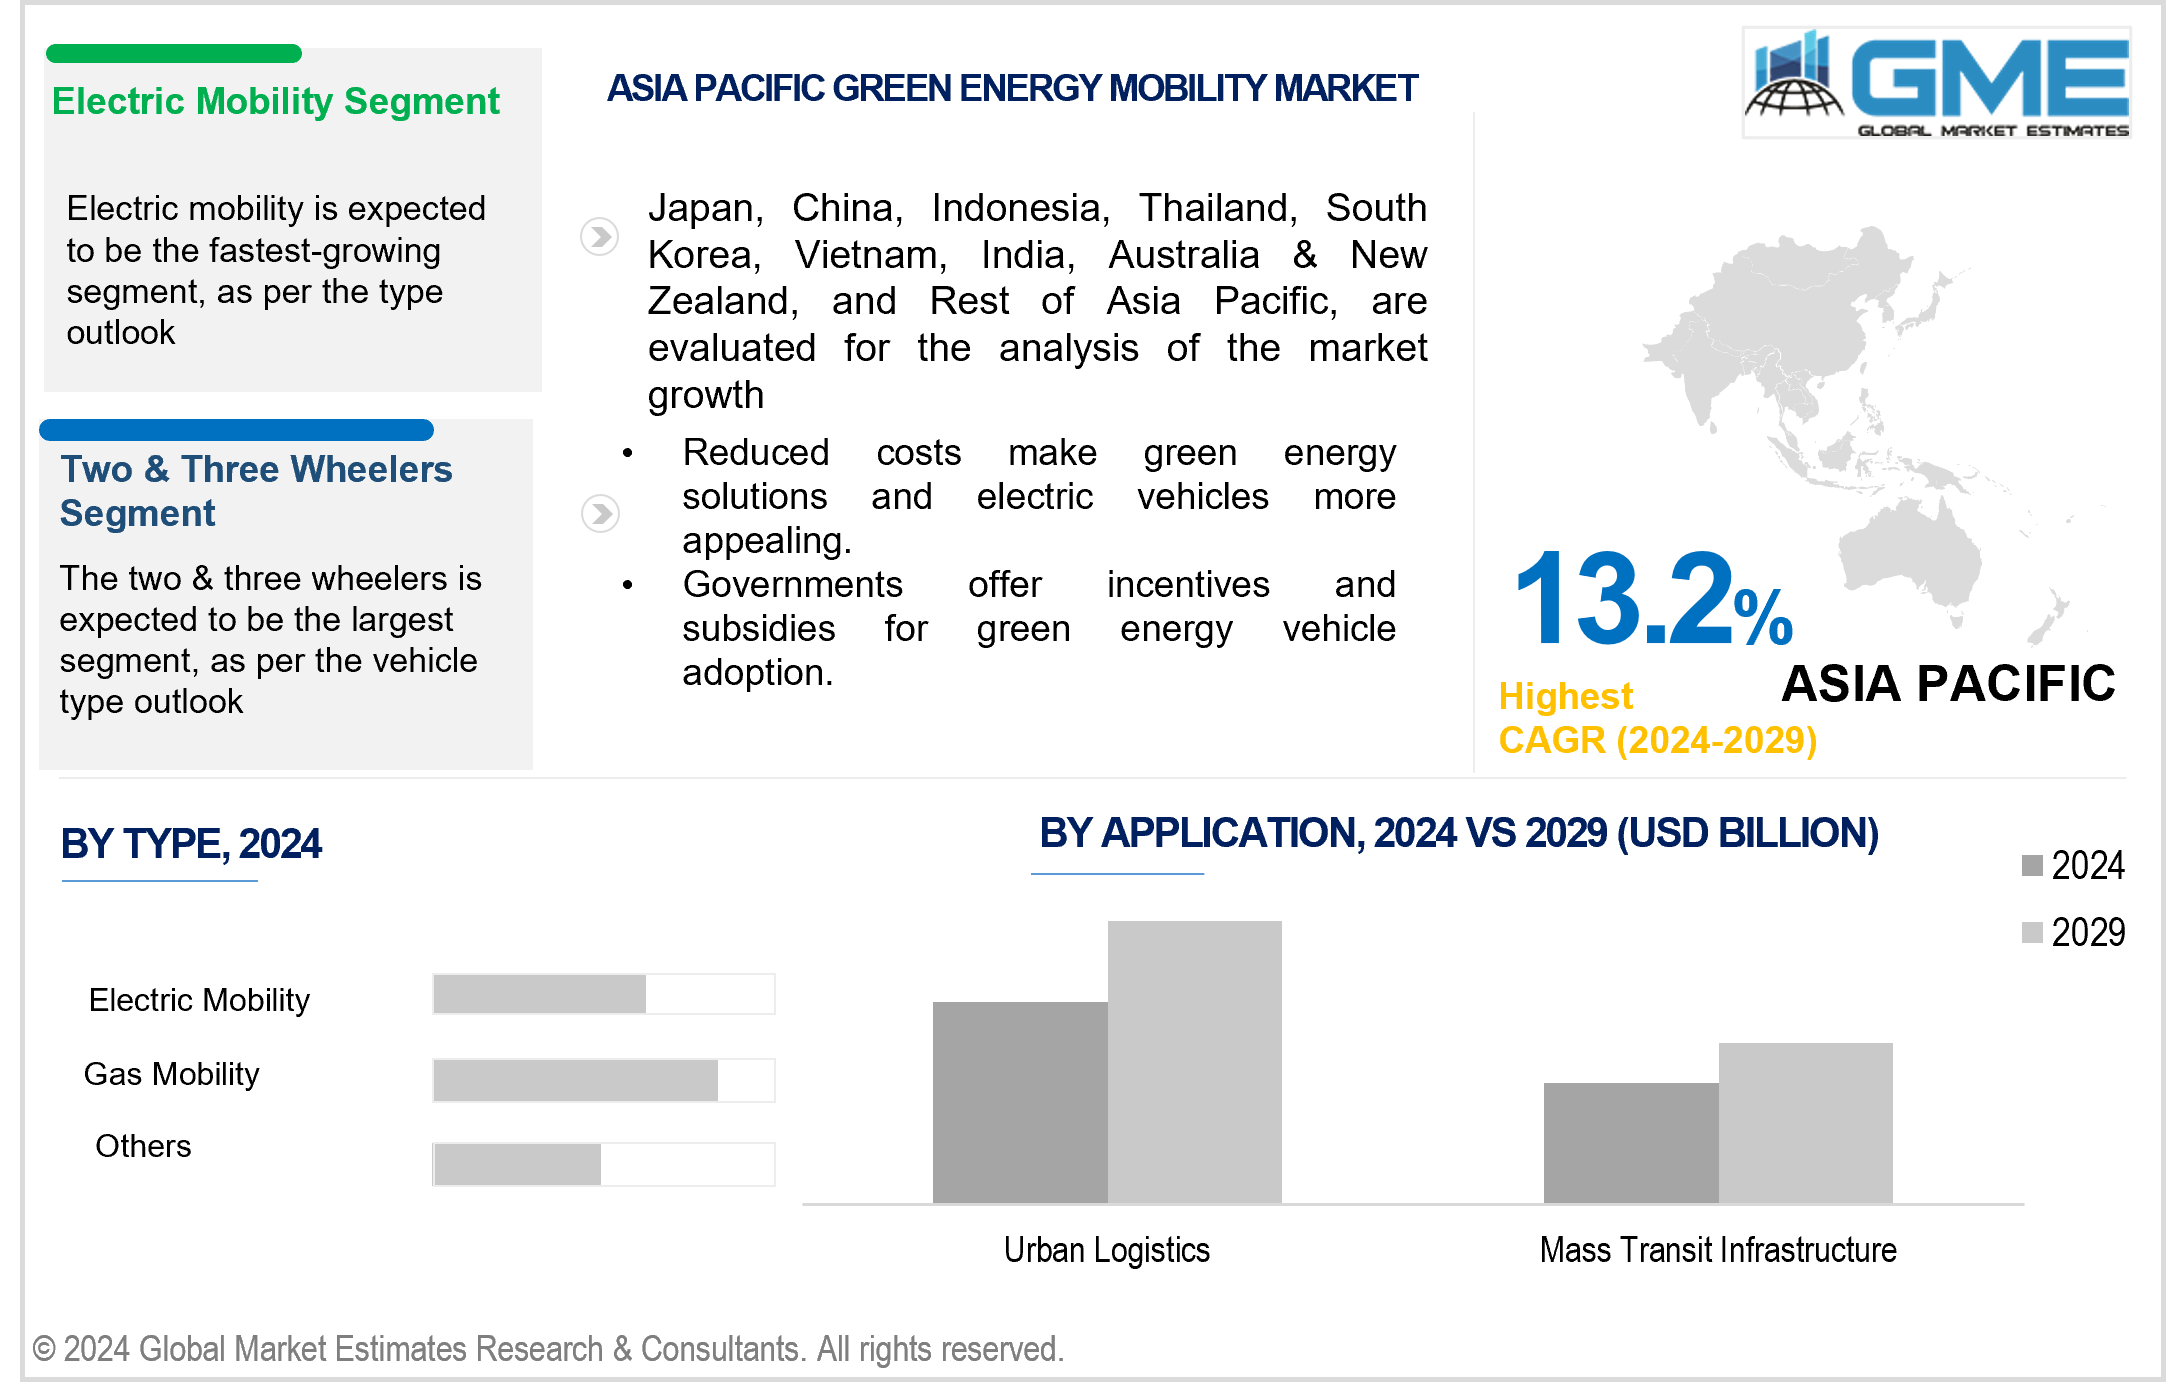
The electric mobility segment is expected to be the fastest-growing segment in the market from 2024-2029. The anticipated growth of the segment is due to rising environmental concerns, government incentives, and developments in electric vehicle technology. Rising awareness, combined with expanded charging infrastructure, encourages the adoption of electric vehicles and advancements for improved performance and affordability, propelling the electric mobility segment growth.
The passengers vehicles segment is anticipated to be the fastest-growing segment in the market from 2024-2029. With rising environmental concerns, there is a surge in demand for electric passenger vehicles, supported by expanding charging infrastructure and technological advancements. This heightened consumer interest contributes to the anticipated growth of the passenger vehicles segment. The launch of new EVs by market players also contributes to the segment growth. Tata Motors is expected to launch three new electric models in 2024, reinforcing its commitment to electric mobility. The upcoming models, including the Punch mini-SUV, Harrier premium off-roader, and Curvv coupe, reflect the company's strategic focus on expanding its electric vehicle portfolio.
The two & three wheelers segment is expected to hold the largest share of the market. The segment's growth is attributed to the increasing use of vehicles, such as electric scooters and motorbikes, for urban commuting since these are economical and efficient. Furthermore, the growing emphasis on sustainable and environmentally friendly mobility solutions has expanded the electric two- and three-wheeler market. Government incentives, subsidies, and increasing awareness of environmental concerns all contribute to the popularity of electric solutions in this vehicle category.
The mass transit infrastructure management segment is anticipated to be the fastest-growing segment in the market from 2024-2029. The expected growth of the segment is due to governments and urban planners worldwide increasingly focusing on improving public transportation systems to alleviate urban congestion, cut emissions, and promote sustainable mobility. Investments in mass transit infrastructure, such as electric buses and charging stations, are expected to increase significantly. The growing need for efficient, environmentally friendly mass transit solutions and supportive government policies and initiatives is anticipated to aid the segment's fastest growth in the global green energy mobility market.
The urban logistics segment is expected to be the largest segment over the forecast period. Urban regions have tremendous issues regarding congestion, pollution, and the need for effective transit options. Green energy mobility options in urban logistics, such as electric delivery trucks and bikes, are becoming more popular as they help to cut emissions and solve environmental issues.
North America is expected to be the largest region in the market due to its robust automotive industry, increased investments in electric vehicle charging networks, and the presence of significant market players such as Ford Motors Company and General Motors, among others. Furthermore, governments enforce strict restrictions to lower emissions and encourage sustainable energy options; with this, customers are also becoming more conscious and accepting of green transportation techniques, further contributing to market growth.
Asia Pacific is predicted to witness rapid growth during the forecast period. The regions have observed a large and expanding population with a growing middle class, which has resulted in increasing urbanization. Several governments of Asia Pacific countries are implementing sustainable and green mobility solutions to solve environmental problems and minimize pollution.
BMW, BYD, Tesla, Daimler AG, Nissan, Engie, Ford Motors Company, Kia Motors Corp., General Motors, Volkswagen, Hyundai Motor Company, Maruti, TATA Motors Limited, Toyota, Volvo Car Corp., Greaves Electric Mobility Private Limited (‘GEMPL’), Ather Energy Private Limited, ATUL Auto Limited, Bajaj Auto Limited, and Hero Electric Vehicles Pvt. Ltd., among others, are some of the key players operating in the global green energy mobility market.
Please note: This is not an exhaustive list of companies profiled in the report.
In January 2024, Daimler Truck AG entered into an initial agreement with Abu Dhabi Future Energy Company (Masdar) to explore the supply of green hydrogen from Abu Dhabi for future fuel cell trucks in Europe. The agreement, aiming to start shipments by 2030, aligns with Masdar's commitment to investing over USD 30 billion in renewable energy projects, positioning Abu Dhabi as a leader in green hydrogen.
In October 2023, Kia Motors Corp. announced the launch of three new small- to medium-sized electric models, solidifying its commitment to leading and accelerating the 'EV revolution' on Kia EV Day in Korea. The unveiling included the introduction of the EV5, a compact electric SUV tailored for millennial families.
1 STRATEGIC INSIGHTS ON NEW REVENUE POCKETS
1.1 Strategic Opportunity & Attractiveness Analysis
1.1.1 Hot Revenue Pockets
1.1.2 Market Attractiveness Score
1.1.3 Revenue Impacting Opportunity
1.1.4 High Growing Region/Country
1.1.5 Competitor Analysis
1.1.6 Consumer Analysis
1.2 Global Market Estimates' View
1.3 Strategic Insights across Business Functions
1.3.1 For Chief Executive Officers
1.3.2 For Chief Marketing Officers
1.3.3 For Chief Strategy Officers
1.4 Evaluate the Potential of your Existing Business Lines vs. New Lines to Enter Into
2 TECHNOLOGICAL TRENDS
2.1 Technological Adoption Rate
2.2 Current Trend Impact Analysis
2.3 Future Trend Impact Analysis
3 GLOBAL GREEN ENERGY MOBILITY MARKET OUTLOOK
3.1 Market Pyramid Analysis
3.1.1 Introduction
3.1.2 Adjacent Market Opportunities
3.1.3 Ancillary Market Opportunities
3.2 Demand Side Analysis
3.2.1 Market Drivers: Impact Analysis
3.2.2 Market Restraints: Impact Analysis
3.2.3 Market Opportunities: Impact Analysis
3.2.4 Market Challenges: Impact Analysis
3.3 Supply Side Analysis
3.3.1 Porter’s Five Forces Analysis
3.3.1.1 Threat of New Entrants
3.3.1.2 Threat of New Substitutes
3.3.1.3 Bargaining Power of Suppliers
3.3.1.4 Bargaining Power of Buyers
3.3.1.5 Intensity of Competitive Rivalry
3.3.2 SWOT Analysis; By Factor (Political & Legal, Economic, and Technological)
3.3.2.1 Political Landscape
3.3.2.2 Economic Landscape
3.3.2.3 Social Landscape
3.3.2.4 Technology Landscape
3.3.3 Value Chain Analysis
3.3.4 Trend Analysis
3.3.5 Gap Analysis
3.3.6 Cost Analysis
4 GLOBAL GREEN ENERGY MOBILITY MARKET, BY TYPE
4.1 Introduction
4.2 Green Energy Mobility Market: Type Scope Key Takeaways
4.3 Revenue Growth Analysis, 2023 & 2029
4.4 Electric Mobility
4.4.1 Electric Mobility Market Estimates and Forecast, 2021-2029 (USD Million)
4.5 Battery Electric Vehicle
4.5.1 Battery Electric Vehicle Market Estimates and Forecast, 2021-2029 (USD Million)
4.6 Hybrid Electric Vehicle
4.6.1 Hybrid Electric Vehicle Market Estimates and Forecast, 2021-2029 (USD Million)
4.7 Fuel Cell Electric Vehicle
4.7.1 Fuel Cell Electric Vehicle Market Estimates and Forecast, 2021-2029 (USD Million)
4.8 Plug-in Hybrid Electric Vehicle
4.8.1 Plug-in Hybrid Electric Vehicle Market Estimates and Forecast, 2021-2029 (USD Million)
4.9 Gas Mobility
4.9.1 Gas Mobility Market Estimates and Forecast, 2021-2029 (USD Million)
4.10 Others
4.10.1 Others Market Estimates and Forecast, 2021-2029 (USD Million)
5 GLOBAL GREEN ENERGY MOBILITY MARKET, BY VEHICLE TYPE
5.1 Introduction
5.2 Green Energy Mobility Market: Vehicle Type Scope Key Takeaways
5.3 Revenue Growth Analysis, 2023 & 2029
5.4 Commercial Vehicles
5.4.1 Commercial Vehicles Market Estimates and Forecast, 2021-2029 (USD Million)
5.5 Medium & Heavy Commercial Vehicles
5.5.1 Medium & Heavy Commercial Vehicles Market Estimates and Forecast, 2021-2029 (USD Million)
5.6 Passengers Vehicles
5.6.1 Passengers Vehicles Market Estimates and Forecast, 2021-2029 (USD Million)
5.7 Light Commercial Vehicles
5.7.1 Light Commercial Vehicles Market Estimates and Forecast, 2021-2029 (USD Million)
5.8 Two & Three Wheelers
5.8.1 Two & Three Wheelers Market Estimates and Forecast, 2021-2029 (USD Million)
5.9 E-Scooters
5.9.1 E-Scooters Market Estimates and Forecast, 2021-2029 (USD Million)
5.10 E-Bikes
5.10.1 E-Bikes Market Estimates and Forecast, 2021-2029 (USD Million)
5.11 Others
5.11.1 Others Market Estimates and Forecast, 2021-2029 (USD Million)
6 GLOBAL GREEN ENERGY MOBILITY MARKET, BY APPLICATION
6.1 Introduction
6.2 Green Energy Mobility Market: Application Scope Key Takeaways
6.3 Revenue Growth Analysis, 2023 & 2029
6.4 Urban Logistics
6.4.1 Urban Logistics Market Estimates and Forecast, 2021-2029 (USD Million)
6.5 Mass Transit Infrastructure
6.5.1 Mass Transit Infrastructure Market Estimates and Forecast, 2021-2029 (USD Million)
6.6 Others
6.6.1 Others Market Estimates and Forecast, 2021-2029 (USD Million)
7 GLOBAL GREEN ENERGY MOBILITY MARKET, BY REGION
7.1 Introduction
7.2 North America Green Energy Mobility Market Estimates and Forecast, 2021-2029 (USD Million)
7.2.1 By Type
7.2.2 By Vehicle Type
7.2.3 By Application
7.2.4 By Country
7.2.4.1 U.S. Green Energy Mobility Market Estimates and Forecast, 2021-2029 (USD Million)
7.2.4.1.1 By Type
7.2.4.1.2 By Vehicle Type
7.2.4.1.3 By Application
7.2.4.2 Canada Green Energy Mobility Market Estimates and Forecast, 2021-2029 (USD Million)
7.2.4.2.1 By Type
7.2.4.2.2 By Vehicle Type
7.2.4.2.3 By Application
7.2.4.3 Mexico Green Energy Mobility Market Estimates and Forecast, 2021-2029 (USD Million)
7.2.4.3.1 By Type
7.2.4.3.2 By Vehicle Type
7.2.4.3.3 By Application
7.3 Europe Green Energy Mobility Market Estimates and Forecast, 2021-2029 (USD Million)
7.3.1 By Type
7.3.2 By Vehicle Type
7.3.3 By Application
7.3.4 By Country
7.3.4.1 Germany Green Energy Mobility Market Estimates and Forecast, 2021-2029 (USD Million)
7.3.4.1.1 By Type
7.3.4.1.2 By Vehicle Type
7.3.4.1.3 By Application
7.3.4.2 U.K. Green Energy Mobility Market Estimates and Forecast, 2021-2029 (USD Million)
7.3.4.2.1 By Type
7.3.4.2.2 By Vehicle Type
7.3.4.2.3 By Application
7.3.4.3 France Green Energy Mobility Market Estimates and Forecast, 2021-2029 (USD Million)
7.3.4.3.1 By Type
7.3.4.3.2 By Vehicle Type
7.3.4.3.3 By Application
7.3.4.4 Italy Green Energy Mobility Market Estimates and Forecast, 2021-2029 (USD Million)
7.3.4.4.1 By Type
7.3.4.4.2 By Vehicle Type
7.2.4.4.3 By Application
7.3.4.5 Spain Green Energy Mobility Market Estimates and Forecast, 2021-2029 (USD Million)
7.3.4.5.1 By Type
7.3.4.5.2 By Vehicle Type
7.2.4.5.3 By Application
7.3.4.6 Netherlands Green Energy Mobility Market Estimates and Forecast, 2021-2029 (USD Million)
7.3.4.6.1 By Type
7.3.4.6.2 By Vehicle Type
7.2.4.6.3 By Application
7.3.4.7 Rest of Europe Green Energy Mobility Market Estimates and Forecast, 2021-2029 (USD Million)
7.3.4.7.1 By Type
7.3.4.7.2 By Vehicle Type
7.2.4.7.3 By Application
7.4 Asia Pacific Green Energy Mobility Market Estimates and Forecast, 2021-2029 (USD Million)
7.4.1 By Type
7.4.2 By Vehicle Type
7.4.3 By Application
7.4.4 By Country
7.4.4.1 China Green Energy Mobility Market Estimates and Forecast, 2021-2029 (USD Million)
7.4.4.1.1 By Type
7.4.4.1.2 By Vehicle Type
7.4.4.1.3 By Application
7.4.4.2 Japan Green Energy Mobility Market Estimates and Forecast, 2021-2029 (USD Million)
7.4.4.2.1 By Type
7.4.4.2.2 By Vehicle Type
7.4.4.2.3 By Application
7.4.4.3 India Green Energy Mobility Market Estimates and Forecast, 2021-2029 (USD Million)
7.4.4.3.1 By Type
7.4.4.3.2 By Vehicle Type
7.4.4.3.3 By Application
7.4.4.4 South Korea Green Energy Mobility Market Estimates and Forecast, 2021-2029 (USD Million)
7.4.4.4.1 By Type
7.4.4.4.2 By Vehicle Type
7.4.4.4.3 By Application
7.4.4.5 Singapore Green Energy Mobility Market Estimates and Forecast, 2021-2029 (USD Million)
7.4.4.5.1 By Type
7.4.4.5.2 By Vehicle Type
7.4.4.5.3 By Application
7.4.4.6 Malaysia Green Energy Mobility Market Estimates and Forecast, 2021-2029 (USD Million)
7.4.4.6.1 By Type
7.4.4.6.2 By Vehicle Type
7.4.4.6.3 By Application
7.4.4.7 Thailand Green Energy Mobility Market Estimates and Forecast, 2021-2029 (USD Million)
7.4.4.7.1 By Type
7.4.4.7.2 By Vehicle Type
7.4.4.7.3 By Application
7.4.4.8 Indonesia Green Energy Mobility Market Estimates and Forecast, 2021-2029 (USD Million)
7.4.4.8.1 By Type
7.4.4.8.2 By Vehicle Type
7.4.4.8.3 By Application
7.4.4.9 Vietnam Green Energy Mobility Market Estimates and Forecast, 2021-2029 (USD Million)
7.4.4.9.1 By Type
7.4.4.9.2 By Vehicle Type
7.4.4.9.3 By Application
7.4.4.10 Taiwan Green Energy Mobility Market Estimates and Forecast, 2021-2029 (USD Million)
7.4.4.10.1 By Type
7.4.4.10.2 By Vehicle Type
7.4.4.10.3 By Application
7.4.4.11 Rest of Asia Pacific Green Energy Mobility Market Estimates and Forecast, 2021-2029 (USD Million)
7.4.4.11.1 By Type
7.4.4.11.2 By Vehicle Type
7.4.4.11.3 By Application
7.5 Middle East and Africa Green Energy Mobility Market Estimates and Forecast, 2021-2029 (USD Million)
7.5.1 By Type
7.5.2 By Vehicle Type
7.5.3 By Application
7.5.4 By Country
7.5.4.1 Saudi Arabia Green Energy Mobility Market Estimates and Forecast, 2021-2029 (USD Million)
7.5.4.1.1 By Type
7.5.4.1.2 By Vehicle Type
7.5.4.1.3 By Application
7.5.4.2 U.A.E. Green Energy Mobility Market Estimates and Forecast, 2021-2029 (USD Million)
7.5.4.2.1 By Type
7.5.4.2.2 By Vehicle Type
7.5.4.2.3 By Application
7.5.4.3 Israel Green Energy Mobility Market Estimates and Forecast, 2021-2029 (USD Million)
7.5.4.3.1 By Type
7.5.4.3.2 By Vehicle Type
7.5.4.3.3 By Application
7.5.4.4 South Africa Green Energy Mobility Market Estimates and Forecast, 2021-2029 (USD Million)
7.5.4.4.1 By Type
7.5.4.4.2 By Vehicle Type
7.5.4.4.3 By Application
7.5.4.5 Rest of Middle East and Africa Green Energy Mobility Market Estimates and Forecast, 2021-2029 (USD Million)
7.5.4.5.1 By Type
7.5.4.5.2 By Vehicle Type
7.5.4.5.2 By Application
7.6 Central and South America Green Energy Mobility Market Estimates and Forecast, 2021-2029 (USD Million)
7.6.1 By Type
7.6.2 By Vehicle Type
7.6.3 By Application
7.6.4 By Country
7.6.4.1 Brazil Green Energy Mobility Market Estimates and Forecast, 2021-2029 (USD Million)
7.6.4.1.1 By Type
7.6.4.1.2 By Vehicle Type
7.6.4.1.3 By Application
7.6.4.2 Argentina Green Energy Mobility Estimates and Forecast, 2021-2029 (USD Million)
7.6.4.2.1 By Type
7.6.4.2.2 By Vehicle Type
7.6.4.2.3 By Application
7.6.4.3 Chile Green Energy Mobility Market Estimates and Forecast, 2021-2029 (USD Million)
7.6.4.3.1 By Type
7.6.4.3.2 By Vehicle Type
7.6.4.3.3 By Application
7.6.4.4 Rest of Central and South America Green Energy Mobility Market Estimates and Forecast, 2021-2029 (USD Million)
7.6.4.4.1 By Type
7.6.4.4.2 By Vehicle Type
7.6.4.4.3 By Application
8 COMPETITIVE LANDCAPE
8.1 Company Market Share Analysis
8.2 Four Quadrant Positioning Matrix
8.2.1 Market Leaders
8.2.2 Market Visionaries
8.2.3 Market Challengers
8.2.4 Niche Market Players
8.3 Vendor Landscape
8.3.1 North America
8.3.2 Europe
8.3.3 Asia Pacific
8.3.4 Rest of the World
8.4 Company Profiles
8.4.1 BMW
8.4.1.1 Business Description & Financial Analysis
8.4.1.2 SWOT Analysis
8.4.1.3 Products & Services Offered
8.4.1.4 Strategic Alliances between Business Partners
8.4.2 BYD
8.4.2.1 Business Description & Financial Analysis
8.4.2.2 SWOT Analysis
8.4.2.3 Products & Services Offered
8.4.2.4 Strategic Alliances between Business Partners
8.4.3 Tesla
8.4.3.1 Business Description & Financial Analysis
8.4.3.2 SWOT Analysis
8.4.3.3 Products & Services Offered
8.4.3.4 Strategic Alliances between Business Partners
8.4.4 Daimler AG
8.4.4.1 Business Description & Financial Analysis
8.4.4.2 SWOT Analysis
8.4.4.3 Products & Services Offered
8.4.4.4 Strategic Alliances between Business Partners
8.4.5 Nissan
8.4.5.1 Business Description & Financial Analysis
8.4.5.2 SWOT Analysis
8.4.5.3 Products & Services Offered
8.4.5.4 Strategic Alliances between Business Partners
8.4.6 Engie
8.4.6.1 Business Description & Financial Analysis
8.4.6.2 SWOT Analysis
8.4.6.3 Products & Services Offered
8.4.6.4 Strategic Alliances between Business Partners
8.4.7 Ford Motors Company
8.4.7.1 Business Description & Financial Analysis
8.4.7.2 SWOT Analysis
8.4.7.3 Products & Services Offered
8.4.8.4 Strategic Alliances between Business Partners
8.4.8 Kia Motors Corp.
8.4.8.1 Business Description & Financial Analysis
8.4.8.2 SWOT Analysis
8.4.8.3 Products & Services Offered
8.4.8.4 Strategic Alliances between Business Partners
8.4.9 General Motors
8.4.9.1 Business Description & Financial Analysis
8.4.9.2 SWOT Analysis
8.4.9.3 Products & Services Offered
8.4.9.4 Strategic Alliances between Business Partners
8.4.10 Volkswagen
8.4.10.1 Business Description & Financial Analysis
8.4.10.2 SWOT Analysis
8.4.10.3 Products & Services Offered
8.4.10.4 Strategic Alliances between Business Partners
8.4.11 Hyundai Motor Company
8.4.11.1 Business Description & Financial Analysis
8.4.11.2 SWOT Analysis
8.4.11.3 Products & Services Offered
8.4.11.4 Strategic Alliances between Business Partners
8.4.12 Maruti
8.4.12.1 Business Description & Financial Analysis
8.4.12.2 SWOT Analysis
8.4.12.3 Products & Services Offered
8.4.12.4 Strategic Alliances between Business Partners
8.4.13 TATA Motors Limited
8.4.13.1 Business Description & Financial Analysis
8.4.13.2 SWOT Analysis
8.4.13.3 Products & Services Offered
8.4.13.4 Strategic Alliances between Business Partners
8.4.14 Toyota
8.4.14.1 Business Description & Financial Analysis
8.4.14.2 SWOT Analysis
8.4.14.3 Products & Services Offered
8.4.14.4 Strategic Alliances between Business Partners
8.4.15 Hero Electric Vehicles Pvt. Ltd.
8.4.15.1 Business Description & Financial Analysis
8.4.15.2 SWOT Analysis
8.4.15.3 Products & Services Offered
8.4.15.4 Strategic Alliances between Business Partners
8.4.16 Volvo Car Corp.
8.4.16.1 Business Description & Financial Analysis
8.4.16.2 SWOT Analysis
8.4.16.3 Products & Services Offered
8.4.16.4 Strategic Alliances between Business Partners
8.4.17 Greaves Electric Mobility Private Limited (‘GEMPL’)
8.4.17.1 Business Description & Financial Analysis
8.4.17.2 SWOT Analysis
8.4.17.3 Products & Services Offered
8.4.17.4 Strategic Alliances between Business Partners
8.4.18 Ather Energy Private Limited
8.4.18.1 Business Description & Financial Analysis
8.4.18.2 SWOT Analysis
8.4.18.3 Products & Services Offered
8.4.18.4 Strategic Alliances between Business Partners
8.4.19 ATUL Auto Limited
8.4.19.1 Business Description & Financial Analysis
8.4.19.2 SWOT Analysis
8.4.19.3 Products & Services Offered
8.4.19.4 Strategic Alliances between Business Partners
8.4.20 Bajaj Auto Limited
8.4.20.1 Business Description & Financial Analysis
8.4.20.2 SWOT Analysis
8.4.20.3 Products & Services Offered
8.4.20.4 Strategic Alliances between Business Partners
8.4.21 Other Companies
8.4.21.1 Business Description & Financial Analysis
8.4.21.2 SWOT Analysis
8.4.21.3 Products & Services Offered
8.4.21.4 Strategic Alliances between Business Partners
9 RESEARCH METHODOLOGY
9.1 Market Introduction
9.1.1 Market Definition
9.1.2 Market Scope & Segmentation
9.2 Information Procurement
9.2.1 Secondary Research
9.2.1.1 Purchased Databases
9.2.1.2 GMEs Internal Data Repository
9.2.1.3 Secondary Resources & Third Party Perspectives
9.2.1.4 Company Information Sources
9.2.2 Primary Research
9.2.2.1 Various Types of Respondents for Primary Interviews
9.2.2.2 Number of Interviews Conducted throughout the Research Process
9.2.2.3 Primary Stakeholders
9.2.2.4 Discussion Guide for Primary Participants
9.2.3 Expert Panels
9.2.3.1 Expert Panels Across 30+ Industry
9.2.4 Paid Local Experts
9.2.4.1 Paid Local Experts Across 30+ Industry Across each Region
9.3 Market Estimation
9.3.1 Top-Down Approach
9.3.1.1 Macro-Economic Indicators Considered
9.3.1.2 Micro-Economic Indicators Considered
9.3.2 Bottom Up Approach
9.3.2.1 Company Share Analysis Approach
9.3.2.2 Estimation of Potential Product Sales
9.4 Data Triangulation
9.4.1 Data Collection
9.4.2 Time Series, Cross Sectional & Panel Data Analysis
9.4.3 Cluster Analysis
9.5 Analysis and Output
9.5.1 Inhouse AI Based Real Time Analytics Tool
9.5.2 Output From Desk & Primary Research
9.6 Research Assumptions & Limitations
9.7.1 Research Assumptions
9.7.2 Research Limitations
LIST OF TABLES
1 Global Green Energy Mobility Market, By Type, 2021-2029 (USD Mllion)
2 Electric Mobility Market, By Region, 2021-2029 (USD Mllion)
3 Battery Electric Vehicle Market, By Region, 2021-2029 (USD Mllion)
4 Hybrid Electric Vehicle Market, By Region, 2021-2029 (USD Mllion)
5 Fuel Cell Electric Vehicle Market, By Region, 2021-2029 (USD Mllion)
6 Plug-in Hybrid Electric Vehicle Market, By Region, 2021-2029 (USD Mllion)
7 Gas Mobility Market, By Region, 2021-2029 (USD Mllion)
8 Others Market, By Region, 2021-2029 (USD Mllion)
9 Global Green Energy Mobility Market, By Vehicle Type, 2021-2029 (USD Mllion)
10 Commercial Vehicles Market, By Region, 2021-2029 (USD Mllion)
11 Medium & Heavy Commercial Vehicles Market, By Region, 2021-2029 (USD Mllion)
12 Light Commercial Vehicles Market, By Region, 2021-2029 (USD Mllion)
13 Passengers Vehicles Market, By Region, 2021-2029 (USD Mllion)
14 Two & Three Wheelers Market, By Region, 2021-2029 (USD Mllion)
15 E-Scooters Market, By Region, 2021-2029 (USD Mllion)
16 E-Bikes Market, By Region, 2021-2029 (USD Mllion)
17 Others Market, By Region, 2021-2029 (USD Mllion)
18 Global Green Energy Mobility Market, By Application, 2021-2029 (USD Mllion)
19 Urban Logistics Market, By Region, 2021-2029 (USD Mllion)
20 Mass Transit Infrastructure Market, By Region, 2021-2029 (USD Mllion)
21 Others Market, By Region, 2021-2029 (USD Mllion)
22 Regional Analysis, 2021-2029 (USD Mllion)
23 North America Green Energy Mobility Market, By Type, 2021-2029 (USD Million)
24 North America Green Energy Mobility Market, By Vehicle Type, 2021-2029 (USD Million)
25 North America Green Energy Mobility Market, By Application, 2021-2029 (USD Million)
26 North America Green Energy Mobility Market, By Country, 2021-2029 (USD Million)
27 U.S Green Energy Mobility Market, By Type, 2021-2029 (USD Million)
28 U.S Green Energy Mobility Market, By Vehicle Type, 2021-2029 (USD Million)
29 U.S Green Energy Mobility Market, By Application, 2021-2029 (USD Million)
30 Canada Green Energy Mobility Market, By Type, 2021-2029 (USD Million)
31 Canada Green Energy Mobility Market, By Vehicle Type, 2021-2029 (USD Million)
32 Canada Green Energy Mobility Market, By Application, 2021-2029 (USD Million)
33 Mexico Green Energy Mobility Market, By Type, 2021-2029 (USD Million)
34 Mexico Green Energy Mobility Market, By Vehicle Type, 2021-2029 (USD Million)
35 Mexico Green Energy Mobility Market, By Application, 2021-2029 (USD Million)
36 Europe Green Energy Mobility Market, By Type, 2021-2029 (USD Million)
37 Europe Green Energy Mobility Market, By Vehicle Type, 2021-2029 (USD Million)
38 Europe Green Energy Mobility Market, By Application, 2021-2029 (USD Million)
39 Europe Green Energy Mobility Market, By COUNTRY, 2021-2029 (USD Million)
40 Germany Green Energy Mobility Market, By Type, 2021-2029 (USD Million)
41 Germany Green Energy Mobility Market, By Vehicle Type, 2021-2029 (USD Million)
42 Germany Green Energy Mobility Market, By Application, 2021-2029 (USD Million)
43 U.K Green Energy Mobility Market, By Type, 2021-2029 (USD Million)
44 U.K Green Energy Mobility Market, By Vehicle Type, 2021-2029 (USD Million)
45 U.K Green Energy Mobility Market, By Application, 2021-2029 (USD Million)
46 France Green Energy Mobility Market, By Type, 2021-2029 (USD Million)
47 France Green Energy Mobility Market, By Vehicle Type, 2021-2029 (USD Million)
48 France Green Energy Mobility Market, By Application, 2021-2029 (USD Million)
49 Italy Green Energy Mobility Market, By Type, 2021-2029 (USD Million)
50 Italy Green Energy Mobility Market, By End Use , 2021-2029 (USD Million)
51 Italy Green Energy Mobility Market, By Application, 2021-2029 (USD Million)
52 Spain Green Energy Mobility Market, By Type, 2021-2029 (USD Million)
53 Spain Green Energy Mobility Market, By Vehicle Type, 2021-2029 (USD Million)
54 Spain Green Energy Mobility Market, By Application, 2021-2029 (USD Million)
55 Rest Of Europe Green Energy Mobility Market, By Type, 2021-2029 (USD Million)
56 Rest Of Europe Green Energy Mobility Market, By Vehicle Type, 2021-2029 (USD Million)
57 Rest of Europe Green Energy Mobility Market, By Application, 2021-2029 (USD Million)
58 Asia Pacific Green Energy Mobility Market, By Type, 2021-2029 (USD Million)
59 Asia Pacific Green Energy Mobility Market, By Vehicle Type, 2021-2029 (USD Million)
60 Asia Pacific Green Energy Mobility Market, By Application, 2021-2029 (USD Million)
61 Asia Pacific Green Energy Mobility Market, By Country, 2021-2029 (USD Million)
62 China Green Energy Mobility Market, By Type, 2021-2029 (USD Million)
63 China Green Energy Mobility Market, By Vehicle Type, 2021-2029 (USD Million)
64 China Green Energy Mobility Market, By Application, 2021-2029 (USD Million)
65 India Green Energy Mobility Market, By Type, 2021-2029 (USD Million)
66 India Green Energy Mobility Market, By Vehicle Type, 2021-2029 (USD Million)
67 India Green Energy Mobility Market, By Application, 2021-2029 (USD Million)
68 Japan Green Energy Mobility Market, By Type, 2021-2029 (USD Million)
69 Japan Green Energy Mobility Market, By Vehicle Type, 2021-2029 (USD Million)
70 Japan Green Energy Mobility Market, By Application, 2021-2029 (USD Million)
71 South Korea Green Energy Mobility Market, By Type, 2021-2029 (USD Million)
72 South Korea Green Energy Mobility Market, By Vehicle Type, 2021-2029 (USD Million)
73 South Korea Green Energy Mobility Market, By Application, 2021-2029 (USD Million)
74 Singapore Green Energy Mobility Market, By Type, 2021-2029 (USD Million)
75 Singapore Green Energy Mobility Market, By Vehicle Type, 2021-2029 (USD Million)
76 Singapore Green Energy Mobility Market, By Application, 2021-2029 (USD Million)
77 Malaysia Green Energy Mobility Market, By Type, 2021-2029 (USD Million)
78 Malaysia Green Energy Mobility Market, By Vehicle Type, 2021-2029 (USD Million)
79 Malaysia Green Energy Mobility Market, By Application, 2021-2029 (USD Million)
80 Thailand Green Energy Mobility Market, By Type, 2021-2029 (USD Million)
81 Thailand Green Energy Mobility Market, By Vehicle Type, 2021-2029 (USD Million)
82 Thailand Green Energy Mobility Market, By Application, 2021-2029 (USD Million)
83 Indonesia Green Energy Mobility Market, By Type, 2021-2029 (USD Million)
84 Indonesia Green Energy Mobility Market, By Vehicle Type, 2021-2029 (USD Million)
85 Indonesia Green Energy Mobility Market, By Application, 2021-2029 (USD Million)
86 Vietnam Green Energy Mobility Market, By Type, 2021-2029 (USD Million)
87 Vietnam Green Energy Mobility Market, By Vehicle Type, 2021-2029 (USD Million)
88 Vietnam Green Energy Mobility Market, By Application, 2021-2029 (USD Million)
89 Taiwan Green Energy Mobility Market, By Type, 2021-2029 (USD Million)
90 Taiwan Green Energy Mobility Market, By Vehicle Type, 2021-2029 (USD Million)
91 Taiwan Green Energy Mobility Market, By Application, 2021-2029 (USD Million)
92 Rest of Asia Pacific Green Energy Mobility Market, By Type, 2021-2029 (USD Million)
93 Rest of Asia Pacific Green Energy Mobility Market, By Vehicle Type, 2021-2029 (USD Million)
94 Rest of Asia Pacific Green Energy Mobility Market, By Application, 2021-2029 (USD Million)
95 Middle East and Africa Green Energy Mobility Market, By Type, 2021-2029 (USD Million)
96 Middle East and Africa Green Energy Mobility Market, By Vehicle Type, 2021-2029 (USD Million)
97 Middle East and Africa Green Energy Mobility Market, By Application, 2021-2029 (USD Million)
98 Middle East and Africa Green Energy Mobility Market, By Country, 2021-2029 (USD Million)
99 Saudi Arabia Green Energy Mobility Market, By Type, 2021-2029 (USD Million)
100 Saudi Arabia Green Energy Mobility Market, By Vehicle Type, 2021-2029 (USD Million)
101 Saudi Arabia Green Energy Mobility Market, By Application, 2021-2029 (USD Million)
102 UAE Green Energy Mobility Market, By Type, 2021-2029 (USD Million)
103 UAE Green Energy Mobility Market, By Vehicle Type, 2021-2029 (USD Million)
104 UAE Green Energy Mobility Market, By Application, 2021-2029 (USD Million)
105 Israel Green Energy Mobility Market, By Type, 2021-2029 (USD Million)
106 Israel Green Energy Mobility Market, By Vehicle Type, 2021-2029 (USD Million)
107 Israel Green Energy Mobility Market, By Application, 2021-2029 (USD Million)
108 South Africa Green Energy Mobility Market, By Type, 2021-2029 (USD Million)
109 South Africa Green Energy Mobility Market, By Vehicle Type, 2021-2029 (USD Million)
110 South Africa Green Energy Mobility Market, By Application, 2021-2029 (USD Million)
111 Rest of Middle East and Africa Green Energy Mobility Market, By Type, 2021-2029 (USD Million)
112 Rest of Middle East and Africa Green Energy Mobility Market, By Vehicle Type, 2021-2029 (USD Million)
113 Rest of Middle East and Africa Green Energy Mobility Market, By Application, 2021-2029 (USD Million)
114 Central and South America Green Energy Mobility Market, By Type, 2021-2029 (USD Million)
115 Central and South America Green Energy Mobility Market, By Vehicle Type, 2021-2029 (USD Million)
116 Central and South America Green Energy Mobility Market, By Application, 2021-2029 (USD Million)
117 Central and South America Green Energy Mobility Market, By Country, 2021-2029 (USD Million)
118 Brazil Green Energy Mobility Market, By Type, 2021-2029 (USD Million)
119 Brazil Green Energy Mobility Market, By Vehicle Type, 2021-2029 (USD Million)
120 Brazil Green Energy Mobility Market, By Application, 2021-2029 (USD Million)
121 Argentina Green Energy Mobility Market, By Type, 2021-2029 (USD Million)
122 Argentina Green Energy Mobility Market, By Vehicle Type, 2021-2029 (USD Million)
123 Argentina Green Energy Mobility Market, By Application, 2021-2029 (USD Million)
124 Chile Green Energy Mobility Market, By Type, 2021-2029 (USD Million)
125 Chile Green Energy Mobility Market, By Vehicle Type, 2021-2029 (USD Million)
126 Chile Green Energy Mobility Market, By Application, 2021-2029 (USD Million)
127 Rest of Central and South America Green Energy Mobility Market, By Type, 2021-2029 (USD Million)
128 Rest of Central and South America Green Energy Mobility Market, By Vehicle Type, 2021-2029 (USD Million)
129 Rest of Central and South America Green Energy Mobility Market, By Application, 2021-2029 (USD Million)
130 BMW: Products & Services Offering
131 BYD: Products & Services Offering
132 Tesla: Products & Services Offering
133 Daimler AG: Products & Services Offering
134 Nissan: Products & Services Offering
135 ENGIE: Products & Services Offering
136 Ford Motors Company : Products & Services Offering
137 Kia Motors Corp.: Products & Services Offering
138 General Motors, Inc: Products & Services Offering
139 Volkswagen: Products & Services Offering
140 Hyundai Motor Company: Products & Services Offering
141 Maruti: Products & Services Offering
142 TATA Motors Limited: Products & Services Offering
143 Toyota: Products & Services Offering
144 Volvo Car Corp.: Products & Services Offering
145 Greaves Electric Mobility Private Limited (‘GEMPL’): Products & Services Offering
146 Ather Energy Private Limited: Products & Services Offering
147 ATUL Auto Limited: Products & Services Offering
148 Bajaj Auto Limited: Products & Services Offering
149 Hero Electric Vehicles Pvt. Ltd.: Products & Services Offering
150 Other Companies: Products & Services Offering
LIST OF FIGURES
1 Global Green Energy Mobility Market Overview
2 Global Green Energy Mobility Market Value From 2021-2029 (USD Mllion)
3 Global Green Energy Mobility Market Share, By Type (2023)
4 Global Green Energy Mobility Market Share, By Vehicle Type (2023)
5 Global Green Energy Mobility Market Share, By Application (2023
6 Global Green Energy Mobility Market, By Region (Asia Pacific Market)
7 Technological Trends In Global Green Energy Mobility Market
8 Four Quadrant Competitor Positioning Matrix
9 Impact Of Macro & Micro Indicators On The Market
10 Impact Of Key Drivers On The Global Green Energy Mobility Market
11 Impact Of Challenges On The Global Green Energy Mobility Market
12 Porter’s Five Forces Analysis
13 Global Green Energy Mobility Market: By Type Scope Key Takeaways
14 Global Green Energy Mobility Market, By Type Segment: Revenue Growth Analysis
15 Electric Mobility Market, By Region, 2021-2029 (USD Mllion)
16 Battery Electric Vehicle Market, By Region, 2021-2029 (USD Mllion)
17 Hybrid Electric Vehicle Market, By Region, 2021-2029 (USD Mllion)
18 Fuel Cell Electric Vehicle Market, By Region, 2021-2029 (USD Mllion)
19 Plug-in Hybrid Electric Vehicle Market, By Region, 2021-2029 (USD Mllion)
20 Gas Mobility, Market, By Region, 2021-2029 (USD Mllion)
21 Others Market, By Region, 2021-2029 (USD Mllion)
22 Global Green Energy Mobility Market: By Vehicle Type Scope Key Takeaways
23 Global Green Energy Mobility Market, By Vehicle Type Segment: Revenue Growth Analysis
24 Commercial Vehicles Market, By Region, 2021-2029 (USD Mllion)
25 Medium & Heavy Commercial Vehicles Market, By Region, 2021-2029 (USD Mllion)
26 Light Commercial Vehicles Market, By Region, 2021-2029 (USD Mllion)
27 Passengers VehiclesMarket, By Region, 2021-2029 (USD Mllion)
28 Two & Three Wheelers Market, By Region, 2021-2029 (USD Mllion)
29 E-Scooters Market, By Region, 2021-2029 (USD Mllion)
30 E-Bikes Market, By Region, 2021-2029 (USD Mllion)
31 Others Market, By Region, 2021-2029 (USD Mllion)
32 Global Green Energy Mobility Market: By Application Scope Key Takeaways
33 Global Green Energy Mobility Market, By Application Segment: Revenue Growth Analysis
34 Urban Logistics Market, By Region, 2021-2029 (USD Mllion)
35 Mass Transit Infrastructure Market, By Region, 2021-2029 (USD Mllion)
36 Regional Segment: Revenue Growth Analysis
37 Global Green Energy Mobility Market: Regional Analysis
38 North America Green Energy Mobility Market Overview
39 North America Green Energy Mobility Market, By Type
40 North America Green Energy Mobility Market, By Vehicle Type
41 North America Green Energy Mobility Market, By Application
42 North America Green Energy Mobility Market, By Country
43 U.S. Green Energy Mobility Market, By Type
44 U.S. Green Energy Mobility Market, By Vehicle Type
45 U.S. Green Energy Mobility Market, By Application
46 Canada Green Energy Mobility Market, By Type
47 Canada Green Energy Mobility Market, By Vehicle Type
48 Canada Green Energy Mobility Market, By Application
49 Mexico Green Energy Mobility Market, By Type
50 Mexico Green Energy Mobility Market, By Vehicle Type
51 Mexico Green Energy Mobility Market, By Application
52 Four Quadrant Positioning Matrix
53 Company Market Share Analysis
54 BMW: Company Snapshot
55 BMW: SWOT Analysis
56 BMW: Geographic Presence
57 BYD: Company Snapshot
58 BYD: SWOT Analysis
59 BYD: Geographic Presence
60 Tesla: Company Snapshot
61 Tesla: SWOT Analysis
62 Tesla: Geographic Presence
63 Daimler AG: Company Snapshot
64 Daimler AG: Swot Analysis
65 Daimler AG: Geographic Presence
66 Nissan: Company Snapshot
67 Nissan: SWOT Analysis
68 Nissan: Geographic Presence
69 Engie: Company Snapshot
70 Engie: SWOT Analysis
71 Engie: Geographic Presence
72 Ford Motors Company : Company Snapshot
73 Ford Motors Company : SWOT Analysis
74 Ford Motors Company : Geographic Presence
75 Kia Motors Corp.: Company Snapshot
76 Kia Motors Corp.: SWOT Analysis
77 Kia Motors Corp.: Geographic Presence
78 General Motors, Inc.: Company Snapshot
79 General Motors, Inc.: SWOT Analysis
80 General Motors, Inc.: Geographic Presence
81 Volkswagen: Company Snapshot
82 Volkswagen: SWOT Analysis
83 Volkswagen: Geographic Presence
84 Hyundai Motor Company: Company Snapshot
85 Hyundai Motor Company: SWOT Analysis
86 Hyundai Motor Company: Geographic Presence
87 Maruti: Company Snapshot
88 Maruti: SWOT Analysis
89 Maruti: Geographic Presence
90 TATA Motors Limited: Company Snapshot
91 TATA Motors Limited: SWOT Analysis
92 TATA Motors Limited: Geographic Presence
93 Toyota: Company Snapshot
94 Toyota: SWOT Analysis
95 Toyota: Geographic Presence
96 Volvo Car Corp.: Company Snapshot
97 Volvo Car Corp.: SWOT Analysis
98 Volvo Car Corp.: Geographic Presence
99 Greaves Electric Mobility Private Limited (‘GEMPL’): Company Snapshot
100 Greaves Electric Mobility Private Limited (‘GEMPL’): SWOT Analysis
101 Greaves Electric Mobility Private Limited (‘GEMPL’): Geographic Presence
102 Ather Energy Private Limited: Company Snapshot
103 Ather Energy Private Limited: SWOT Analysis
104 Ather Energy Private Limited: Geographic Presence
105 ATUL Auto Limited: Company Snapshot
106 ATUL Auto Limited: SWOT Analysis
107 ATUL Auto Limited: Geographic Presence
108 Bajaj Auto Limited: Company Snapshot
109 Bajaj Auto Limited: SWOT Analysis
110 Bajaj Auto Limited: Geographic Presence
111 Hero Electric Vehicles Pvt. Ltd.: Company Snapshot
112 Hero Electric Vehicles Pvt. Ltd.: SWOT Analysis
113 Hero Electric Vehicles Pvt. Ltd.: Geographic Presence
114 Other Companies: Company Snapshot
115 Other Companies: SWOT Analysis
116 Other Companies: Geographic Presence
The Global Green Energy Mobility Market has been studied from the year 2019 till 2029. However, the CAGR provided in the report is from the year 2024 to 2029. The research methodology involved three stages: Desk research, Primary research, and Analysis & Output from the entire research process.

The desk research involved a robust background study which meant referring to paid and unpaid databases to understand the market dynamics; mapping contracts from press releases; identifying the key players in the market, studying their product portfolio, competition level, annual reports/SEC filings & investor presentations; and learning the demand and supply-side analysis for the Green Energy Mobility Market.

The primary research activity included telephonic conversations with more than 50 tier 1 industry consultants, distributors, and end-use product manufacturers.

Finally, based on the above thorough research process, an in-depth analysis was carried out considering the following aspects: market attractiveness, current & future market trends, market share analysis, SWOT analysis of the company and customer analytics.

Frequently Asked Questions

This FREE sample includes market data points, ranging from trend analyses to market estimates & forecasts. See for yourself.
Or view our licence options:
Tailor made solutions just for you
80% of our clients seek made-to-order reports. How do you want us to tailor yours?
OUR CLIENTS


