This report was recently updated on August 28 2025 with the latest and most recent
market numbers
Global Grey Hydrogen Market Size, Trends & Analysis - Forecasts to 2029 By Source (Natural Gas, Coal, and Others), By Production Method (Steam Reformation, Gasification, and Others), By Application (Ammonia Production, Methanol Production, Refineries, Chemical Production, and Others), and By Region (North America, Asia Pacific, Central and South America, Europe, and Middle East and Africa), Competitive Landscape, Company Market Share Analysis, and End User Analysis
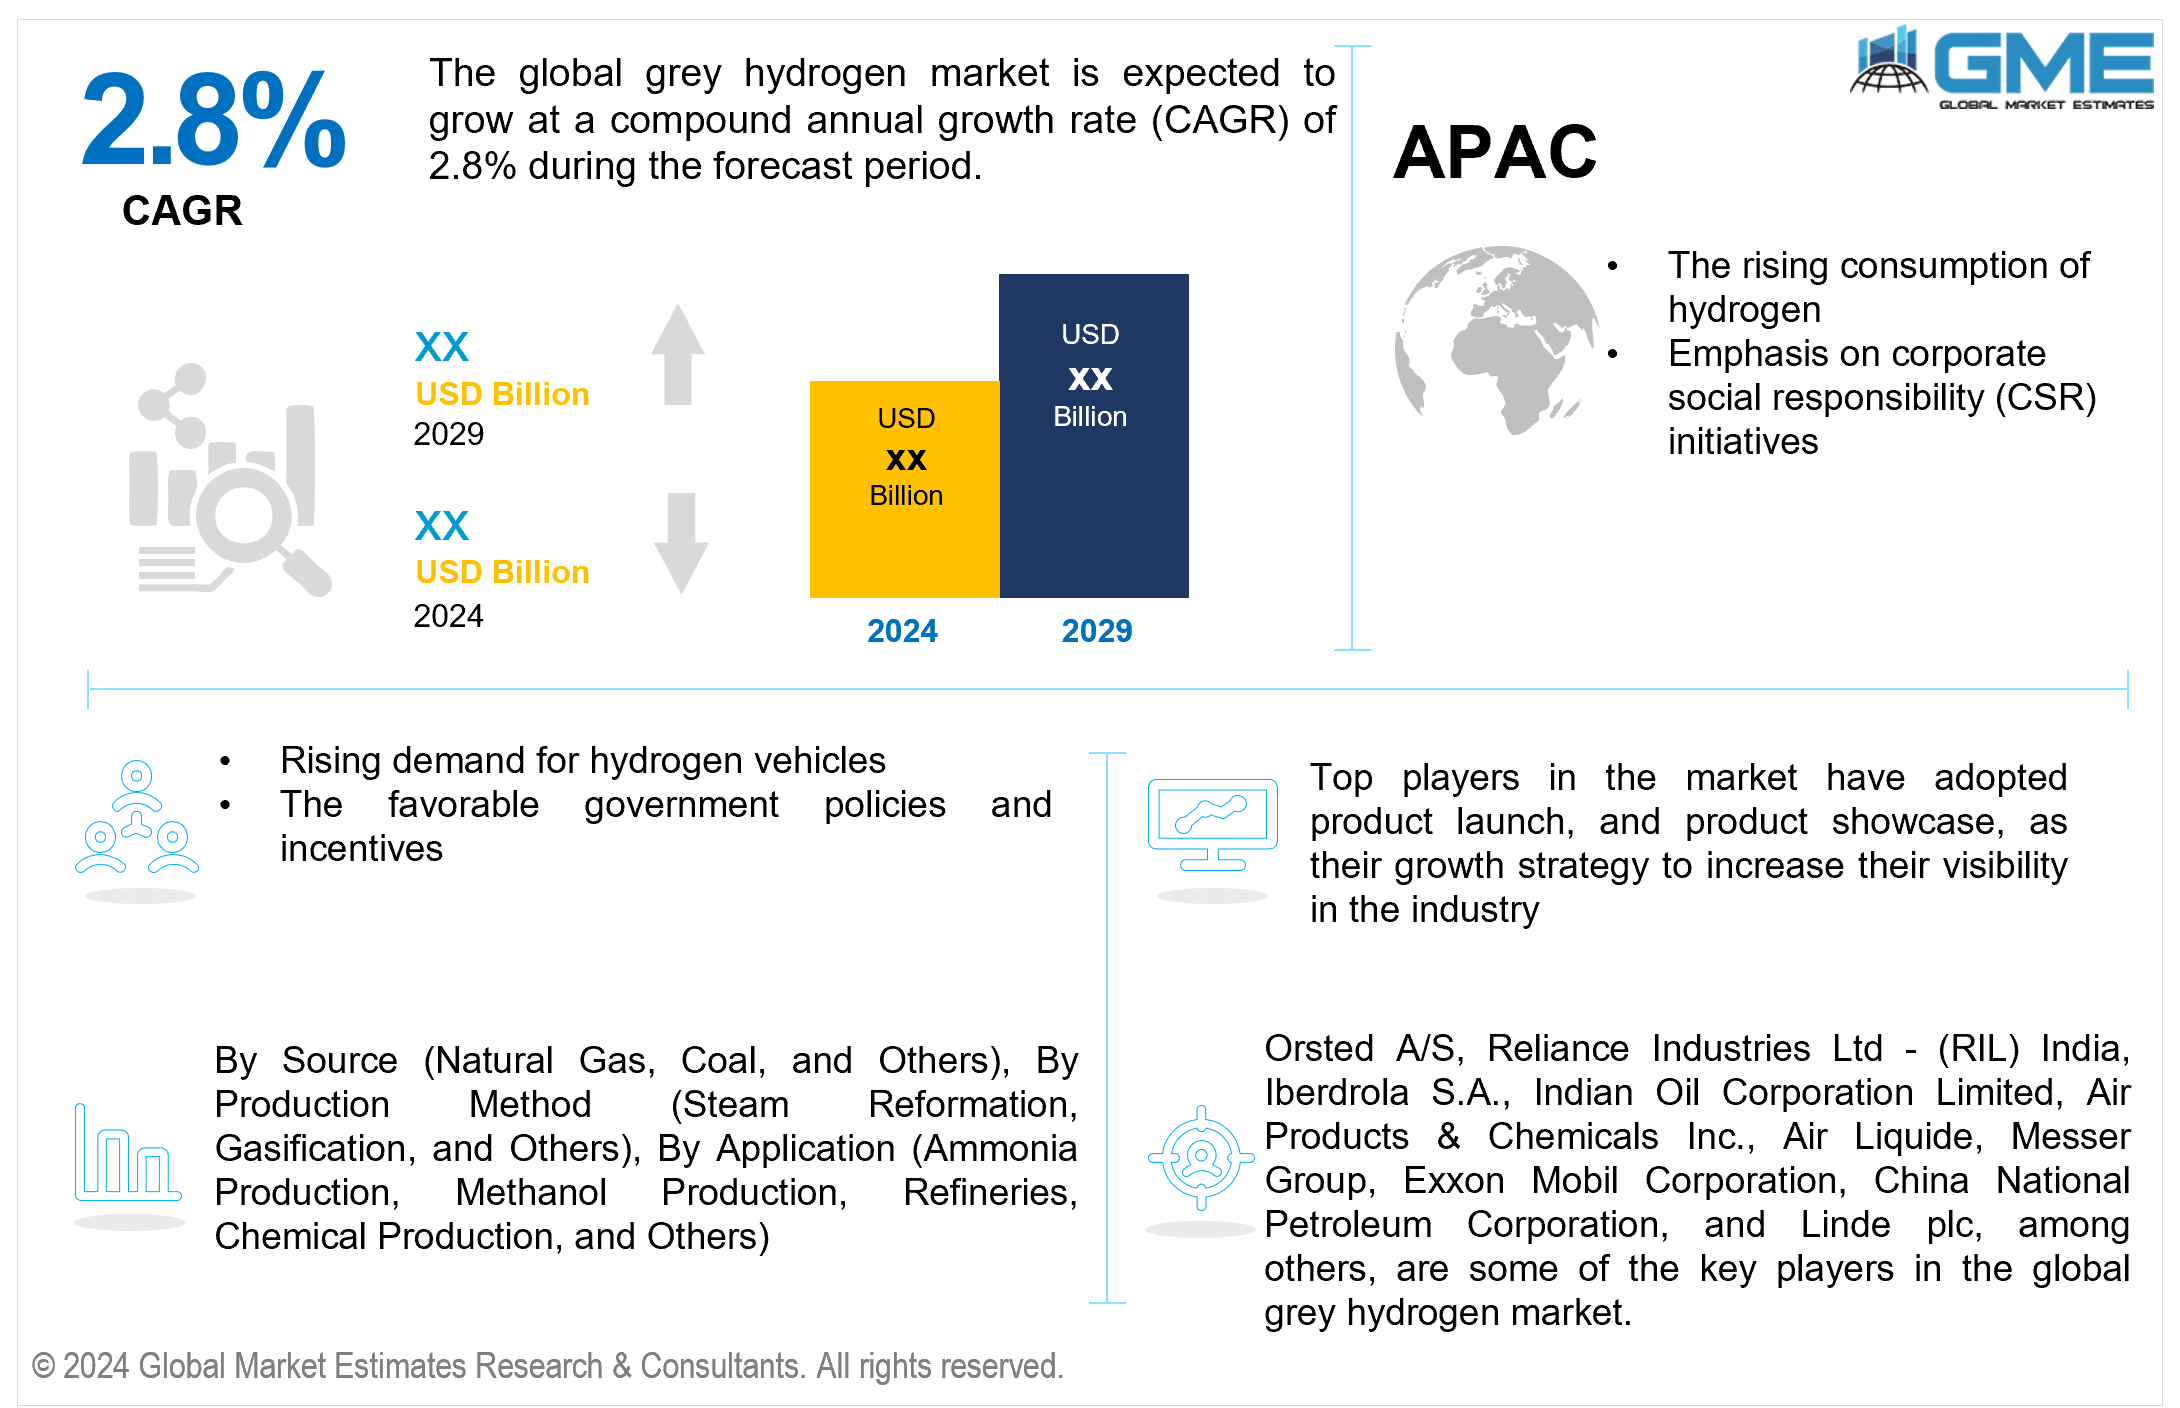
The global grey hydrogen market is estimated to exhibit a CAGR of 2.8% from 2024 to 2029.
The primary factors propelling the market growth are the rising consumption of hydrogen and the emphasis on corporate social responsibility (CSR) initiatives. The utilization of hydrogen as a cleaner substitute for traditional fuels and feedstocks is becoming more widespread in industries like steel production, petrochemicals, and refineries. In order to lower carbon emissions and adhere to strict environmental requirements, these sectors depend on grey hydrogen as a feedstock. Additionally, through hydrogen-based fuel cells or combustion, hydrogen has the potential to contribute to the production of clean power. Grey hydrogen is becoming increasingly popular in power generation applications as it can produce energy with less emissions from gas turbines and fuel cells than traditional fossil fuels. For instance, the International Energy Agency (IEA) reports that global hydrogen consumption reached 95 Mt in 2022, which increased by 3% from 2021.
The rising demand for hydrogen vehicles and favorable government policies and incentives are expected to support the market growth. Major investments are being made by automakers in the research and manufacturing of hydrogen-powered vehicles. The market for grey hydrogen, the preferred fuel for these vehicles, is growing due to these manufacturers' increased commitment to include hydrogen-powered vehicles in their fleets. Additionally, hydrogen refueling infrastructure must be developed to keep up with the growing popularity of hydrogen vehicles. As one of the most well-known and accessible hydrogen sources, grey hydrogen is essential to developing and operating hydrogen filling stations. For instance, InsideEVs reports that 2,968 new hydrogen vehicles were sold in the U.S. in 2023, a 10% increase from 2022.
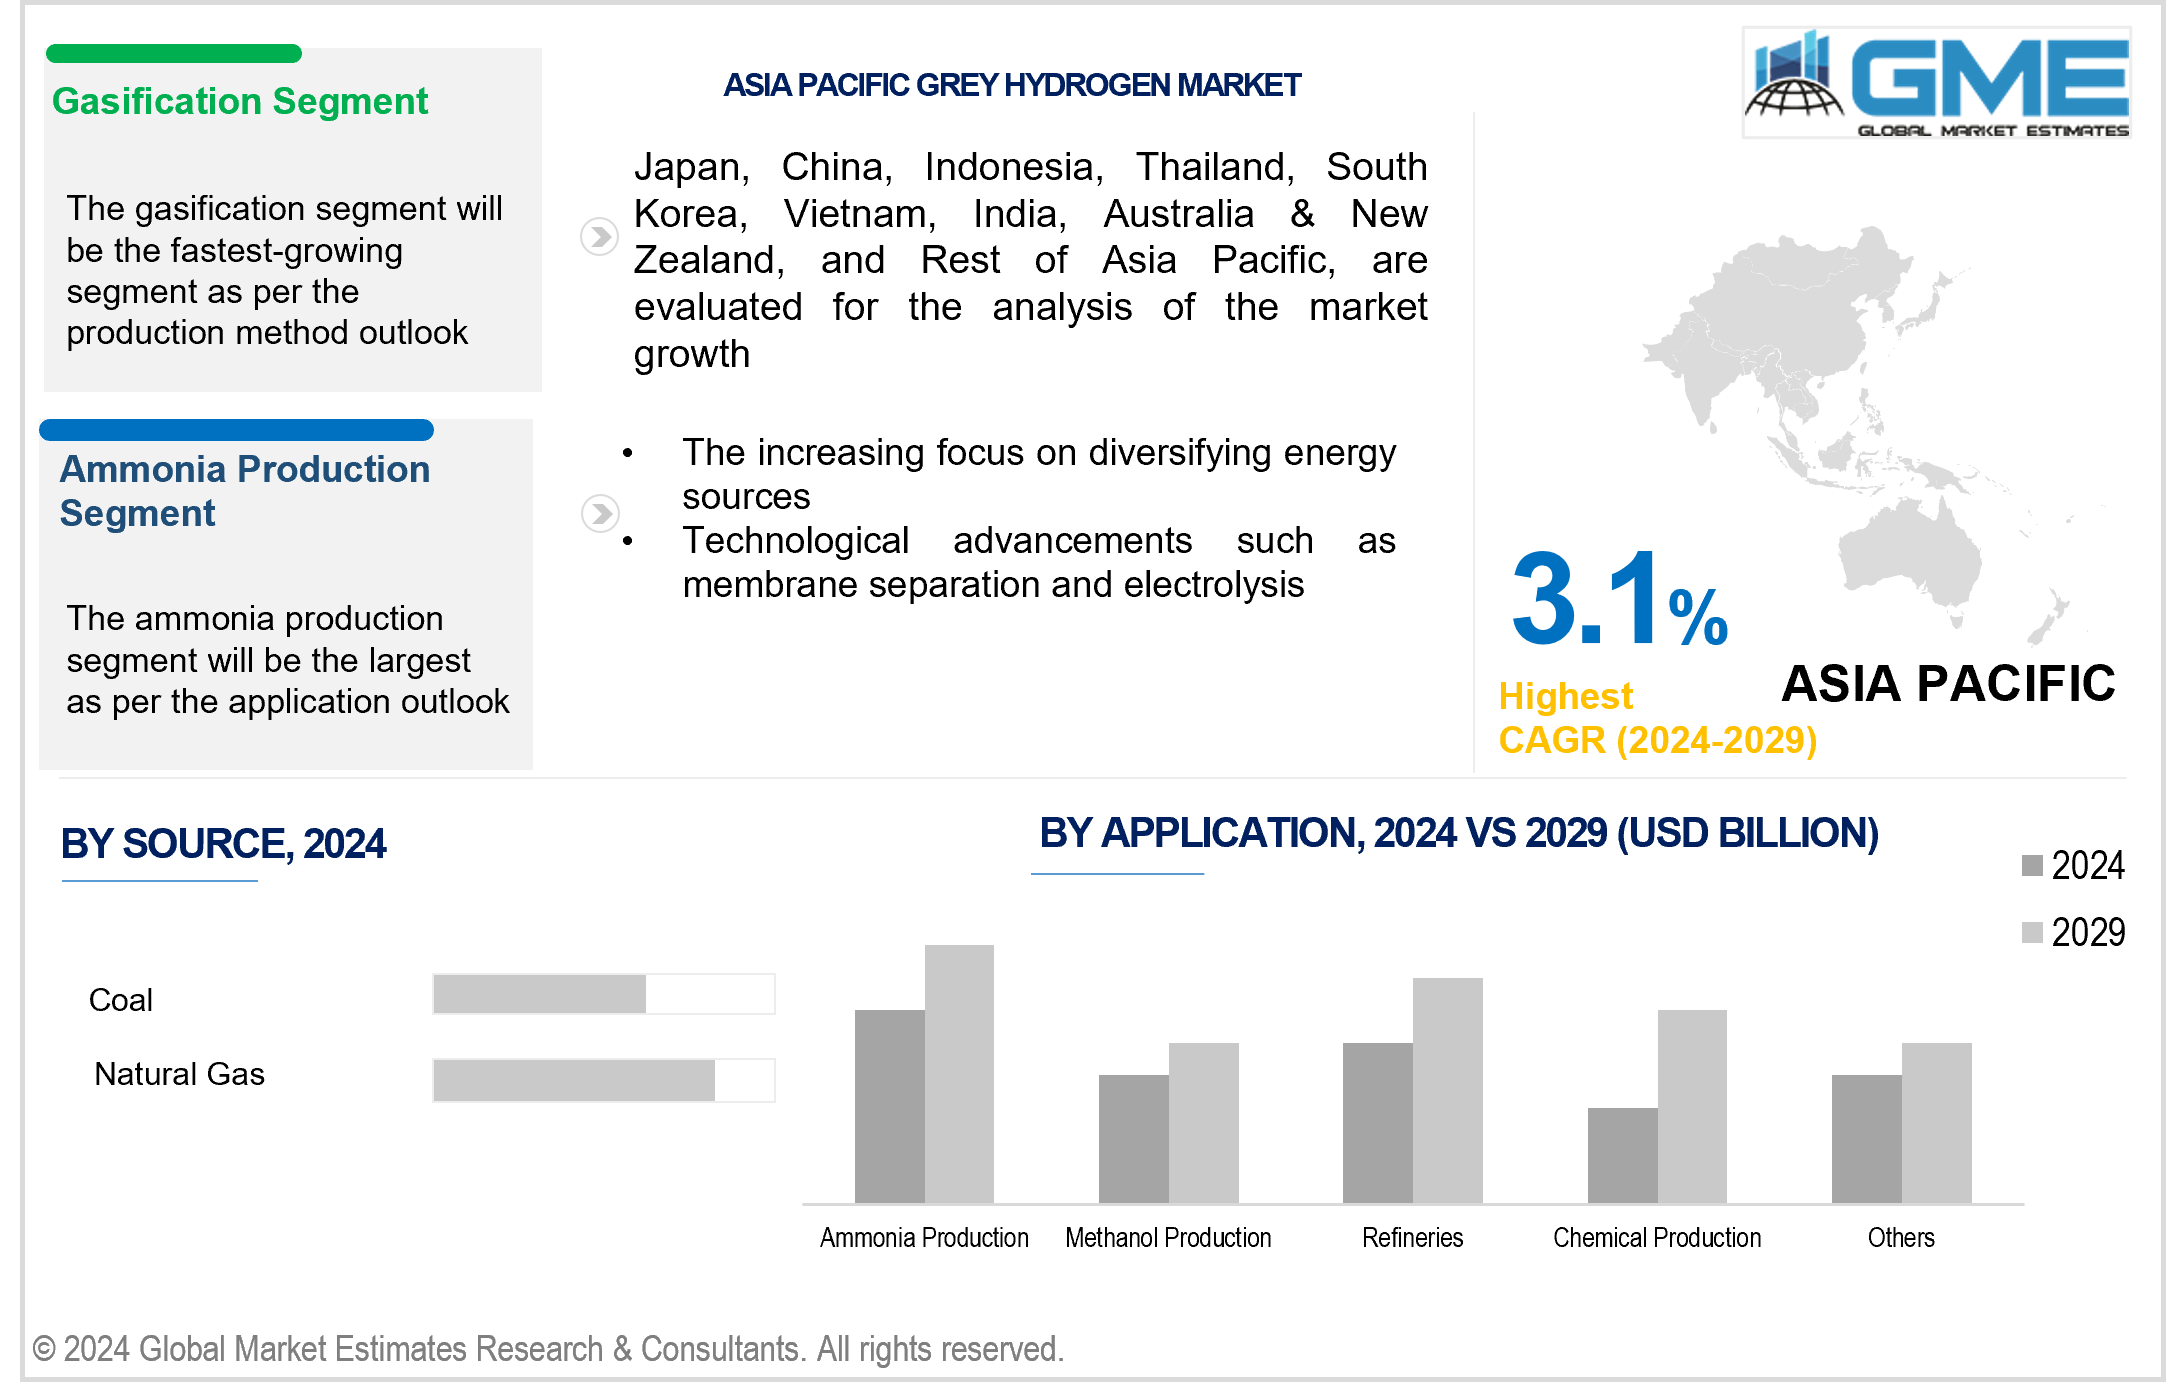
The increasing focus on diversifying energy sources and technological advancements such as membrane separation and electrolysis propel market growth. Decentralized hydrogen production is made possible by the modularity and flexibility of modern membrane separation and electrolysis systems. Decentralization lowers transportation costs and boosts supply chain resilience by enabling the installation of grey hydrogen production facilities closer to end users.
Grey hydrogen production can be combined with CCS technologies to reduce carbon emissions. The creation of "blue hydrogen," which provides low- or carbon-carbon hydrogen generation options, is made possible by this combination. There are opportunities for grey hydrogen producers to meet the growing demand for low-carbon hydrogen by developing blue hydrogen production facilities and investing in CCS systems. Additionally, the expansion of hydrogen infrastructure, including production, storage, transportation, and refueling stations, presents significant opportunities for grey hydrogen market growth.
However, increasing regulatory pressure to reduce carbon emissions and the presence of alternative low-carbon fuels hinder market growth.
The natural gas segment is expected to hold the largest share of the market over the forecast period. A significant number of industrial facilities currently have the necessary infrastructure to use natural gas as a feedstock to produce grey hydrogen. The infrastructure, which consists of pipelines, processing facilities, and storage facilities, enables the economical and practical production of grey hydrogen from natural gas.
The coal segment is expected to be the fastest-growing segment in the market from 2024 to 2029. The process of turning coal into hydrogen has become more efficient and economical due to developments in coal gasification technology. Cleaner and more effective hydrogen generation is possible through the use of gasification techniques, which can extract grey hydrogen from coal while removing pollutants and other impurities.
The steam reformation segment is expected to hold the largest share of the market over the forecast period. The process of producing hydrogen through steam reformation is a proven and advanced technique. Industries have been using it extensively for a long time due to its dependability and efficiency. In the grey hydrogen industry, steam reformation is the predominant method, contributing significantly to global hydrogen generation.
The gasification segment is anticipated to be the fastest-growing segment in the market from 2024-2029. Using gasification technology, various feedstocks, such as biomass, coal, and municipal solid waste, can be transformed into syngas high in hydrogen. Due to its adaptability, companies can make use of locally accessible feedstock resources, which lessens reliance on particular raw materials and increases the resilience of the supply chain.
The ammonia production segment is expected to hold the largest share of the market over the forecast period. Ammonia production is one of the largest consumers of hydrogen globally. Hydrogen is a necessary feedstock in the Haber-Bosch process that allows nitrogen (N2) and hydrogen (H2) to be converted into ammonia (NH3). The vast scale of the ammonia industry translates into a substantial demand for hydrogen, making it a dominant application segment in the grey hydrogen market.
The chemical production segment is anticipated to be the fastest-growing segment in the market from 2024-2029. Hydrogen serves as a crucial intermediate in many chemical processes. It is used in the production of different chemical compounds through hydrodealkylation, hydrogenolysis, and hydrogenation. It is anticipated that the need for hydrogen in chemical production will increase significantly as advances in chemical synthesis and manufacturing techniques continue.
North America is expected to be the largest region in the global market. With a broad spectrum of industries, including petrochemicals, fertilizers, and medicines, North America has one of the largest chemical production sectors globally. The growing necessity of grey hydrogen as an intermediary and feedstock for several chemical processes is driving the market growth in the region.
Asia Pacific is anticipated to witness rapid growth during the forecast period. Countries in the Asia Pacific region, such as China and Australia, possess abundant coal and natural gas reserves. Grey hydrogen production primarily relies on steam methane reforming (SMR) of natural gas or coal gasification, making these resources essential drivers of grey hydrogen production in the region. For instance, Australia ranked third globally in 2021, behind the United States (23%) and Russia (15%), with 14% of the world's coal reserves (black and brown), according to Geoscience Australia.
Orsted A/S, Reliance Industries Ltd - (RIL) India, Iberdrola S.A., Indian Oil Corporation Limited, Air Products & Chemicals Inc., Air Liquide, Messer Group, Exxon Mobil Corporation, China National Petroleum Corporation, and Linde plc, among others, are some of the key players in the global grey hydrogen market.
Please note: This is not an exhaustive list of companies profiled in the report.
In January 2024, Air Liquide and TotalEnergies announced the establishment of TEAL Mobility. With a network of 100 stations along important European routes, TEAL Mobility, which is equally owned by the two companies, is accelerating the development of hydrogen for heavy-duty trucks.
In March 2020, Air Products signed contracts with PBF Energy for a long-term hydrogen supply and to purchase five operational hydrogen plants for USD 530 million.
1 STRATEGIC INSIGHTS ON NEW REVENUE POCKETS
1.1 Strategic Opportunity & Attractiveness Analysis
1.1.1 Hot Revenue Pockets
1.1.2 Market Attractiveness Score
1.1.3 Revenue Impacting Opportunity
1.1.4 High Growing Region/Country
1.1.5 Competitor Analysis
1.1.6 Consumer Analysis
1.2 Global Market Estimates' View
1.3 Strategic Insights across Business Functions
1.3.1 For Chief Executive Officers
1.3.2 For Chief Marketing Officers
1.3.3 For Chief Strategy Officers
1.4 Evaluate the Potential of your Existing Business Lines vs. New Lines to Enter Into
2 TECHNOLOGICAL TRENDS
2.1 Technological Adoption Rate
2.2 Current Trend Impact Analysis
2.3 Future Trend Impact Analysis
3 GLOBAL GREY HYDROGEN MARKET OUTLOOK
3.1 Market Pyramid Analysis
3.1.1 Introduction
3.1.2 Adjacent Market Opportunities
3.1.3 Ancillary Market Opportunities
3.2 Demand Side Analysis
3.2.1 Market Drivers: Impact Analysis
3.2.2 Market Restraints: Impact Analysis
3.2.3 Market Opportunities: Impact Analysis
3.2.4 Market Challenges: Impact Analysis
3.3 Supply Side Analysis
3.3.1 Porter’s Five Forces Analysis
3.3.1.1 Threat of New Entrants
3.3.1.2 Threat of New Substitutes
3.3.1.3 Bargaining Power of Suppliers
3.3.1.4 Bargaining Power of Buyers
3.3.1.5 Intensity of Competitive Rivalry
3.3.2 SWOT Analysis; By Factor (Political & Legal, Economic, and Technological)
3.3.2.1 Political Landscape
3.3.2.2 Economic Landscape
3.3.2.3 Social Landscape
3.3.2.4 Technology Landscape
3.3.3 Value Chain Analysis
3.3.4 Trend Analysis
3.3.5 Gap Analysis
3.3.6 Cost Analysis
4 GLOBAL GREY HYDROGEN MARKET, BY SOURCE
4.1 Introduction
4.2 Grey Hydrogen Market: Source Scope Key Takeaways
4.3 Revenue Growth Analysis, 2023 & 2029
4.4 Natural Gas
4.4.1 Natural Gas Market Estimates and Forecast, 2021-2029 (USD Million)
4.5 Coal
4.5.1 Coal Market Estimates and Forecast, 2021-2029 (USD Million)
4.6 Others
4.6.1 Others Market Estimates and Forecast, 2021-2029 (USD Million)
5 GLOBAL GREY HYDROGEN MARKET, BY APPLICATION
5.1 Introduction
5.2 Grey Hydrogen Market: Application Scope Key Takeaways
5.3 Revenue Growth Analysis, 2023 & 2029
5.4 Ammonia Production
5.4.1 Ammonia Production Market Estimates and Forecast, 2021-2029 (USD Million)
5.5 Methanol Production
5.5.1 Methanol Production Market Estimates and Forecast, 2021-2029 (USD Million)
5.6 Refineries
5.6.1 Refineries Market Estimates and Forecast, 2021-2029 (USD Million)
5.7 Chemical Production
5.7.1 Chemical Production Market Estimates and Forecast, 2021-2029 (USD Million)
5.8 Others
5.8.1 Others Market Estimates and Forecast, 2021-2029 (USD Million)
6 GLOBAL GREY HYDROGEN MARKET, BY PRODUCTION METHOD
6.1 Introduction
6.2 Grey Hydrogen Market: Production Method Scope Key Takeaways
6.3 Revenue Growth Analysis, 2023 & 2029
6.4 Steam Reformation
6.4.1 Steam Reformation Market Estimates and Forecast, 2021-2029 (USD Million)
6.5 Gasification
6.5.1 Gasification Market Estimates and Forecast, 2021-2029 (USD Million)
6.6 Others
6.6.1 Others Market Estimates and Forecast, 2021-2029 (USD Million)
7 GLOBAL GREY HYDROGEN MARKET, BY REGION
7.1 Introduction
7.2 North America Grey Hydrogen Market Estimates and Forecast, 2021-2029 (USD Million)
7.2.1 By Source
7.2.2 By Application
7.2.3 By Production Method
7.2.4 By Country
7.2.4.1 U.S. Grey Hydrogen Market Estimates and Forecast, 2021-2029 (USD Million)
7.2.4.1.1 By Source
7.2.4.1.2 By Application
7.2.4.1.3 By Production Method
7.2.4.2 Canada Grey Hydrogen Market Estimates and Forecast, 2021-2029 (USD Million)
7.2.4.2.1 By Source
7.2.4.2.2 By Application
7.2.4.2.3 By Production Method
7.2.4.3 Mexico Grey Hydrogen Market Estimates and Forecast, 2021-2029 (USD Million)
7.2.4.3.1 By Source
7.2.4.3.2 By Application
7.2.4.3.3 By Production Method
7.3 Europe Grey Hydrogen Market Estimates and Forecast, 2021-2029 (USD Million)
7.3.1 By Source
7.3.2 By Application
7.3.3 By Production Method
7.3.4 By Country
7.3.4.1 Germany Grey Hydrogen Market Estimates and Forecast, 2021-2029 (USD Million)
7.3.4.1.1 By Source
7.3.4.1.2 By Application
7.3.4.1.3 By Production Method
7.3.4.2 U.K. Grey Hydrogen Market Estimates and Forecast, 2021-2029 (USD Million)
7.3.4.2.1 By Source
7.3.4.2.2 By Application
7.3.4.2.3 By Production Method
7.3.4.3 France Grey Hydrogen Market Estimates and Forecast, 2021-2029 (USD Million)
7.3.4.3.1 By Source
7.3.4.3.2 By Application
7.3.4.3.3 By Production Method
7.3.4.4 Italy Grey Hydrogen Market Estimates and Forecast, 2021-2029 (USD Million)
7.3.4.4.1 By Source
7.3.4.4.2 By Application
7.2.4.4.3 By Production Method
7.3.4.5 Spain Grey Hydrogen Market Estimates and Forecast, 2021-2029 (USD Million)
7.3.4.5.1 By Source
7.3.4.5.2 By Application
7.2.4.5.3 By Production Method
7.3.4.6 Netherlands Grey Hydrogen Market Estimates and Forecast, 2021-2029 (USD Million)
7.3.4.6.1 By Source
7.3.4.6.2 By Application
7.2.4.6.3 By Production Method
7.3.4.7 Rest of Europe Grey Hydrogen Market Estimates and Forecast, 2021-2029 (USD Million)
7.3.4.7.1 By Source
7.3.4.7.2 By Application
7.2.4.7.3 By Production Method
7.4 Asia Pacific Grey Hydrogen Market Estimates and Forecast, 2021-2029 (USD Million)
7.4.1 By Source
7.4.2 By Application
7.4.3 By Production Method
7.4.4 By Country
7.4.4.1 China Grey Hydrogen Market Estimates and Forecast, 2021-2029 (USD Million)
7.4.4.1.1 By Source
7.4.4.1.2 By Application
7.4.4.1.3 By Production Method
7.4.4.2 Japan Grey Hydrogen Market Estimates and Forecast, 2021-2029 (USD Million)
7.4.4.2.1 By Source
7.4.4.2.2 By Application
7.4.4.2.3 By Production Method
7.4.4.3 India Grey Hydrogen Market Estimates and Forecast, 2021-2029 (USD Million)
7.4.4.3.1 By Source
7.4.4.3.2 By Application
7.4.4.3.3 By Production Method
7.4.4.4 South Korea Grey Hydrogen Market Estimates and Forecast, 2021-2029 (USD Million)
7.4.4.4.1 By Source
7.4.4.4.2 By Application
7.4.4.4.3 By Production Method
7.4.4.5 Singapore Grey Hydrogen Market Estimates and Forecast, 2021-2029 (USD Million)
7.4.4.5.1 By Source
7.4.4.5.2 By Application
7.4.4.5.3 By Production Method
7.4.4.6 Malaysia Grey Hydrogen Market Estimates and Forecast, 2021-2029 (USD Million)
7.4.4.6.1 By Source
7.4.4.6.2 By Application
7.4.4.6.3 By Production Method
7.4.4.7 Thailand Grey Hydrogen Market Estimates and Forecast, 2021-2029 (USD Million)
7.4.4.7.1 By Source
7.4.4.7.2 By Application
7.4.4.7.3 By Production Method
7.4.4.8 Indonesia Grey Hydrogen Market Estimates and Forecast, 2021-2029 (USD Million)
7.4.4.8.1 By Source
7.4.4.8.2 By Application
7.4.4.8.3 By Production Method
7.4.4.9 Vietnam Grey Hydrogen Market Estimates and Forecast, 2021-2029 (USD Million)
7.4.4.9.1 By Source
7.4.4.9.2 By Application
7.4.4.9.3 By Production Method
7.4.4.10 Taiwan Grey Hydrogen Market Estimates and Forecast, 2021-2029 (USD Million)
7.4.4.10.1 By Source
7.4.4.10.2 By Application
7.4.4.10.3 By Production Method
7.4.4.11 Rest of Asia Pacific Grey Hydrogen Market Estimates and Forecast, 2021-2029 (USD Million)
7.4.4.11.1 By Source
7.4.4.11.2 By Application
7.4.4.11.3 By Production Method
7.5 Middle East and Africa Grey Hydrogen Market Estimates and Forecast, 2021-2029 (USD Million)
7.5.1 By Source
7.5.2 By Application
7.5.3 By Production Method
7.5.4 By Country
7.5.4.1 Saudi Arabia Grey Hydrogen Market Estimates and Forecast, 2021-2029 (USD Million)
7.5.4.1.1 By Source
7.5.4.1.2 By Application
7.5.4.1.3 By Production Method
7.5.4.2 U.A.E. Grey Hydrogen Market Estimates and Forecast, 2021-2029 (USD Million)
7.5.4.2.1 By Source
7.5.4.2.2 By Application
7.5.4.2.3 By Production Method
7.5.4.3 Israel Grey Hydrogen Market Estimates and Forecast, 2021-2029 (USD Million)
7.5.4.3.1 By Source
7.5.4.3.2 By Application
7.5.4.3.3 By Production Method
7.5.4.4 South Africa Grey Hydrogen Market Estimates and Forecast, 2021-2029 (USD Million)
7.5.4.4.1 By Source
7.5.4.4.2 By Application
7.5.4.4.3 By Production Method
7.5.4.5 Rest of Middle East and Africa Grey Hydrogen Market Estimates and Forecast, 2021-2029 (USD Million)
7.5.4.5.1 By Source
7.5.4.5.2 By Application
7.5.4.5.2 By Production Method
7.6 Central and South America Grey Hydrogen Market Estimates and Forecast, 2021-2029 (USD Million)
7.6.1 By Source
7.6.2 By Application
7.6.3 By Production Method
7.6.4 By Country
7.6.4.1 Brazil Grey Hydrogen Market Estimates and Forecast, 2021-2029 (USD Million)
7.6.4.1.1 By Source
7.6.4.1.2 By Application
7.6.4.1.3 By Production Method
7.6.4.2 Argentina Grey Hydrogen Market Estimates and Forecast, 2021-2029 (USD Million)
7.6.4.2.1 By Source
7.6.4.2.2 By Application
7.6.4.2.3 By Production Method
7.6.4.3 Chile Grey Hydrogen Market Estimates and Forecast, 2021-2029 (USD Million)
7.6.4.3.1 By Source
7.6.4.3.2 By Application
7.6.4.3.3 By Production Method
7.6.4.4 Rest of Central and South America Grey Hydrogen Market Estimates and Forecast, 2021-2029 (USD Million)
7.6.4.4.1 By Source
7.6.4.4.2 By Application
7.6.4.4.3 By Production Method
8 COMPETITIVE LANDCAPE
8.1 Company Market Share Analysis
8.2 Four Quadrant Positioning Matrix
8.2.1 Market Leaders
8.2.2 Market Visionaries
8.2.3 Market Challengers
8.2.4 Niche Market Players
8.3 Vendor Landscape
8.3.1 North America
8.3.2 Europe
8.3.3 Asia Pacific
8.3.4 Rest of the World
8.4 Company Profiles
8.4.1 Orsted A/S
8.4.1.1 Business Description & Financial Analysis
8.4.1.2 SWOT Analysis
8.4.1.3 Products & Services Offered
8.4.1.4 Strategic Alliances between Business Partners
8.4.2 Reliance Industries Ltd - (RIL) India
8.4.2.1 Business Description & Financial Analysis
8.4.2.2 SWOT Analysis
8.4.2.3 Products & Services Offered
8.4.2.4 Strategic Alliances between Business Partners
8.4.3 Iberdrola S.A.
8.4.3.1 Business Description & Financial Analysis
8.4.3.2 SWOT Analysis
8.4.3.3 Products & Services Offered
8.4.3.4 Strategic Alliances between Business Partners
8.4.4 Indian Oil Corporation Limited
8.4.4.1 Business Description & Financial Analysis
8.4.4.2 SWOT Analysis
8.4.4.3 Products & Services Offered
8.4.4.4 Strategic Alliances between Business Partners
8.4.5 Air Products & Chemicals Inc.
8.4.5.1 Business Description & Financial Analysis
8.4.5.2 SWOT Analysis
8.4.5.3 Products & Services Offered
8.4.5.4 Strategic Alliances between Business Partners
8.4.6 AIR LIQUIDE
8.4.6.1 Business Description & Financial Analysis
8.4.6.2 SWOT Analysis
8.4.6.3 Products & Services Offered
8.4.6.4 Strategic Alliances between Business Partners
8.4.7 Messer Group
8.4.7.1 Business Description & Financial Analysis
8.4.7.2 SWOT Analysis
8.4.7.3 Products & Services Offered
8.4.8.4 Strategic Alliances between Business Partners
8.4.8 Exxon Mobil Corporation
8.4.8.1 Business Description & Financial Analysis
8.4.8.2 SWOT Analysis
8.4.8.3 Products & Services Offered
8.4.8.4 Strategic Alliances between Business Partners
8.4.9 China National Petroleum Corporation
8.4.9.1 Business Description & Financial Analysis
8.4.9.2 SWOT Analysis
8.4.9.3 Products & Services Offered
8.4.9.4 Strategic Alliances between Business Partners
8.4.10 Linde plc
8.4.10.1 Business Description & Financial Analysis
8.4.10.2 SWOT Analysis
8.4.10.3 Products & Services Offered
8.4.10.4 Strategic Alliances between Business Partners
8.4.11 Other Companies
8.4.11.1 Business Description & Financial Analysis
8.4.11.2 SWOT Analysis
8.4.11.3 Products & Services Offered
8.4.11.4 Strategic Alliances between Business Partners
9 RESEARCH METHODOLOGY
9.1 Market Introduction
9.1.1 Market Definition
9.1.2 Market Scope & Segmentation
9.2 Information Procurement
9.2.1 Secondary Research
9.2.1.1 Purchased Databases
9.2.1.2 GMEs Internal Data Repository
9.2.1.3 Secondary Resources & Third Party Perspectives
9.2.1.4 Company Information Sources
9.2.2 Primary Research
9.2.2.1 Various Types of Respondents for Primary Interviews
9.2.2.2 Number of Interviews Conducted throughout the Research Process
9.2.2.3 Primary Stakeholders
9.2.2.4 Discussion Guide for Primary Participants
9.2.3 Expert Panels
9.2.3.1 Expert Panels Across 30+ Industry
9.2.4 Paid Local Experts
9.2.4.1 Paid Local Experts Across 30+ Industry Across each Region
9.3 Market Estimation
9.3.1 Top-Down Approach
9.3.1.1 Macro-Economic Indicators Considered
9.3.1.2 Micro-Economic Indicators Considered
9.3.2 Bottom Up Approach
9.3.2.1 Company Share Analysis Approach
9.3.2.2 Estimation of Potential Type Sales
9.4 Data Triangulation
9.4.1 Data Collection
9.4.2 Time Series, Cross Sectional & Panel Data Analysis
9.4.3 Cluster Analysis
9.5 Analysis and Output
9.5.1 Inhouse AI Based Real Time Analytics Tool
9.5.2 Output From Desk & Primary Research
9.6 Research Assumptions & Limitations
9.7.1 Research Assumptions
9.7.2 Research Limitations
LIST OF TABLES
1 Global Grey Hydrogen Market, By Source, 2021-2029 (USD Mllion)
2 Natural Gas Market, By Region, 2021-2029 (USD Mllion)
3 Coal Market, By Region, 2021-2029 (USD Mllion)
4 Others Market, By Region, 2021-2029 (USD Mllion)
5 Global Grey Hydrogen Market, By Application, 2021-2029 (USD Mllion)
6 Ammonia Production Market, By Region, 2021-2029 (USD Mllion)
7 Methanol Production Market, By Region, 2021-2029 (USD Mllion)
8 Refineries Market, By Region, 2021-2029 (USD Mllion)
9 Chemical Production Market, By Region, 2021-2029 (USD Mllion)
10 Others Market, By Region, 2021-2029 (USD Mllion)
11 Global Grey Hydrogen Market, By Production Method, 2021-2029 (USD Mllion)
12 Steam Reformation Market, By Region, 2021-2029 (USD Mllion)
13 Gasification Market, By Region, 2021-2029 (USD Mllion)
14 Others Market, By Region, 2021-2029 (USD Mllion)
15 Regional Analysis, 2021-2029 (USD Mllion)
16 North America Grey Hydrogen Market, By Source, 2021-2029 (USD Million)
17 North America Grey Hydrogen Market, By Application, 2021-2029 (USD Million)
18 North America Grey Hydrogen Market, By Production Method, 2021-2029 (USD Million)
19 North America Grey Hydrogen Market, By Country, 2021-2029 (USD Million)
20 U.S Grey Hydrogen Market, By Source, 2021-2029 (USD Million)
21 U.S Grey Hydrogen Market, By Application, 2021-2029 (USD Million)
22 U.S Grey Hydrogen Market, By Production Method, 2021-2029 (USD Million)
23 Canada Grey Hydrogen Market, By Source, 2021-2029 (USD Million)
24 Canada Grey Hydrogen Market, By Application, 2021-2029 (USD Million)
25 Canada Grey Hydrogen Market, By Production Method, 2021-2029 (USD Million)
26 Mexico Grey Hydrogen Market, By Source, 2021-2029 (USD Million)
27 Mexico Grey Hydrogen Market, By Application, 2021-2029 (USD Million)
28 Mexico Grey Hydrogen Market, By Production Method, 2021-2029 (USD Million)
29 Europe Grey Hydrogen Market, By Source, 2021-2029 (USD Million)
30 Europe Grey Hydrogen Market, By Application, 2021-2029 (USD Million)
31 Europe Grey Hydrogen Market, By Production Method, 2021-2029 (USD Million)
32 Europe Grey Hydrogen Market, By Country 2021-2029 (USD Million)
33 Germany Grey Hydrogen Market, By Source, 2021-2029 (USD Million)
34 Germany Grey Hydrogen Market, By Application, 2021-2029 (USD Million)
35 Germany Grey Hydrogen Market, By Production Method, 2021-2029 (USD Million)
36 U.K. Grey Hydrogen Market, By Source, 2021-2029 (USD Million)
37 U.K. Grey Hydrogen Market, By Application, 2021-2029 (USD Million)
38 U.K. Grey Hydrogen Market, By Production Method, 2021-2029 (USD Million)
39 France Grey Hydrogen Market, By Source, 2021-2029 (USD Million)
40 France Grey Hydrogen Market, By Application, 2021-2029 (USD Million)
41 France Grey Hydrogen Market, By Production Method, 2021-2029 (USD Million)
42 Italy Grey Hydrogen Market, By Source, 2021-2029 (USD Million)
43 Italy Grey Hydrogen Market, By application, 2021-2029 (USD Million)
44 Italy Grey Hydrogen Market, By Production Method, 2021-2029 (USD Million)
45 Spain Grey Hydrogen Market, By Source, 2021-2029 (USD Million)
46 Spain Grey Hydrogen Market, By Application, 2021-2029 (USD Million)
47 Spain Grey Hydrogen Market, By Production Method, 2021-2029 (USD Million)
48 Netherlands Grey Hydrogen Market, By Source, 2021-2029 (USD Million)
49 Netherlands Grey Hydrogen Market, By Application, 2021-2029 (USD Million)
50 Netherlands Grey Hydrogen Market, By Production Method, 2021-2029 (USD Million)
51 Rest Of Europe Grey Hydrogen Market, By Source, 2021-2029 (USD Million)
52 Rest Of Europe Grey Hydrogen Market, By Application, 2021-2029 (USD Million)
53 Rest of Europe Grey Hydrogen Market, By Production Method, 2021-2029 (USD Million)
54 Asia Pacific Grey Hydrogen Market, By Source, 2021-2029 (USD Million)
55 Asia Pacific Grey Hydrogen Market, By Application, 2021-2029 (USD Million)
56 Asia Pacific Grey Hydrogen Market, By Production Method, 2021-2029 (USD Million)
57 Asia Pacific Grey Hydrogen Market, By Country, 2021-2029 (USD Million)
58 China Grey Hydrogen Market, By Source, 2021-2029 (USD Million)
59 China Grey Hydrogen Market, By Application, 2021-2029 (USD Million)
60 China Grey Hydrogen Market, By Production Method, 2021-2029 (USD Million)
61 India Grey Hydrogen Market, By Source, 2021-2029 (USD Million)
62 India Grey Hydrogen Market, By Application, 2021-2029 (USD Million)
63 India Grey Hydrogen Market, By Production Method, 2021-2029 (USD Million)
64 Japan Grey Hydrogen Market, By Source, 2021-2029 (USD Million)
65 Japan Grey Hydrogen Market, By Application, 2021-2029 (USD Million)
66 Japan Grey Hydrogen Market, By Production Method, 2021-2029 (USD Million)
67 South Korea Grey Hydrogen Market, By Source, 2021-2029 (USD Million)
68 South Korea Grey Hydrogen Market, By Application, 2021-2029 (USD Million)
69 South Korea Grey Hydrogen Market, By Production Method, 2021-2029 (USD Million)
70 malaysia Grey Hydrogen Market, By Source, 2021-2029 (USD Million)
71 malaysia Grey Hydrogen Market, By Application, 2021-2029 (USD Million)
72 malaysia Grey Hydrogen Market, By Production Method, 2021-2029 (USD Million)
73 Thailand Grey Hydrogen Market, By Source, 2021-2029 (USD Million)
74 Thailand Grey Hydrogen Market, By Application, 2021-2029 (USD Million)
75 Thailand Grey Hydrogen Market, By Production Method, 2021-2029 (USD Million)
76 Indonesia Grey Hydrogen Market, By Source, 2021-2029 (USD Million)
77 Indonesia Grey Hydrogen Market, By Application, 2021-2029 (USD Million)
78 Indonesia Grey Hydrogen Market, By Production Method, 2021-2029 (USD Million)
79 Vietnam Grey Hydrogen Market, By Source, 2021-2029 (USD Million)
80 Vietnam Grey Hydrogen Market, By Application, 2021-2029 (USD Million)
81 Vietnam Grey Hydrogen Market, By Production Method, 2021-2029 (USD Million)
82 Taiwan Grey Hydrogen Market, By Source, 2021-2029 (USD Million)
83 Taiwan Grey Hydrogen Market, By Application, 2021-2029 (USD Million)
84 Taiwan Grey Hydrogen Market, By Production Method, 2021-2029 (USD Million)
85 Rest of Asia Pacific Grey Hydrogen Market, By Source, 2021-2029 (USD Million)
86 Rest of Asia Pacific Grey Hydrogen Market, By Application, 2021-2029 (USD Million)
87 Rest of Asia Pacific Grey Hydrogen Market, By Production Method, 2021-2029 (USD Million)
88 Middle East and Africa Grey Hydrogen Market, By Source, 2021-2029 (USD Million)
89 Middle East and Africa Grey Hydrogen Market, By Application, 2021-2029 (USD Million)
90 Middle East and Africa Grey Hydrogen Market, By Production Method, 2021-2029 (USD Million)
91 Middle East and Africa Grey Hydrogen Market, By Country, 2021-2029 (USD Million)
92 Saudi Arabia Grey Hydrogen Market, By Source, 2021-2029 (USD Million)
93 Saudi Arabia Grey Hydrogen Market, By Application, 2021-2029 (USD Million)
94 Saudi Arabia Grey Hydrogen Market, By Production Method, 2021-2029 (USD Million)
95 UAE Grey Hydrogen Market, By Source, 2021-2029 (USD Million)
96 UAE Grey Hydrogen Market, By Application, 2021-2029 (USD Million)
97 UAE Grey Hydrogen Market, By Production Method, 2021-2029 (USD Million)
98 Israel Grey Hydrogen Market, By Source, 2021-2029 (USD Million)
99 Israel Grey Hydrogen Market, By Application, 2021-2029 (USD Million)
100 Israel Grey Hydrogen Market, By Production Method, 2021-2029 (USD Million)
101 South Africa Grey Hydrogen Market, By Source, 2021-2029 (USD Million)
102 South Africa Grey Hydrogen Market, By Application, 2021-2029 (USD Million)
103 South Africa Grey Hydrogen Market, By Production Method, 2021-2029 (USD Million)
104 Rest of Middle East and Africa Grey Hydrogen Market, By Source, 2021-2029 (USD Million)
105 Rest of Middle East and Africa Grey Hydrogen Market, By Application, 2021-2029 (USD Million)
106 Rest of Middle East and Africa Grey Hydrogen Market, By Production Method, 2021-2029 (USD Million)
107 Central and South America Grey Hydrogen Market, By Source, 2021-2029 (USD Million)
108 Central and South America Grey Hydrogen Market, By Application, 2021-2029 (USD Million)
109 Central and South America Grey Hydrogen Market, By Production Method, 2021-2029 (USD Million)
110 Central and South America Grey Hydrogen Market, By Country, 2021-2029 (USD Million)
111 Brazil Grey Hydrogen Market, By Source, 2021-2029 (USD Million)
112 Brazil Grey Hydrogen Market, By Application, 2021-2029 (USD Million)
113 Brazil Grey Hydrogen Market, By Production Method, 2021-2029 (USD Million)
114 Argentina Grey Hydrogen Market, By Source, 2021-2029 (USD Million)
115 Argentina Grey Hydrogen Market, By Application, 2021-2029 (USD Million)
116 Argentina Grey Hydrogen Market, By Production Method, 2021-2029 (USD Million)
117 Chile Grey Hydrogen Market, By Source, 2021-2029 (USD Million)
118 Chile Grey Hydrogen Market, By Application, 2021-2029 (USD Million)
119 Chile Grey Hydrogen Market, By Production Method, 2021-2029 (USD Million)
120 Rest of Central and South America Grey Hydrogen Market, By Source, 2021-2029 (USD Million)
121 Rest of Central and South America Grey Hydrogen Market, By Application, 2021-2029 (USD Million)
122 Rest of Central and South America Grey Hydrogen Market, By Production Method, 2021-2029 (USD Million)
123 Orsted A/S: Products & Services Offering
124 Reliance Industries Ltd - (RIL) India: Products & Services Offering
125 Iberdrola S.A.: Products & Services Offering
126 Indian Oil Corporation Limited: Products & Services Offering
127 Air Products & Chemicals Inc.: Products & Services Offering
128 AIR LIQUIDE: Products & Services Offering
129 Messer Group: Products & Services Offering
130 Exxon Mobil Corporation: Products & Services Offering
131 China National Petroleum Corporation, Inc: Products & Services Offering
132 Linde plc: Products & Services Offering
133 Other Companies: Products & Services Offering
LIST OF FIGURES
1 Global Grey Hydrogen Market Overview
2 Global Grey Hydrogen Market Value From 2021-2029 (USD Mllion)
3 Global Grey Hydrogen Market Share, By Source (2023)
4 Global Grey Hydrogen Market Share, By Application (2023)
5 Global Grey Hydrogen Market Share, By Production Method (2023)
6 Global Grey Hydrogen Market, By Region (Asia Pacific Market)
7 Technological Trends In Global Grey Hydrogen Market
8 Four Quadrant Competitor Positioning Matrix
9 Impact Of Macro & Micro Indicators On The Market
10 Impact Of Key Drivers On The Global Grey Hydrogen Market
11 Impact Of Challenges On The Global Grey Hydrogen Market
12 Porter’s Five Forces Analysis
13 Global Grey Hydrogen Market: By Source Scope Key Takeaways
14 Global Grey Hydrogen Market, By Source Segment: Revenue Growth Analysis
15 Natural Gas Market, By Region, 2021-2029 (USD Mllion)
16 Coal Market, By Region, 2021-2029 (USD Mllion)
17 Others Market, By Region, 2021-2029 (USD Mllion)
18 Global Grey Hydrogen Market: By Application Scope Key Takeaways
19 Global Grey Hydrogen Market, By Application Segment: Revenue Growth Analysis
20 Ammonia Production Market, By Region, 2021-2029 (USD Mllion)
21 Methanol Production Market, By Region, 2021-2029 (USD Mllion)
22 Refineries Market, By Region, 2021-2029 (USD Mllion)
23 Chemical Production Market, By Region, 2021-2029 (USD Mllion)
24 Others Market, By Region, 2021-2029 (USD Mllion)
25 Global Grey Hydrogen Market: By Production Method Scope Key Takeaways
26 Global Grey Hydrogen Market, By Production Method Segment: Revenue Growth Analysis
27 Steam Reformation Market, By Region, 2021-2029 (USD Mllion)
28 Gasification Market, By Region, 2021-2029 (USD Mllion)
29 Others Market, By Region, 2021-2029 (USD Mllion)
30 Regional Segment: Revenue Growth Analysis
31 Global Grey Hydrogen Market: Regional Analysis
32 North America Grey Hydrogen Market Overview
33 North America Grey Hydrogen Market, By Source
34 North America Grey Hydrogen Market, By Application
35 North America Grey Hydrogen Market, By Production Method
36 North America Grey Hydrogen Market, By Country
37 U.S. Grey Hydrogen Market, By Source
38 U.S. Grey Hydrogen Market, By Application
39 U.S. Grey Hydrogen Market, By Production Method
40 Canada Grey Hydrogen Market, By Source
41 Canada Grey Hydrogen Market, By Application
42 Canada Grey Hydrogen Market, By Production Method
43 Mexico Grey Hydrogen Market, By Source
44 Mexico Grey Hydrogen Market, By Application
45 Mexico Grey Hydrogen Market, By Production Method
46 Four Quadrant Positioning Matrix
47 Company Market Share Analysis
48 Orsted A/S: Company Snapshot
49 Orsted A/S: SWOT Analysis
50 Orsted A/S: Geographic Presence
51 Reliance Industries Ltd - (RIL) India: Company Snapshot
52 Reliance Industries Ltd - (RIL) India: SWOT Analysis
53 Reliance Industries Ltd - (RIL) India: Geographic Presence
54 Iberdrola S.A.: Company Snapshot
55 Iberdrola S.A.: SWOT Analysis
56 Iberdrola S.A.: Geographic Presence
57 Indian Oil Corporation Limited: Company Snapshot
58 Indian Oil Corporation Limited: Swot Analysis
59 Indian Oil Corporation Limited: Geographic Presence
60 Air Products & Chemicals Inc.: Company Snapshot
61 Air Products & Chemicals Inc.: SWOT Analysis
62 Air Products & Chemicals Inc.: Geographic Presence
63 AIR LIQUIDE: Company Snapshot
64 AIR LIQUIDE: SWOT Analysis
65 AIR LIQUIDE: Geographic Presence
66 Messer Group: Company Snapshot
67 Messer Group: SWOT Analysis
68 Messer Group: Geographic Presence
69 Exxon Mobil Corporation: Company Snapshot
70 Exxon Mobil Corporation: SWOT Analysis
71 Exxon Mobil Corporation: Geographic Presence
72 China National Petroleum Corporation, Inc.: Company Snapshot
73 China National Petroleum Corporation, Inc.: SWOT Analysis
74 China National Petroleum Corporation, Inc.: Geographic Presence
75 Linde plc: Company Snapshot
76 Linde plc: SWOT Analysis
77 Linde plc: Geographic Presence
78 Other Companies: Company Snapshot
79 Other Companies: SWOT Analysis
80 Other Companies: Geographic Presence
The Global Grey Hydrogen Market has been studied from the year 2019 till 2029. However, the CAGR provided in the report is from the year 2024 to 2029. The research methodology involved three stages: Desk research, Primary research, and Analysis & Output from the entire research process.

The desk research involved a robust background study which meant referring to paid and unpaid databases to understand the market dynamics; mapping contracts from press releases; identifying the key players in the market, studying their product portfolio, competition level, annual reports/SEC filings & investor presentations; and learning the demand and supply-side analysis for the Grey Hydrogen Market.

The primary research activity included telephonic conversations with more than 50 tier 1 industry consultants, distributors, and end-use product manufacturers.

Finally, based on the above thorough research process, an in-depth analysis was carried out considering the following aspects: market attractiveness, current & future market trends, market share analysis, SWOT analysis of the company and customer analytics.

Frequently Asked Questions

This FREE sample includes market data points, ranging from trend analyses to market estimates & forecasts. See for yourself.
Or view our licence options:
Tailor made solutions just for you
80% of our clients seek made-to-order reports. How do you want us to tailor yours?
OUR CLIENTS


