This report was recently updated on August 11 2025 with the latest and most recent
market numbers
Global High Strength Aluminum Alloys Market Size, Trends & Analysis - Forecasts to 2026 By Product (Wrought and Cast), By Strength (High-Strength and Ultra-High Strength), By End-User (Aerospace & Defense, Automotive & Transportation, Marine, and Others), By Region (North America, Asia Pacific, Europe, Latin America, Middle East & Africa); End-User Landscape, Company Market Share Analysis, and Competitor Analysis
The global high strength aluminum alloys market is projected to grow from USD 37.94 billion in 2020 to USD 55.54 billion by 2026 at a CAGR of 7.9% between 2021 and 2026. The growing preference for lighter-weight components in the automotive industry is anticipated to accelerate the product penetration. The demand for lightweight components has been driven by the increasing regulatory requirements by governing bodies linked to fuel efficiency and emissions among OEMs. Furthermore, the growing demand for aluminum alloys as a steel substitute in premium vehicles and buses is expected to propel the consumer base ahead during the forecast period.
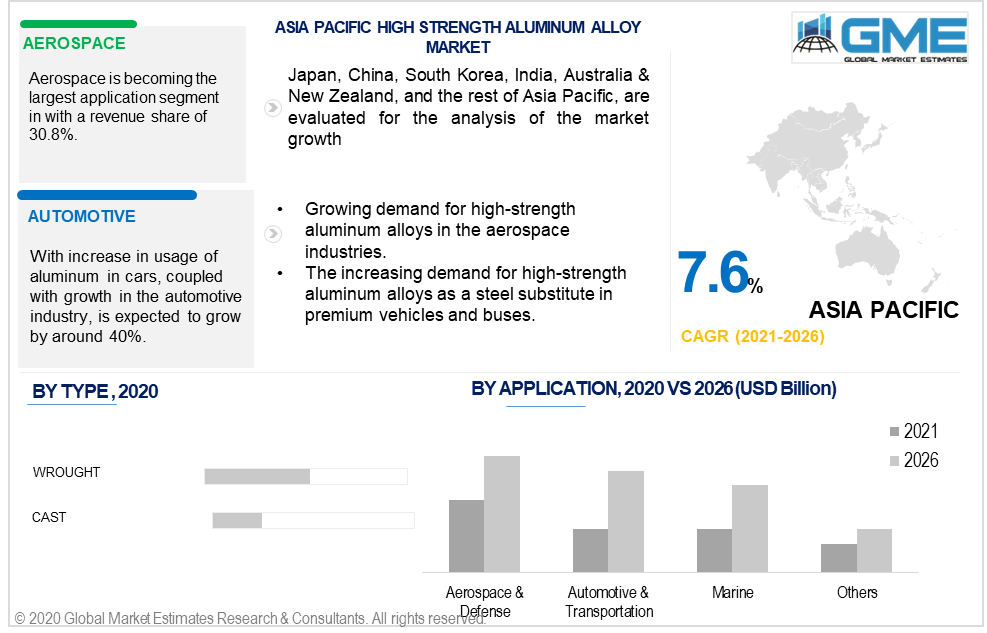
The market is divided into two segments: wrought and cast alloy. Wrought aluminum has exceptional mechanical qualities and may be fashioned into a variety of conventional and custom shapes. The alloy is subsequently smelted and formed into billets or big slabs. Afterward, the substance is molded by rolling, hammering, or compression.
When compared to wrought aluminum, cast aluminum has a higher amount of alloying elements. Due to the difficulties in eradicating casting imperfections, cast aluminum has a lower tensile strength than wrought aluminum. Bauxite is used to make cast aluminum alloy. This naturally produced material seems to be the only ore used in commercial aluminum extraction and yields 15-20 percent aluminum. Because of their poor tensile strength, cast aluminum alloys are rarely employed for structural components.
Compared to cast alloys, wrought aluminum alloys have greater mechanical qualities, such as better surface finishes, and are easier to manufacture and form.
Based on the strength, the market is segmented into high-strength and ultra-high-strength segments. Pure aluminum has a low compressive strength. However, alloying elements such as manganese, silicon, copper, and magnesium can be added to to boost its strength and generate the final material with qualities suitable to certain purposes. The high-strength segment is envisaged to grow at a faster rate than the ultra-high-strength aluminum alloy owing to the growing demand from the automotive industry.
On the other hand, the ultra-high-strength segment is expected to hold a greater share of the market than the high-strength segment.
By end-user, the market is categorized into automotive & transportation, aerospace & defense, and marine among others. Among the aforementioned end-users, one of the essential industries that drive economic growth is the automotive and transportation industry. The increased demand for automobiles has increased transportation-related emissions, and stakeholders in the industry are concentrating on improving vehicle performance to provide sustainable and environmentally-friendly transportation. The main focus is on increasing fuel efficiency while lowering pollution. Because it takes less energy to propel a lighter object than a heavier one, vehicle weight is an important component that directly impacts emissions and fuel economy.
APAC is the leading region in the market owing to the expanding material applicability in the automotive end-use industry. The European market is envisaged to grow much more quickly than any of the regions during the forecast period. High-strength aluminum alloys have been used in the steering wheel, engine parts, pistons, powertrain, front and back transversal frameworks, and many other purposes in the automotive and aerospace sectors.
Rio Tinto P.L.C., Norsk Hydro A.S.A., Hindalco Industries Limited, Alcoa Inc., United Company (UC) Rusal, Aluminium Bahrain B.S.C., Aluminum Corporation of China Ltd., Century Aluminum Company, China Hongqiao Group Ltd., and Aleris, among others are the major players in the market.
Please note: This is not an exhaustive list of companies profiled in the report.
Chapter 1 Methodology
1.1 Market scope & definitions
1.2 Estimates & forecast calculation
1.3 Historical data overview and validation
1.4 Data sources
1.4.1 Secondary
1.4.2 Primary
Chapter 2 Report Outlook
2.1 High Strength Aluminium Alloys Industry overview, 2019-2026
2.1.1 Industry overview
2.1.2 Product overview
2.1.3 Strength overview
2.1.4 End-User overview
2.1.5 Regional overview
Chapter 3 High Strength Aluminium Alloys Market Trends
3.1 Market segmentation
3.2 Industry background, 2019-2026
3.3 Market key trends
3.3.1 Positive trends
3.3.2 Industry challenges
3.4 Prospective growth scenario
3.5 COVID-19 influence over industry growth
3.6 Porter’s analysis
3.7 PESTEL analysis
3.8 Value chain & supply chain analysis
3.9 Regulatory framework
3.9.1 North America
3.9.2 Europe
3.9.3 APAC
3.9.4 LATAM
3.9.5 MEA
3.10 Technology overview
3.11 Market share analysis, 2020
3.11.1 Company positioning overview, 2020
Chapter 4 High Strength Aluminium Alloys Market, By Product
4.1 Product Outlook
4.2 Wrought
4.2.1 Market size, By region, 2019-2026 (USD Million)
4.3 Cast
4.3.1 Market size, By region, 2019-2026 (USD Million)
Chapter 5 High Strength Aluminium Alloys Market, By Strength
5.1 Strength Outlook
5.2 High-Strength
5.2.1 Market size, By region, 2019-2026 (USD Million)
5.3 Ultra-High-Strength
5.3.1 Market size, By region, 2019-2026 (USD Million)
Chapter 6 High Strength Aluminium Alloys Market, By End-User
6.1 End-User Outlook
6.2 Aerospace & Defence
6.2.1 Market size, By region, 2019-2026 (USD Million)
6.3 Automotive & Transportation
6.3.1 Market size, By region, 2019-2026 (USD Million)
6.4 Marine
6.4.1 Market size, By region, 2019-2026 (USD Million)
6.5 Others
6.5.1 Market size, By region, 2019-2026 (USD Million)
Chapter 7 High Strength Aluminium Alloys Market, By Region
7.1 Regional outlook
7.2 North America
7.2.1 Market size, By country 2019-2026 (USD Million)
7.2.2 Market size, By Product, 2019-2026 (USD Million)
7.2.3 Market size, By Strength, 2019-2026 (USD Million)
7.2.4 Market size, By End-User, 2019-2026 (USD Million)
7.2.5 U.S.
7.2.5.1 Market size, By Product, 2019-2026 (USD Million)
7.2.5.2 Market size, By Strength, 2019-2026 (USD Million)
7.2.5.3 Market size, By End-User, 2019-2026 (USD Million)
7.2.6 Canada
7.2.6.1 Market size, By Product, 2019-2026 (USD Million)
7.2.6.2 Market size, By Strength, 2019-2026 (USD Million)
7.2.6.3 Market size, By End-User, 2019-2026 (USD Million)
7.2.7 Mexico
7.2.7.1 Market size, By Product, 2019-2026 (USD Million)
7.2.7.2 Market size, By Strength, 2019-2026 (USD Million)
7.2.7.3 Market size, By End-User, 2019-2026 (USD Million)
7.3 Europe
7.3.1 Market size, By Country 2019-2026 (USD Million)
7.3.2 Market size, By Product, 2019-2026 (USD Million)
7.3.3 Market size, By Strength, 2019-2026 (USD Million)
7.3.4 Market size, By End-User, 2019-2026 (USD Million)
7.3.5 Germany
7.2.5.1 Market size, By Product, 2019-2026 (USD Million)
7.2.5.2 Market size, By Strength, 2019-2026 (USD Million)
7.2.5.3 Market size, By End-User, 2019-2026 (USD Million)
7.3.6 Spain
7.3.6.1 Market size, By Product, 2019-2026 (USD Million)
7.3.6.2 Market size, By Strength, 2019-2026 (USD Million)
7.3.6.3 Market size, By End-User, 2019-2026 (USD Million)
7.3.7 France
7.3.7.1 Market size, By Product, 2019-2026 (USD Million)
7.3.7.2 Market size, By Strength, 2019-2026 (USD Million)
7.3.7.3 Market size, By End-User, 2019-2026 (USD Million)
7.3.8 Italy
7.3.8.1 Market size, By Product, 2019-2026 (USD Million)
7.3.8.2 Market size, By Strength, 2019-2026 (USD Million)
7.3.8.3 Market size, By End-User, 2019-2026 (USD Million)
7.4 Asia Pacific
7.4.1 Market size, By Country 2019-2026 (USD Million)
7.4.2 Market size, By Product, 2019-2026 (USD Million)
7.4.3 Market size, By Strength, 2019-2026 (USD Million)
7.4.4 Market size, By End-User, 2019-2026 (USD Million)
7.4.5 China
7.4.5.1 Market size, By Product, 2019-2026 (USD Million)
7.4.5.2 Market size, By Strength, 2019-2026 (USD Million)
7.4.5.3 Market size, By End-User, 2019-2026 (USD Million)
7.4.6 India
7.4.6.1 Market size, By Product, 2019-2026 (USD Million)
7.4.6.2 Market size, By Strength, 2019-2026 (USD Million)
7.4.6.3 Market size, By End-User, 2019-2026 (USD Million)
7.4.7 Malaysia
7.4.7.1 Market size, By Product, 2019-2026 (USD Million)
7.4.7.2 Market size, By Strength, 2019-2026 (USD Million)
7.4.7.3 Market size, By End-User, 2019-2026 (USD Million)
7.4.8 Australia
7.4.8.1 Market size, By Product, 2019-2026 (USD Million)
7.4.8.2 Market size, By Strength, 2019-2026 (USD Million)
7.4.8.3 Market size, By End-User, 2019-2026 (USD Million)
7.4.9 South Korea
7.4.9.1 Market size, By Product, 2019-2026 (USD Million)
7.4.9.2 Market size, By Strength, 2019-2026 (USD Million)
7.4.9.3 Market size, By End-User, 2019-2026 (USD Million)
7.5 Central & South America
7.5.1 Market size, By Country 2019-2026 (USD Million)
7.5.2 Market size, By Product, 2019-2026 (USD Million)
7.5.3 Market size, By Strength, 2019-2026 (USD Million)
7.5.4 Market size, By End-User, 2019-2026 (USD Million)
7.5.5 Brazil
7.5.5.1 Market size, By Product, 2019-2026 (USD Million)
7.5.5.2 Market size, By Strength, 2019-2026 (USD Million)
7.5.5.3 Market size, By End-User, 2019-2026 (USD Million)
7.5.6 Argentina
7.5.6.1 Market size, By Product, 2019-2026 (USD Million)
7.5.6.2 Market size, By Strength, 2019-2026 (USD Million)
7.5.6.3 Market size, By End-User, 2019-2026 (USD Million)
7.6 MEA
7.6.1 Market size, By Country 2019-2026 (USD Million)
7.6.2 Market size, By Product, 2019-2026 (USD Million)
7.6.3 Market size, By Strength, 2019-2026 (USD Million)
7.6.4 Market size, By End-User, 2019-2026 (USD Million)
7.6.5 Saudi Arabia
7.6.5.1 Market size, By Product, 2019-2026 (USD Million)
7.6.5.2 Market size, By Strength, 2019-2026 (USD Million)
7.6.5.3 Market size, By End-User, 2019-2026 (USD Million)
7.6.6 UAE
7.6.6.1 Market size, By Product, 2019-2026 (USD Million)
7.6.6.2 Market size, By Strength, 2019-2026 (USD Million)
7.6.6.3 Market size, By End-User, 2019-2026 (USD Million)
7.6.7 South Africa
7.6.7.1 Market size, By Product, 2019-2026 (USD Million)
7.6.7.2 Market size, By Strength, 2019-2026 (USD Million)
7.6.7.3 Market size, By End-User, 2019-2026 (USD Million)
Chapter 8 Company Landscape
8.1 Competitive analysis, 2020
8.2 Rio Tinto P.L.C.
8.2.1 Company overview
8.2.2 Financial analysis
8.2.3 Strategic positioning
8.2.4 Infographic analysis
8.3 Aluminium Bahrain B.S.C
8.3.1 Company overview
8.3.2 Financial analysis
8.3.3 Strategic positioning
8.3.4 Infographic analysis
8.4 Norsk Hydro A.S.A.
8.4.1 Company overview
8.4.2 Financial analysis
8.4.3 Strategic positioning
8.4.4 Infographic analysis
8.5 Hindalco Industries Limited
8.5.1 Company overview
8.5.2 Financial analysis
8.5.3 Strategic positioning
8.5.4 Infographic analysis
8.6 Alcoa Inc.
8.6.1 Company overview
8.6.2 Financial analysis
8.6.3 Strategic positioning
8.6.4 Infographic analysis
8.7 United Company (UC) Rusal
8.7.1 Company overview
8.7.2 Financial analysis
8.7.3 Strategic positioning
8.7.4 Infographic analysis
8.8 Norsk Hydro ASA
8.8.1 Company overview
8.8.2 Financial analysis
8.8.3 Strategic positioning
8.8.4 Infographic analysis
8.9 Aluminum Corporation of China Ltd.
8.9.1 Company overview
8.9.2 Financial analysis
8.9.3 Strategic positioning
8.9.4 Infographic analysis
8.10 Century Aluminum Company
8.10.1 Company overview
8.10.2 Financial analysis
8.10.3 Strategic positioning
8.10.4 Infographic analysis
8.11 China Hongqiao Group Ltd.
8.11.1 Company overview
8.11.2 Financial analysis
8.11.3 Strategic positioning
8.11.4 Infographic analysis
8.12 Aleris
8.12.1 Company overview
8.12.2 Financial analysis
8.12.3 Strategic positioning
8.12.4 Infographic analysis
8.13 Emirates Global Aluminium PJSC
8.13.1 Company overview
8.13.2 Financial analysis
8.13.3 Strategic positioning
8.13.4 Infographic analysis
8.14 Federal-Mogul Corporation
8.14.1 Company overview
8.14.2 Financial analysis
8.14.3 Strategic positioning
8.14.4 Infographic analysis
The Global High Strength Aluminum Alloys Market has been studied from the year 2019 till 2026. However, the CAGR provided in the report is from the year 2021 to 2026. The research methodology involved three stages: Desk research, Primary research, and Analysis & Output from the entire research process.

The desk research involved a robust background study which meant referring to paid and unpaid databases to understand the market dynamics; mapping contracts from press releases; identifying the key players in the market, studying their product portfolio, competition level, annual reports/SEC filings & investor presentations; and learning the demand and supply-side analysis for the High Strength Aluminum Alloys Market.

The primary research activity included telephonic conversations with more than 50 tier 1 industry consultants, distributors, and end-use product manufacturers.

Finally, based on the above thorough research process, an in-depth analysis was carried out considering the following aspects: market attractiveness, current & future market trends, market share analysis, SWOT analysis of the company and customer analytics.

Frequently Asked Questions

This FREE sample includes market data points, ranging from trend analyses to market estimates & forecasts. See for yourself.
Or view our licence options:
Tailor made solutions just for you
80% of our clients seek made-to-order reports. How do you want us to tailor yours?
OUR CLIENTS


