This report was recently updated on August 27 2025 with the latest and most recent
market numbers
Global In-Ovo Sexing Technology Market Size, Trends & Analysis - Forecasts to 2029 By Technology (Automated Machine Learning, Spectral Imaging, and Molecular Techniques), By End User (Hatcheries and Poultry Farms), and By Region (North America, Asia Pacific, Central and South America, Europe, and Middle East and Africa), Competitive Landscape, Company Market Share Analysis, and End User Analysis
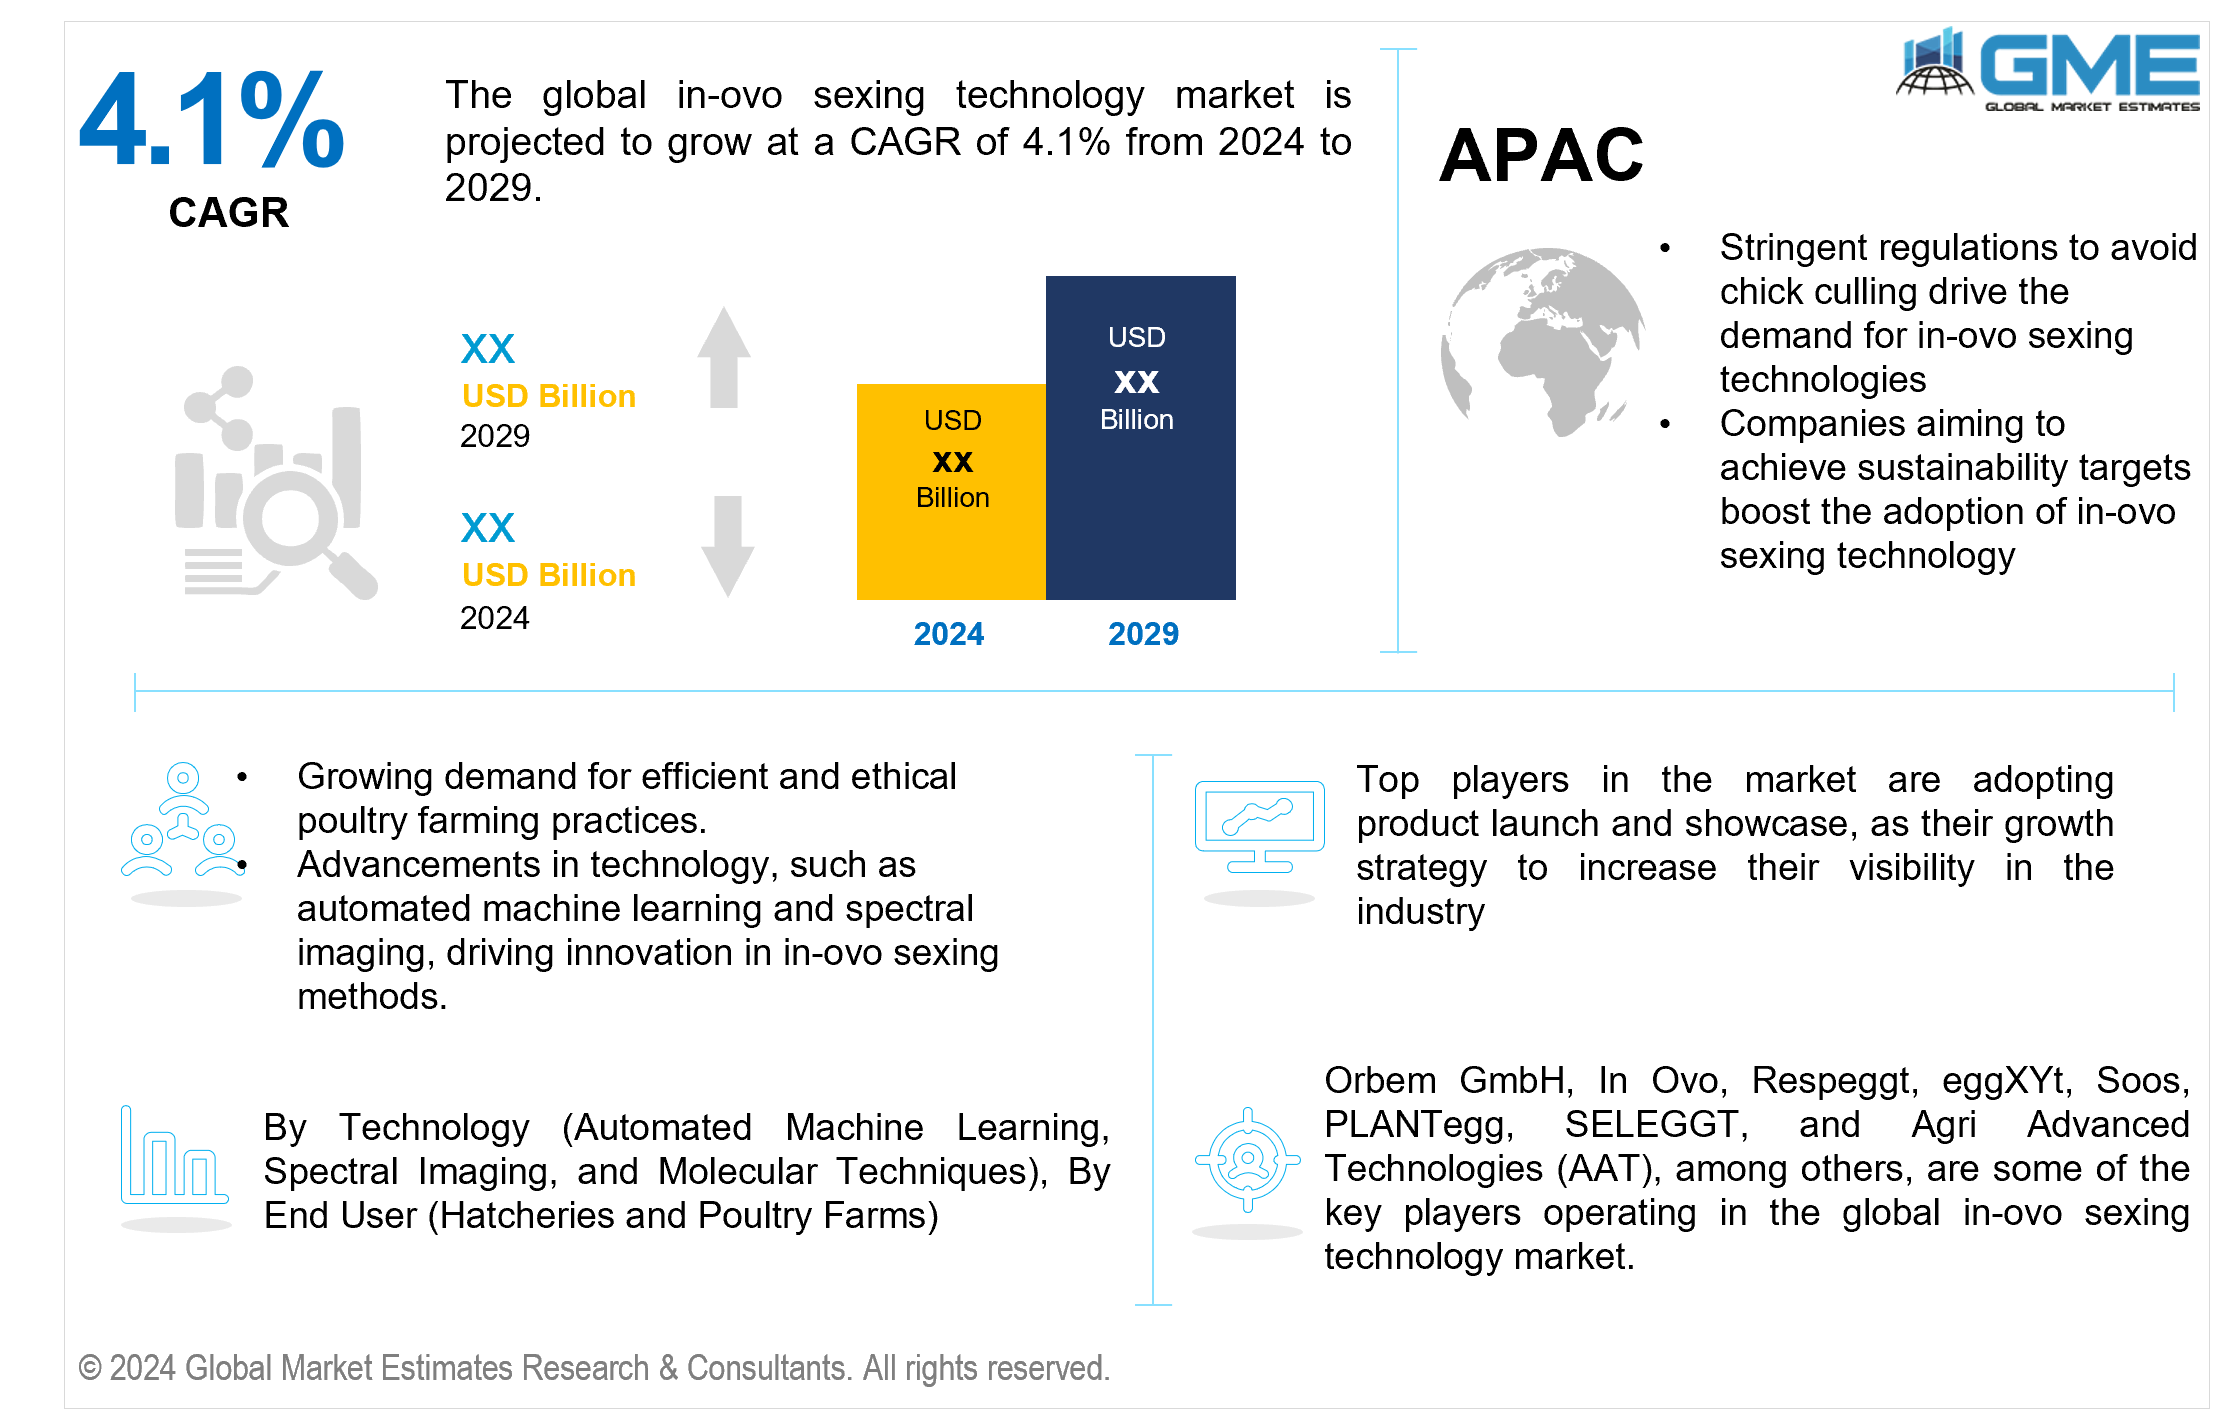
The global in-ovo sexing technology market is projected to grow at a CAGR of 4.1% from 2024 to 2029.
The global market for in-ovo sexing technology is expanding significantly due to the growing need for sustainable and productive chicken farming. The demand for poultry goods, especially chicken meat and eggs, is rising in tandem with the world's population growth. The technology known as in-ovo sexing provides a novel approach to improving the productivity of chicken farming by allowing male and female eggs to be distinguished and separated prior to hatching. By doing away with the necessity to hatch male chicks, which are normally slaughtered in conventional chicken farming methods, this resolves ethical issues and encourages the adoption of more sustainable practices. Each year, approximately 300 million male chicks in the U.S. were culled almost immediately after hatching by the egg and meat industries.
Furthermore, technological developments are essential to driving the business ahead. Utilizing state-of-the-art methods, including spectroscopy, molecular biology, and imaging technologies, in-ovo sexing technology establishes the embryo's gender early in the incubation process. This enhances productivity and fits well with the larger movement of applying smart farming techniques and precision agriculture. The accuracy and speed of sex determination are further improved by integrating artificial intelligence and machine learning, which increases the technology's dependability for large-scale poultry operations. In addition, the agribusiness and poultry sectors are increasingly focusing on ethical issues and animal welfare. As male chicks are less helpful in producing eggs and have less potential for growing into meat, culling them is a standard procedure in traditional chicken husbandry. By eliminating the necessity for culling, in-ovo sexing technology allays this worry and reflects changing customer expectations for the moral and human treatment of animals. This feature not only reacts to regulatory actions increasing animal welfare standards but also reflects consumer behavior's shifting dynamics. The financial benefits of in-ovo sexing technology also impact the market growth. Poultry farmers can save money on feed, labor, and resource usage overall by avoiding the requirement to hatch and then cull male chicks. This economic gain facilitates the use of in-ovo sexing technology by poultry farmers. Furthermore, the technology makes planning and managing chicken flocks easier, improving operational effectiveness and optimizing resource use..
In-ovo sexing technologies cater to the specific needs of hatcheries and poultry farms, offering advanced tools for gender determination in poultry embryos. The integration of these technologies empowers both hatcheries and poultry farms to optimize their operations, make informed breeding decisions, and contribute to the overall efficiency and sustainability of the poultry industry.
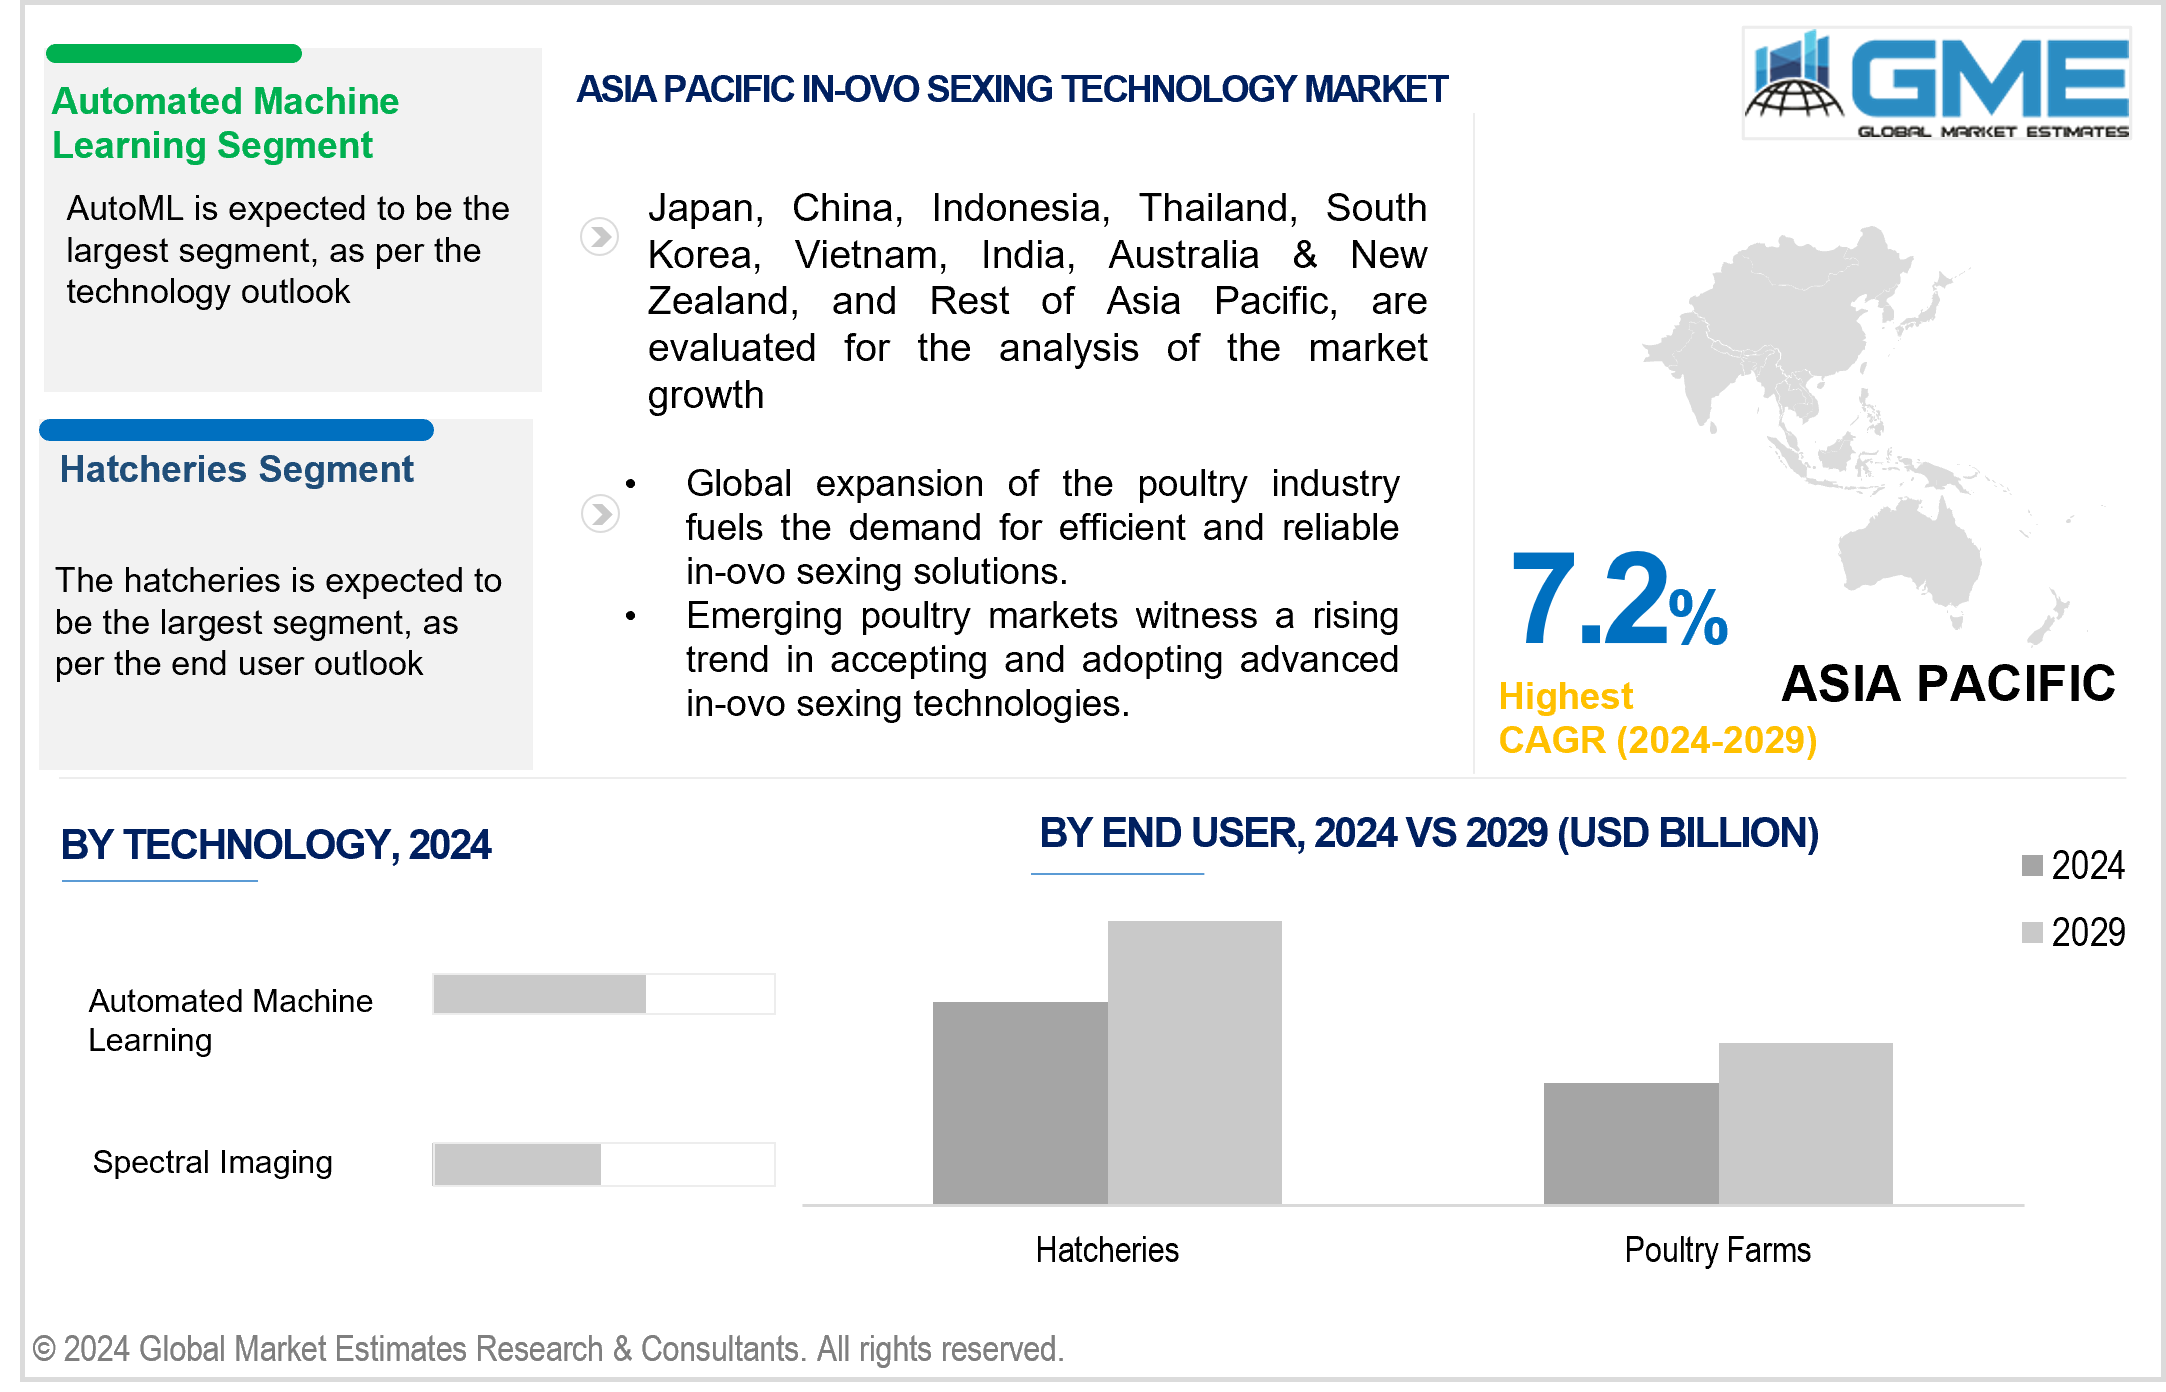
However, the hatcheries segment is expected to hold the largest share of the market over the forecast period. In hatcheries, in-ovo sexing technologies significantly streamline the poultry production process. Automated machine learning, for instance, assists hatcheries in automating the analysis of embryonic characteristics to determine the gender of eggs. This not only accelerates the sexing process but also enhances accuracy. By capturing unique spectral signatures, spectral imaging allows hatcheries to perform non-invasive sex determination, ensuring the selection of desired genders for optimal breeding strategies. Molecular techniques employed in hatcheries provide a genetic-level understanding of the embryos, contributing to precise gender identification. Overall, these technologies empower hatcheries to improve operational efficiency, reduce costs, and make informed decisions in poultry breeding.
The molecular techniques segment is expected to grow the fastest in the global in-ovo sexing technology market during the forecast period. Molecular techniques involve the analysis of genetic material, such as DNA, to determine specific traits or characteristics. In in-ovo sexing, molecular techniques are applied to examine the genetic composition of the embryos. This may involve identifying specific genes or genetic markers associated with gender. Polymerase chain reaction (PCR) and other molecular biology tools are commonly used in this context to amplify and analyze DNA, providing accurate information about the sex of the developing embryos.
The automated machine learning (AutoML) segment is anticipated to dominate the global in-ovo sexing technology market over the forecast period. Automated machine learning (AutoML) is a technology that enables machines to automatically build and optimize machine learning models with minimal human intervention. In the context of in-ovo sexing technology, AutoML is utilized to analyze and interpret data related to embryonic characteristics. Machine learning algorithms are trained to recognize patterns indicative of gender, contributing to the automation and accuracy of the sex-determination process. Considering the trend of rising awareness about advanced ML technology for gender diagnosis and increasing demand from farmers to avoid chick culling, this segment is expected to be the largest segment in the market.
North America is poised to emerge as the largest region in the global in-ovo sexing technology market. The presence of major players and innovators in the biotechnology and agriculture sectors in North America further accelerates the adoption of in-ovo sexing technologies. The region's robust research and development ecosystem fosters continuous advancements and the introduction of novel applications within the In-ovo sexing technology space. Furthermore, regulatory support and favorable policies related to animal welfare and sustainable agriculture in North America create an encouraging environment for the implementation of technologies that enhance breeding practices while aligning with ethical considerations.
Asia Pacific is expected to witness rapid growth in the global in-ovo sexing technology market during the forecast period. This growth is attributed to the increased awareness and adoption of advanced technologies in poultry farming practices, coupled with a rising emphasis on efficient and sustainable hatchery operations. Additionally, the growing demand for poultry products in the Asia Pacific region has led to a heightened focus on optimizing poultry production processes, including the implementation of in-ovo sexing technology. As a result, Asia Pacific is expected to witness substantial advancements and increased usage of in-ovo sexing technology in the forecast period.
Orbem GmbH, In Ovo, Respeggt, eggXYt, Soos, PLANTegg, SELEGGT, and Agri Advanced Technologies (AAT), among others, are some of the key players operating in the global in-ovo sexing technology market.
Please note: This is not an exhaustive list of companies profiled in the report.
In March 2023, Hendrix Genetics, the global leader in multi-species breeding and genetics, and Orbem, a prominent deep-tech imaging and AI technology company, announced the successful deployment of Orbem’s Genus Focus system in the Hendrix Genetics laying hen hatchery in Mûr-de-Bretagne, France. The Genus Focus, an MRI-based high-throughput non-invasive solution for in-ovo sexing of poultry eggs of any breed, was launched successfully.
In October 2023, Orbem GmbH secured GBP30 million in a Series A funding round. The funds will be utilized to advance the development of its artificial intelligence (AI)-powered MRI technology designed for sexing male layer chicks.
1 STRATEGIC INSIGHTS ON NEW REVENUE POCKETS
1.1 Strategic Opportunity & Attractiveness Analysis
1.1.1 Hot Revenue Pockets
1.1.2 Market Attractiveness Score
1.1.3 Revenue Impacting Opportunity
1.1.4 High Growing Region/Country
1.1.5 Competitor Analysis
1.1.6 Consumer Analysis
1.2 Global Market Estimates' View
1.3 Strategic Insights across Business Functions
1.3.1 For Chief Executive Officers
1.3.2 For Chief Marketing Officers
1.3.3 For Chief Strategy Officers
1.4 Evaluate the Potential of your Existing Business Lines vs. New Lines to Enter Into
2 TECHNOLOGICAL TRENDS
2.1 Technological Adoption Rate
2.2 Current Trend Impact Analysis
2.3 Future Trend Impact Analysis
3 GLOBAL MARKET OUTLOOK
3.1 Market Pyramid Analysis
3.1.1 Introduction
3.1.2 Adjacent Market Opportunities
3.1.3 Ancillary Market Opportunities
3.2 Demand Side Analysis
3.2.1 Market Drivers: Impact Analysis
3.2.2 Market Restraints: Impact Analysis
3.2.3 Market Opportunities: Impact Analysis
3.2.4 Market Challenges: Impact Analysis
3.3 Supply Side Analysis
3.3.1 Porter’s Five Forces Analysis
3.3.1.1 Threat of New Entrants
3.3.1.2 Threat of New Substitutes
3.3.1.3 Bargaining Power of Suppliers
3.3.1.4 Bargaining Power of Buyers
3.3.1.5 Intensity of Competitive Rivalry
3.3.2 SWOT Analysis; By Factor (Political & Legal, Economic, and Technological)
3.3.2.1 Political Landscape
3.3.2.2 Economic Landscape
3.3.2.3 Social Landscape
3.3.2.4 Technology Landscape
3.3.3 Value Chain Analysis
3.3.4 Trend Analysis
3.3.5 Gap Analysis
3.3.6 Cost Analysis
4 GLOBAL PLASTIC CREDIT MARKET, BY CREDIT TYPE
4.1 Introduction
4.2 Plastic Credit Market: Credit Type Scope Key Takeaways
4.3 Revenue Growth Analysis, 2023 & 2029
4.4 Recycling Credits
4.4.1 Recycling Credits Market Estimates and Forecast, 2021-2029 (USD Million)
4.5 Collection Credits
4.5.1 Collection Credits Market Estimates and Forecast, 2021-2029 (USD Million)
4.6 Upcycling Credits
4.6.1 Upcycling Credits Market Estimates and Forecast, 2021-2029 (USD Million)
4.7 Circular Economy Credits
4.7.1 Circular Economy Credits Market Estimates and Forecast, 2021-2029 (USD Million)
5 GLOBAL PLASTIC CREDIT MARKET, BY END USER
5.1 Introduction
5.2 Plastic Credit Market: End User Scope Key Takeaways
5.3 Revenue Growth Analysis, 2023 & 2029
5.4 Consumer Goods
5.4.1 Consumer Goods Market Estimates and Forecast, 2021-2029 (USD Million)
5.5 Packaging
5.5.1 Packaging Market Estimates and Forecast, 2021-2029 (USD Million)
5.6 Automotive
5.6.1 Automotive Market Estimates and Forecast, 2021-2029 (USD Million)
5.7 Electronics
5.7.1 Electronics Market Estimates and Forecast, 2021-2029 (USD Million)
5.8 Construction
5.8.1 Construction Market Estimates and Forecast, 2021-2029 (USD Million)
6 GLOBAL PLASTIC CREDIT MARKET, BY REGION
6.1 Introduction
6.2 North America Plastic Credit Market Estimates and Forecast, 2021-2029 (USD Million)
6.2.1 By Credit Type
6.2.2 By End User
6.2.3 By Country
6.2.3.1 U.S. Plastic Credit Market Estimates and Forecast, 2021-2029 (USD Million)
6.2.3.1.1 By Credit Type
6.2.3.1.2 By End User
6.2.3.2 Canada Plastic Credit Market Estimates and Forecast, 2021-2029 (USD Million)
6.2.3.2.1 By Credit Type
6.2.3.2.2 By End User
6.2.3.3 Mexico Plastic Credit Market Estimates and Forecast, 2021-2029 (USD Million)
6.2.3.3.1 By Credit Type
6.2.3.3.2 By End User
6.3 Europe Plastic Credit Market Estimates and Forecast, 2021-2029 (USD Million)
6.3.1 By Credit Type
6.3.2 By End User
6.3.3 By Country
6.3.3.1 Germany Plastic Credit Market Estimates and Forecast, 2021-2029 (USD Million)
6.3.3.1.1 By Credit Type
6.3.3.1.2 By End User
6.3.3.2 U.K. Plastic Credit Market Estimates and Forecast, 2021-2029 (USD Million)
6.3.3.2.1 By Credit Type
6.3.3.2.2 By End User
6.3.3.3 France Plastic Credit Market Estimates and Forecast, 2021-2029 (USD Million)
6.3.3.3.1 By Credit Type
6.3.3.3.2 By End User
6.3.3.4 Italy Plastic Credit Market Estimates and Forecast, 2021-2029 (USD Million)
6.3.3.4.1 By Credit Type
6.3.3.4.2 By End User
6.3.3.5 Spain Plastic Credit Market Estimates and Forecast, 2021-2029 (USD Million)
6.3.3.5.1 By Credit Type
6.3.3.5.2 By End User
6.3.3.6 Netherlands Plastic Credit Market Estimates and Forecast, 2021-2029 (USD Million)
6.3.3.6.1 By Credit Type
6.3.3.6.2 By End User
6.3.3.7 Rest of Europe Plastic Credit Market Estimates and Forecast, 2021-2029 (USD Million)
6.3.3.6.1 By Credit Type
6.3.3.6.2 By End User
6.4 Asia Pacific Plastic Credit Market Estimates and Forecast, 2021-2029 (USD Million)
6.4.1 By Credit Type
6.4.2 By End User
6.4.3 By Country
6.4.3.1 China Plastic Credit Market Estimates and Forecast, 2021-2029 (USD Million)
6.4.3.1.1 By Credit Type
6.4.3.1.2 By End User
6.4.3.2 Japan Plastic Credit Market Estimates and Forecast, 2021-2029 (USD Million)
6.4.3.2.1 By Credit Type
6.4.3.2.2 By End User
6.4.3.3 India Plastic Credit Market Estimates and Forecast, 2021-2029 (USD Million)
6.4.3.3.1 By Credit Type
6.4.3.3.2 By End User
6.4.3.4 South Korea Plastic Credit Market Estimates and Forecast, 2021-2029 (USD Million)
6.4.3.4.1 By Credit Type
6.4.3.4.2 By End User
6.4.3.5 Singapore Plastic Credit Market Estimates and Forecast, 2021-2029 (USD Million)
6.4.3.5.1 By Credit Type
6.4.3.5.2 By End User
6.4.3.6 Malaysia Plastic Credit Market Estimates and Forecast, 2021-2029 (USD Million)
6.4.3.6.1 By Credit Type
6.4.3.6.2 By End User
6.4.3.7 Thailand Plastic Credit Market Estimates and Forecast, 2021-2029 (USD Million)
6.4.3.6.1 By Credit Type
6.4.3.6.2 By End User
6.4.3.8 Indonesia Plastic Credit Market Estimates and Forecast, 2021-2029 (USD Million)
6.4.3.7.1 By Credit Type
6.4.3.7.2 By End User
6.4.3.9 Vietnam Plastic Credit Market Estimates and Forecast, 2021-2029 (USD Million)
6.4.3.8.1 By Credit Type
6.4.3.8.2 By End User
6.4.3.10 Taiwan Plastic Credit Market Estimates and Forecast, 2021-2029 (USD Million)
6.4.3.10.1 By Credit Type
6.4.3.10.2 By End User
6.4.3.11 Rest of Asia Pacific Plastic Credit Market Estimates and Forecast, 2021-2029 (USD Million)
6.4.3.11.1 By Credit Type
6.4.3.11.2 By End User
6.5 Middle East and Africa Plastic Credit Market Estimates and Forecast, 2021-2029 (USD Million)
6.5.1 By Credit Type
6.5.2 By End User
6.5.3 By Country
6.5.3.1 Saudi Arabia Plastic Credit Market Estimates and Forecast, 2021-2029 (USD Million)
6.5.3.1.1 By Credit Type
6.5.3.1.2 By End User
6.5.3.2 U.A.E. Plastic Credit Market Estimates and Forecast, 2021-2029 (USD Million)
6.5.3.2.1 By Credit Type
6.5.3.2.2 By End User
6.5.3.3 Israel Plastic Credit Market Estimates and Forecast, 2021-2029 (USD Million)
6.5.3.3.1 By Credit Type
6.5.3.3.2 By End User
6.5.3.4 South Africa Plastic Credit Market Estimates and Forecast, 2021-2029 (USD Million)
6.5.3.4.1 By Credit Type
6.5.3.4.2 By End User
6.5.3.5 Rest of Middle East and Africa Plastic Credit Market Estimates and Forecast, 2021-2029 (USD Million)
6.5.3.5.1 By Credit Type
6.5.3.5.2 By End User
6.6 Central and South America Plastic Credit Market Estimates and Forecast, 2021-2029 (USD Million)
6.6.1 By Credit Type
6.6.2 By End User
6.6.3 By Country
6.6.3.1 Brazil Plastic Credit Market Estimates and Forecast, 2021-2029 (USD Million)
6.6.3.1.1 By Credit Type
6.6.3.1.2 By End User
6.6.3.2 Argentina Plastic Credit Market Estimates and Forecast, 2021-2029 (USD Million)
6.6.3.2.1 By Credit Type
6.6.3.2.2 By End User
6.6.3.3 Chile Plastic Credit Market Estimates and Forecast, 2021-2029 (USD Million)
6.6.3.3.1 By Credit Type
6.6.3.3.2 By End User
6.6.3.3 Rest of Central and South America Plastic Credit Market Estimates and Forecast, 2021-2029 (USD Million)
6.6.3.3.1 By Credit Type
6.6.3.3.2 By End User
7 COMPETITIVE LANDCAPE
7.1 Company Market Share Analysis
7.2 Four Quadrant Positioning Matrix
7.2.1 Market Leaders
7.2.2 Market Visionaries
7.2.3 Market Challengers
7.2.4 Niche Market Players
7.3 Vendor Landscape
7.3.1 North America
7.3.2 Europe
7.3.3 Asia Pacific
7.3.4 Rest of the World
7.4 Company Profiles
7.4.1 RePurpose Global
7.4.1.1 Business Description & Financial Analysis
7.4.1.2 SWOT Analysis
7.4.1.3 Products & Services Offered
7.4.1.4 Strategic Alliances between Business Partners
7.4.2 PCX
7.4.2.1 Business Description & Financial Analysis
7.4.2.2 SWOT Analysis
7.4.2.3 Products & Services Offered
7.4.2.4 Strategic Alliances between Business Partners
7.4.3 Ecoex
7.4.3.1 Business Description & Financial Analysis
7.4.3.2 SWOT Analysis
7.4.3.3 Products & Services Offered
7.4.3.4 Strategic Alliances between Business Partners
7.4.4 Empower
7.4.4.1 Business Description & Financial Analysis
7.4.4.2 SWOT Analysis
7.4.4.3 Products & Services Offered
7.4.4.4 Strategic Alliances between Business Partners
7.4.5 TONTOTON
7.4.5.1 Business Description & Financial Analysis
7.4.5.2 SWOT Analysis
7.4.5.3 Products & Services Offered
7.4.5.4 Strategic Alliances between Business Partners
7.4.6 Waste4Change
7.4.6.1 Business Description & Financial Analysis
7.4.6.2 SWOT Analysis
7.4.6.3 Products & Services Offered
7.4.6.4 Strategic Alliances between Business Partners
7.4.7 Ampliphi
7.4.7.1 Business Description & Financial Analysis
7.4.7.2 SWOT Analysis
7.4.7.3 Products & Services Offered
7.4.7.4 Strategic Alliances between Business Partners
7.4.8 GemCorp
7.4.8.1 Business Description & Financial Analysis
7.4.8.2 SWOT Analysis
7.4.8.3 Products & Services Offered
7.4.8.4 Strategic Alliances between Business Partners
7.4.9 Suzlon Energy Limited
7.4.9.1 Business Description & Financial Analysis
7.4.9.2 SWOT Analysis
7.4.9.3 Products & Services Offered
7.4.9.4 Strategic Alliances between Business Partners
7.4.10 OceanWorks
7.4.10.1 Business Description & Financial Analysis
7.4.10.2 SWOT Analysis
7.4.10.3 Products & Services Offered
7.4.10.4 Strategic Alliances between Business Partners
7.4.11 Other Companies
7.4.11.1 Business Description & Financial Analysis
7.4.11.2 SWOT Analysis
7.4.11.3 Products & Services Offered
7.4.11.4 Strategic Alliances between Business Partners
8 RESEARCH METHODOLOGY
8.1 Market Introduction
8.1.1 Market Definition
8.1.2 Market Scope & Segmentation
8.2 Information Procurement
8.2.1 Secondary Research
8.2.1.1 Purchased Databases
8.2.1.2 GMEs Internal Data Repository
8.2.1.3 Secondary Resources & Third Party Perspectives
8.2.1.4 Company Information Sources
8.2.2 Primary Research
8.2.2.1 Various Types of Respondents for Primary Interviews
8.2.2.2 Number of Interviews Conducted throughout the Research Process
8.2.2.3 Primary Stakeholders
8.2.2.4 Discussion Guide for Primary Participants
8.2.3 Expert Panels
8.2.3.1 Expert Panels Across 30+ Industry
8.2.4 Paid Local Experts
8.2.4.1 Paid Local Experts Across 30+ Industry Across each Region
8.3 Market Estimation
8.3.1 Top-Down Approach
8.3.1.1 Macro-Economic Indicators Considered
8.3.1.2 Micro-Economic Indicators Considered
8.3.2 Bottom Up Approach
8.3.2.1 Company Share Analysis Approach
8.3.2.2 Estimation of Potential Product Sales
8.4 Data Triangulation
8.4.1 Data Collection
8.4.2 Time Series, Cross Sectional & Panel Data Analysis
8.4.3 Cluster Analysis
8.5 Analysis and Output
8.5.1 Inhouse AI Based Real Time Analytics Tool
8.5.2 Output From Desk & Primary Research
8.6 Research Assumptions & Limitations
8.6.1 Research Assumptions
8.6.2 Research Limitations
LIST OF TABLES
1 Global Plastic Credit Market, By Credit Type, 2021-2029 (USD Mllion)
2 Recycling Credits Market, By Region, 2021-2029 (USD Mllion)
3 Collection Credits Market, By Region, 2021-2029 (USD Mllion)
4 Upcycling Credits Market, By Region, 2021-2029 (USD Mllion)
5 Circular Economy Credits Market, By Region, 2021-2029 (USD Mllion)
6 Global Plastic Credit Market, By End User, 2021-2029 (USD Mllion)
7 Consumer Goods Market, By Region, 2021-2029 (USD Mllion)
8 Packaging Market, By Region, 2021-2029 (USD Mllion)
9 Automotive Market, By Region, 2021-2029 (USD Mllion)
10 ELECTRONICS Market, By Region, 2021-2029 (USD Mllion)
11 CONSTRUCTION Market, By Region, 2021-2029 (USD Mllion)
12 Regional Analysis, 2021-2029 (USD Mllion)
13 North America Plastic Credit Market, By Credit Type, 2021-2029 (USD Mllion)
14 North America Plastic Credit Market, By End User, 2021-2029 (USD Mllion)
15 North America Plastic Credit Market, By COUNTRY, 2021-2029 (USD Mllion)
16 U.S. Plastic Credit Market, By Credit Type, 2021-2029 (USD Mllion)
17 U.S. Plastic Credit Market, By End User, 2021-2029 (USD Mllion)
18 Canada Plastic Credit Market, By Credit Type, 2021-2029 (USD Mllion)
19 Canada Plastic Credit Market, By End User, 2021-2029 (USD Mllion)
20 Mexico Plastic Credit Market, By Credit Type, 2021-2029 (USD Mllion)
21 Mexico Plastic Credit Market, By End User, 2021-2029 (USD Mllion)
22 Europe Plastic Credit Market, By Credit Type, 2021-2029 (USD Mllion)
23 Europe Plastic Credit Market, By End User, 2021-2029 (USD Mllion)
24 Europe Plastic Credit Market, By Country, 2021-2029 (USD Mllion)
25 Germany Plastic Credit Market, By Credit Type, 2021-2029 (USD Mllion)
26 Germany Plastic Credit Market, By End User, 2021-2029 (USD Mllion)
27 U.K. Plastic Credit Market, By Credit Type, 2021-2029 (USD Mllion)
28 U.K. Plastic Credit Market, By End User, 2021-2029 (USD Mllion)
29 France Plastic Credit Market, By Credit Type, 2021-2029 (USD Mllion)
30 France Plastic Credit Market, By End User, 2021-2029 (USD Mllion)
31 Italy Plastic Credit Market, By Credit Type, 2021-2029 (USD Mllion)
32 Italy Plastic Credit Market, By End User, 2021-2029 (USD Mllion)
33 Spain Plastic Credit Market, By Credit Type, 2021-2029 (USD Mllion)
34 Spain Plastic Credit Market, By End User, 2021-2029 (USD Mllion)
35 Netherlands Plastic Credit Market, By Credit Type, 2021-2029 (USD Mllion)
36 Netherlands Plastic Credit Market, By End User, 2021-2029 (USD Mllion)
37 Rest Of Europe Plastic Credit Market, By Credit Type, 2021-2029 (USD Mllion)
38 Rest Of Europe Plastic Credit Market, By End User, 2021-2029 (USD Mllion)
39 Asia Pacific Plastic Credit Market, By Credit Type, 2021-2029 (USD Mllion)
40 Asia Pacific Plastic Credit Market, By End User, 2021-2029 (USD Mllion)
41 Asia Pacific Plastic Credit Market, By Country, 2021-2029 (USD Mllion)
42 China Plastic Credit Market, By Credit Type, 2021-2029 (USD Mllion)
43 China Plastic Credit Market, By End User, 2021-2029 (USD Mllion)
44 Japan Plastic Credit Market, By Credit Type, 2021-2029 (USD Mllion)
45 Japan Plastic Credit Market, By End User, 2021-2029 (USD Mllion)
46 India Plastic Credit Market, By Credit Type, 2021-2029 (USD Mllion)
47 India Plastic Credit Market, By End User, 2021-2029 (USD Mllion)
48 South Korea Plastic Credit Market, By Credit Type, 2021-2029 (USD Mllion)
49 South Korea Plastic Credit Market, By End User, 2021-2029 (USD Mllion)
50 Singapore Plastic Credit Market, By Credit Type, 2021-2029 (USD Mllion)
51 Singapore Plastic Credit Market, By End User, 2021-2029 (USD Mllion)
52 Thailand Plastic Credit Market, By Credit Type, 2021-2029 (USD Mllion)
53 Thailand Plastic Credit Market, By End User, 2021-2029 (USD Mllion)
54 Malaysia Plastic Credit Market, By Credit Type, 2021-2029 (USD Mllion)
55 Malaysia Plastic Credit Market, By End User, 2021-2029 (USD Mllion)
56 Indonesia Plastic Credit Market, By Credit Type, 2021-2029 (USD Mllion)
57 Indonesia Plastic Credit Market, By End User, 2021-2029 (USD Mllion)
58 Vietnam Plastic Credit Market, By Credit Type, 2021-2029 (USD Mllion)
59 Vietnam Plastic Credit Market, By End User, 2021-2029 (USD Mllion)
60 Taiwan Plastic Credit Market, By Credit Type, 2021-2029 (USD Mllion)
61 Taiwan Plastic Credit Market, By End User, 2021-2029 (USD Mllion)
62 Rest of APAC Plastic Credit Market, By Credit Type, 2021-2029 (USD Mllion)
63 Rest of APAC Plastic Credit Market, By End User, 2021-2029 (USD Mllion)
64 Middle East and Africa Plastic Credit Market, By Credit Type, 2021-2029 (USD Mllion)
65 Middle East and Africa Plastic Credit Market, By End User, 2021-2029 (USD Mllion)
66 Middle East and Africa Plastic Credit Market, By Country, 2021-2029 (USD Mllion)
67 Saudi Arabia Plastic Credit Market, By Credit Type, 2021-2029 (USD Mllion)
68 Saudi Arabia Plastic Credit Market, By End User, 2021-2029 (USD Mllion)
69 UAE Plastic Credit Market, By Credit Type, 2021-2029 (USD Mllion)
70 UAE Plastic Credit Market, By End User, 2021-2029 (USD Mllion)
71 Israel Plastic Credit Market, By Credit Type, 2021-2029 (USD Mllion)
72 Israel Plastic Credit Market, By End User, 2021-2029 (USD Mllion)
73 South Africa Plastic Credit Market, By Credit Type, 2021-2029 (USD Mllion)
74 South Africa Plastic Credit Market, By End User, 2021-2029 (USD Mllion)
75 Rest Of Middle East and Africa Plastic Credit Market, By Credit Type, 2021-2029 (USD Mllion)
76 Rest Of Middle East and Africa Plastic Credit Market, By End User, 2021-2029 (USD Mllion)
77 Central and South America Plastic Credit Market, By Credit Type, 2021-2029 (USD Mllion)
78 Central and South America Plastic Credit Market, By End User, 2021-2029 (USD Mllion)
79 Central and South America Plastic Credit Market, By Country, 2021-2029 (USD Mllion)
80 Brazil Plastic Credit Market, By Credit Type, 2021-2029 (USD Mllion)
81 Brazil Plastic Credit Market, By End User, 2021-2029 (USD Mllion)
82 Chile Plastic Credit Market, By Credit Type, 2021-2029 (USD Mllion)
83 Chile Plastic Credit Market, By End User, 2021-2029 (USD Mllion)
84 Argentina Plastic Credit Market, By Credit Type, 2021-2029 (USD Mllion)
85 Argentina Plastic Credit Market, By End User, 2021-2029 (USD Mllion)
86 Rest Of Central and South America Plastic Credit Market, By Credit Type, 2021-2029 (USD Mllion)
87 Rest Of Central and South America Plastic Credit Market, By End User, 2021-2029 (USD Mllion)
88 RePurpose Global: Products & Services Offering
89 PCX: Products & Services Offering
90 Ecoex: Products & Services Offering
91 Empower: Products & Services Offering
92 TONTOTON: Products & Services Offering
93 WASTE4CHANGE: Products & Services Offering
94 Ampliphi : Products & Services Offering
95 GemCorp: Products & Services Offering
96 Suzlon Energy Limited, Inc: Products & Services Offering
97 Host Analytics: Products & Services Offering
98 Other Companies: Products & Services Offering
LIST OF FIGURES
1 Global Plastic Credit Market Overview
2 Global Plastic Credit Market Value From 2021-2029 (USD Mllion)
3 Global Plastic Credit Market Share, By Credit Type (2023)
4 Global Plastic Credit Market Share, By End User (2023)
5 Global Plastic Credit Market, By Region (Asia Pacific Market)
6 Technological Trends In Global Plastic Credit Market
7 Four Quadrant Competitor Positioning Matrix
8 Impact Of Macro & Micro Indicators On The Market
9 Impact Of Key Drivers On The Global Plastic Credit Market
10 Impact Of Challenges On The Global Plastic Credit Market
11 Porter’s Five Forces Analysis
12 Global Plastic Credit Market: By Credit Type Scope Key Takeaways
13 Global Plastic Credit Market, By Credit Type Segment: Revenue Growth Analysis
14 Recycling Credits Market, By Region, 2021-2029 (USD Mllion)
15 Collection Credits Market, By Region, 2021-2029 (USD Mllion)
16 Upcycling Credits Market, By Region, 2021-2029 (USD Mllion)
17 Circular Economy Credits Market, By Region, 2021-2029 (USD Mllion)
18 Global Plastic Credit Market: By End User Scope Key Takeaways
19 Global Plastic Credit Market, By End User Segment: Revenue Growth Analysis
20 Consumer Goods Market, By Region, 2021-2029 (USD Mllion)
21 Packaging Market, By Region, 2021-2029 (USD Mllion)
22 Automotive Market, By Region, 2021-2029 (USD Mllion)
23 Electronics Market, By Region, 2021-2029 (USD Mllion)
24 Construction Market, By Region, 2021-2029 (USD Mllion)
25 Regional Segment: Revenue Growth Analysis
26 Global Plastic Credit Market: Regional Analysis
27 North America Plastic Credit Market Overview
28 North America Plastic Credit Market, By Credit Type
29 North America Plastic Credit Market, By End User
30 North America Plastic Credit Market, By Country
31 U.S. Plastic Credit Market, By Credit Type
32 U.S. Plastic Credit Market, By End User
33 Canada Plastic Credit Market, By Credit Type
34 Canada Plastic Credit Market, By End User
35 Mexico Plastic Credit Market, By Credit Type
36 Mexico Plastic Credit Market, By End User
37 Four Quadrant Positioning Matrix
38 Company Market Share Analysis
39 RePurpose Global: Company Snapshot
40 RePurpose Global: SWOT Analysis
41 RePurpose Global: Geographic Presence
42 PCX: Company Snapshot
43 PCX: SWOT Analysis
44 PCX: Geographic Presence
45 Ecoex: Company Snapshot
46 Ecoex: SWOT Analysis
47 Ecoex: Geographic Presence
48 Empower: Company Snapshot
49 Empower: Swot Analysis
50 Empower: Geographic Presence
51 TONTOTON: Company Snapshot
52 TONTOTON: SWOT Analysis
53 TONTOTON: Geographic Presence
54 Waste4Change: Company Snapshot
55 Waste4Change: SWOT Analysis
56 Waste4Change: Geographic Presence
57 Ampliphi : Company Snapshot
58 Ampliphi : SWOT Analysis
59 Ampliphi : Geographic Presence
60 GemCorp: Company Snapshot
61 GemCorp: SWOT Analysis
62 GemCorp: Geographic Presence
63 Suzlon Energy Limited, Inc.: Company Snapshot
64 Suzlon Energy Limited, Inc.: SWOT Analysis
65 Suzlon Energy Limited, Inc.: Geographic Presence
66 Host Analytics: Company Snapshot
67 Host Analytics: SWOT Analysis
68 Host Analytics: Geographic Presence
69 Other Companies: Company Snapshot
70 Other Companies: SWOT Analysis
71 Other Companies: Geographic Presence
The In-Ovo Sexing Technology Market has been studied from the year 2019 till 2029. However, the CAGR provided in the report is from the year 2024 to 2029. The research methodology involved three stages: Desk research, Primary research, and Analysis & Output from the entire research process.

The desk research involved a robust background study which meant referring to paid and unpaid databases to understand the market dynamics; mapping contracts from press releases; identifying the key players in the market, studying their product portfolio, competition level, annual reports/SEC filings & investor presentations; and learning the demand and supply-side analysis for the In-Ovo Sexing Technology Market.

The primary research activity included telephonic conversations with more than 50 tier 1 industry consultants, distributors, and end-use product manufacturers.

Finally, based on the above thorough research process, an in-depth analysis was carried out considering the following aspects: market attractiveness, current & future market trends, market share analysis, SWOT analysis of the company and customer analytics.

Frequently Asked Questions

This FREE sample includes market data points, ranging from trend analyses to market estimates & forecasts. See for yourself.
Or view our licence options:
Tailor made solutions just for you
80% of our clients seek made-to-order reports. How do you want us to tailor yours?
OUR CLIENTS


