This report was recently updated on August 27 2025 with the latest and most recent
market numbers
Global Industrial Metaverse for Complex Designs Market Size, Trends & Analysis - Forecasts to 2029 By Component (Software, Hardware, and Services), By Technology (AR, VR, and MR), By Application (Product Design & Development, Virtual Prototyping, Training & Simulation, Remote Collaboration, Maintenance & Repair, Supply Chain Optimization, and Data Visualization & Analytics), By End-use (Automotive, Healthcare, Logistics & Transportation, Manufacturing, Energy and Utilities, and Others), and By Region (North America, Asia Pacific, Central & South America, Europe, and Middle East and Africa), Competitive Landscape, Company Market Share Analysis, and End User Analysis
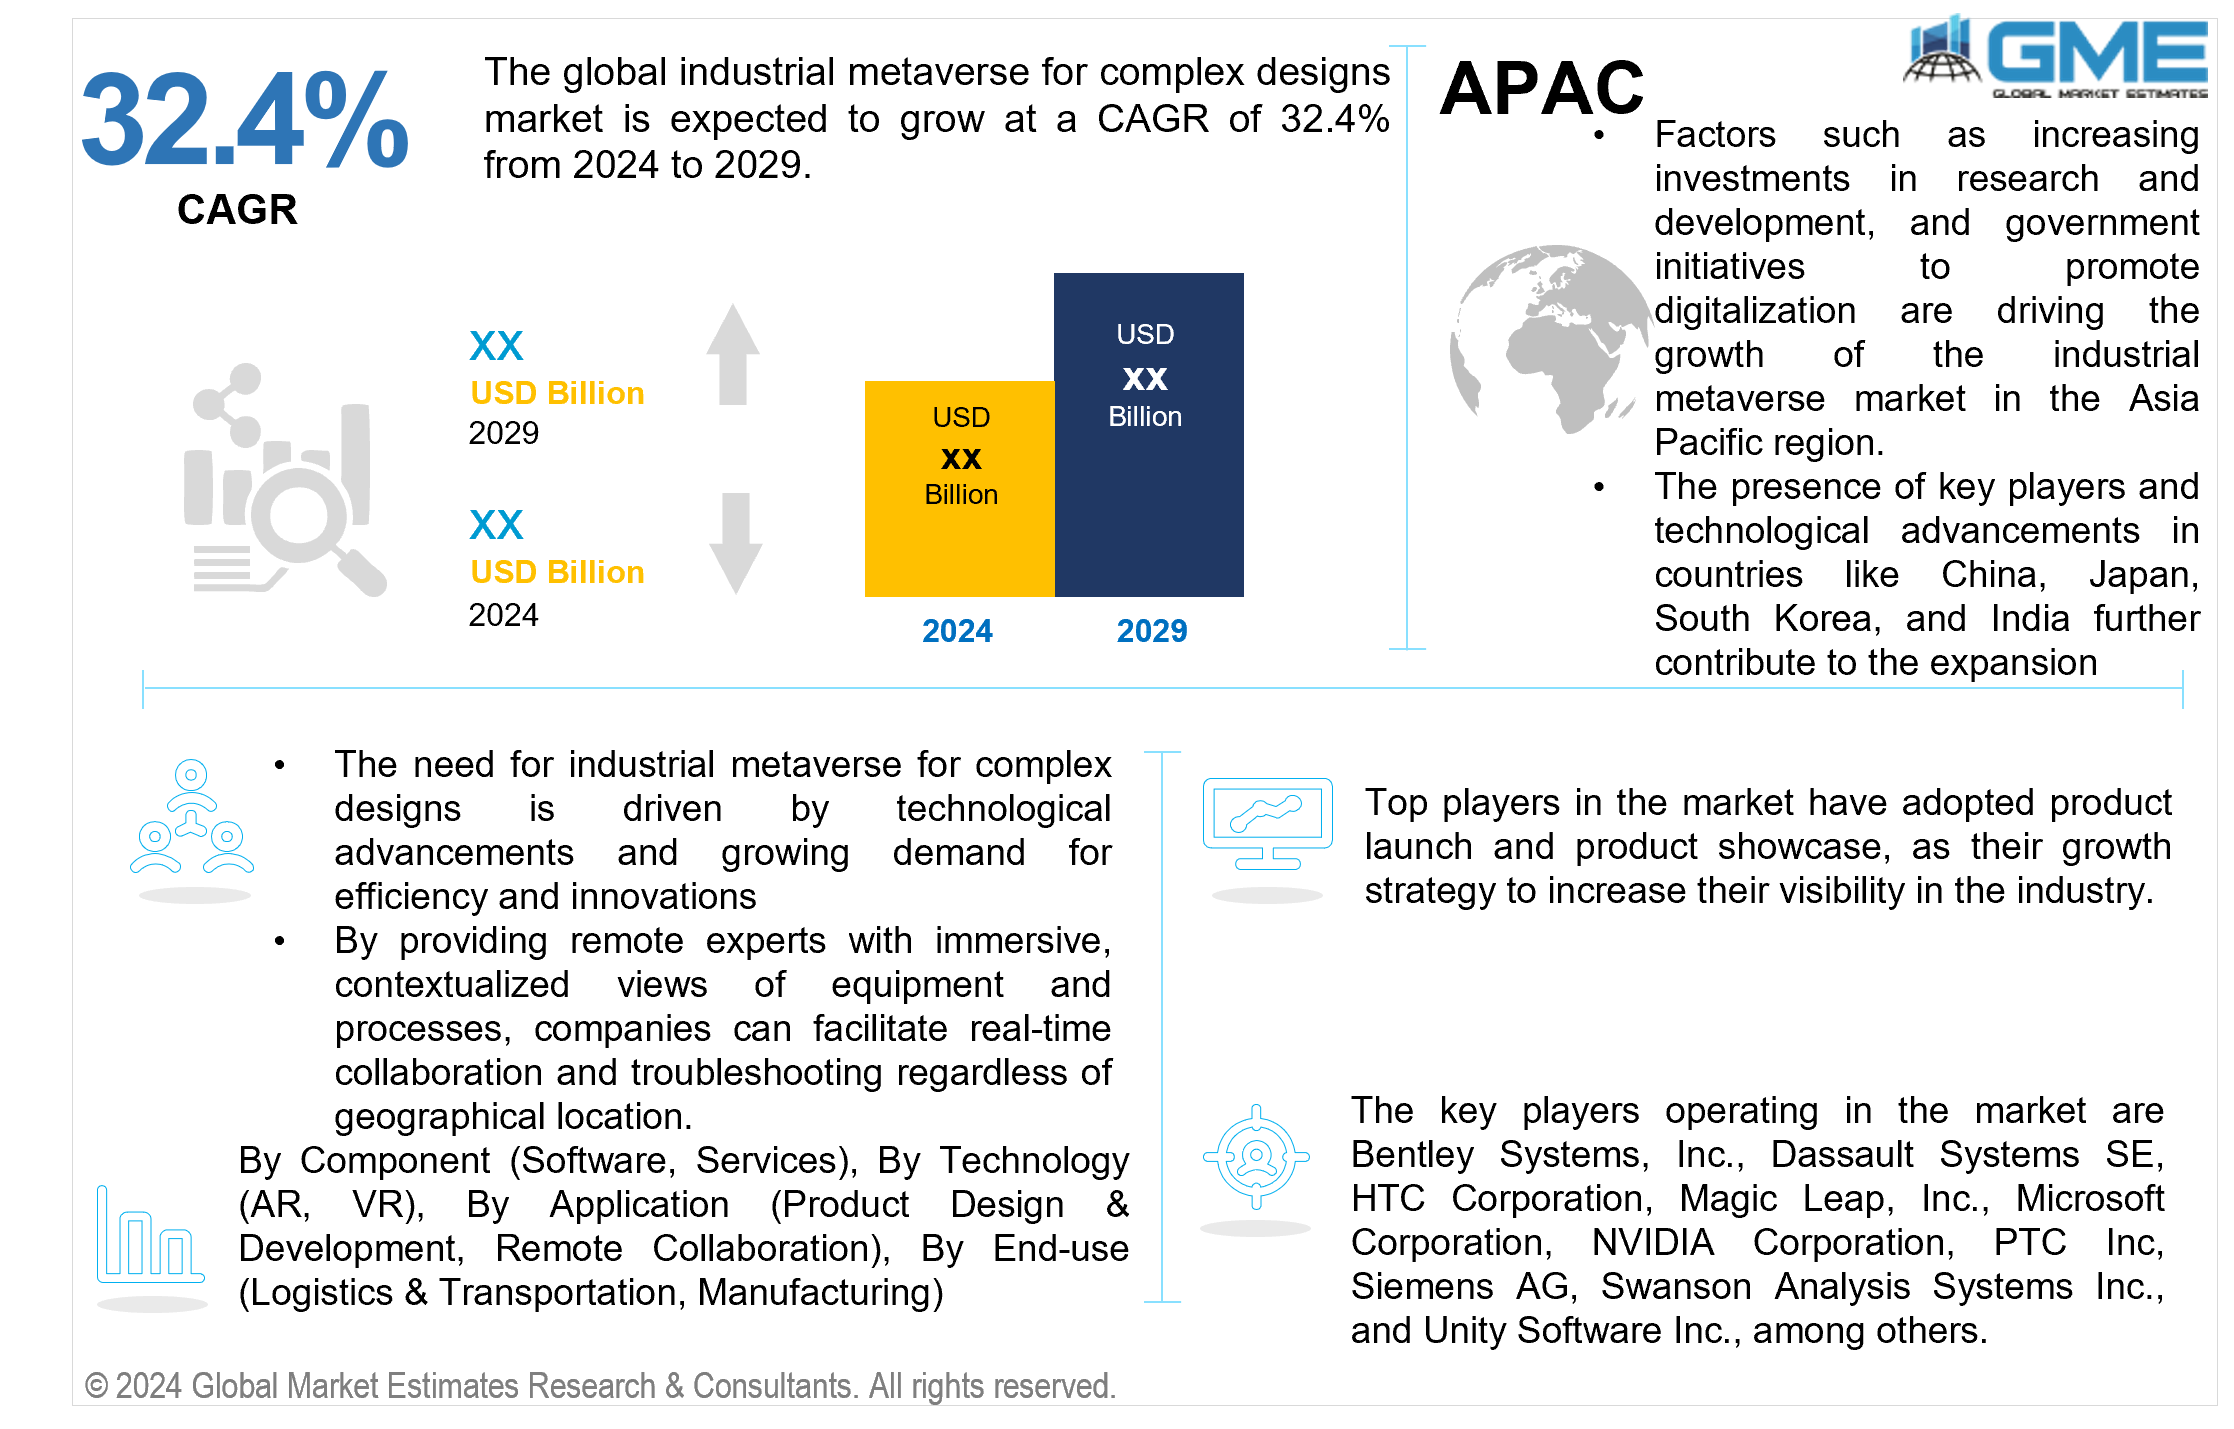
The global industrial metaverse for complex designs market is expected to grow at a CAGR of 32.4% from 2024 to 2029. The industrial metaverse is a digital realm that accurately simulates real-world assets and facilitates problem-solving and innovation in industries by merging immersive experiences with physically accurate systems.
The market is driven by technological advancements and growing demand for efficiency and innovations. The rapid evolution and integration of technologies like AI, IoT, mixed reality, and cloud computing are driving the development of the industrial metaverse. Industries are increasingly seeking innovative solutions to streamline complex design processes and reduce time-to-market for products. The industrial metaverse offers the capability to simulate and iterate designs in virtual environments, enabling companies to optimize their workflows, minimize costs, and accelerate innovation. The industrial metaverse presents an opportunity to revolutionize collaboration in complex design projects. Companies can facilitate real-time collaboration and troubleshooting regardless of geographical location by providing remote experts with immersive, contextualized views of equipment and processes.
While the potential benefits of the industrial metaverse are significant, there are barriers to adoption due to high implementation costs and the need for specialized skills.
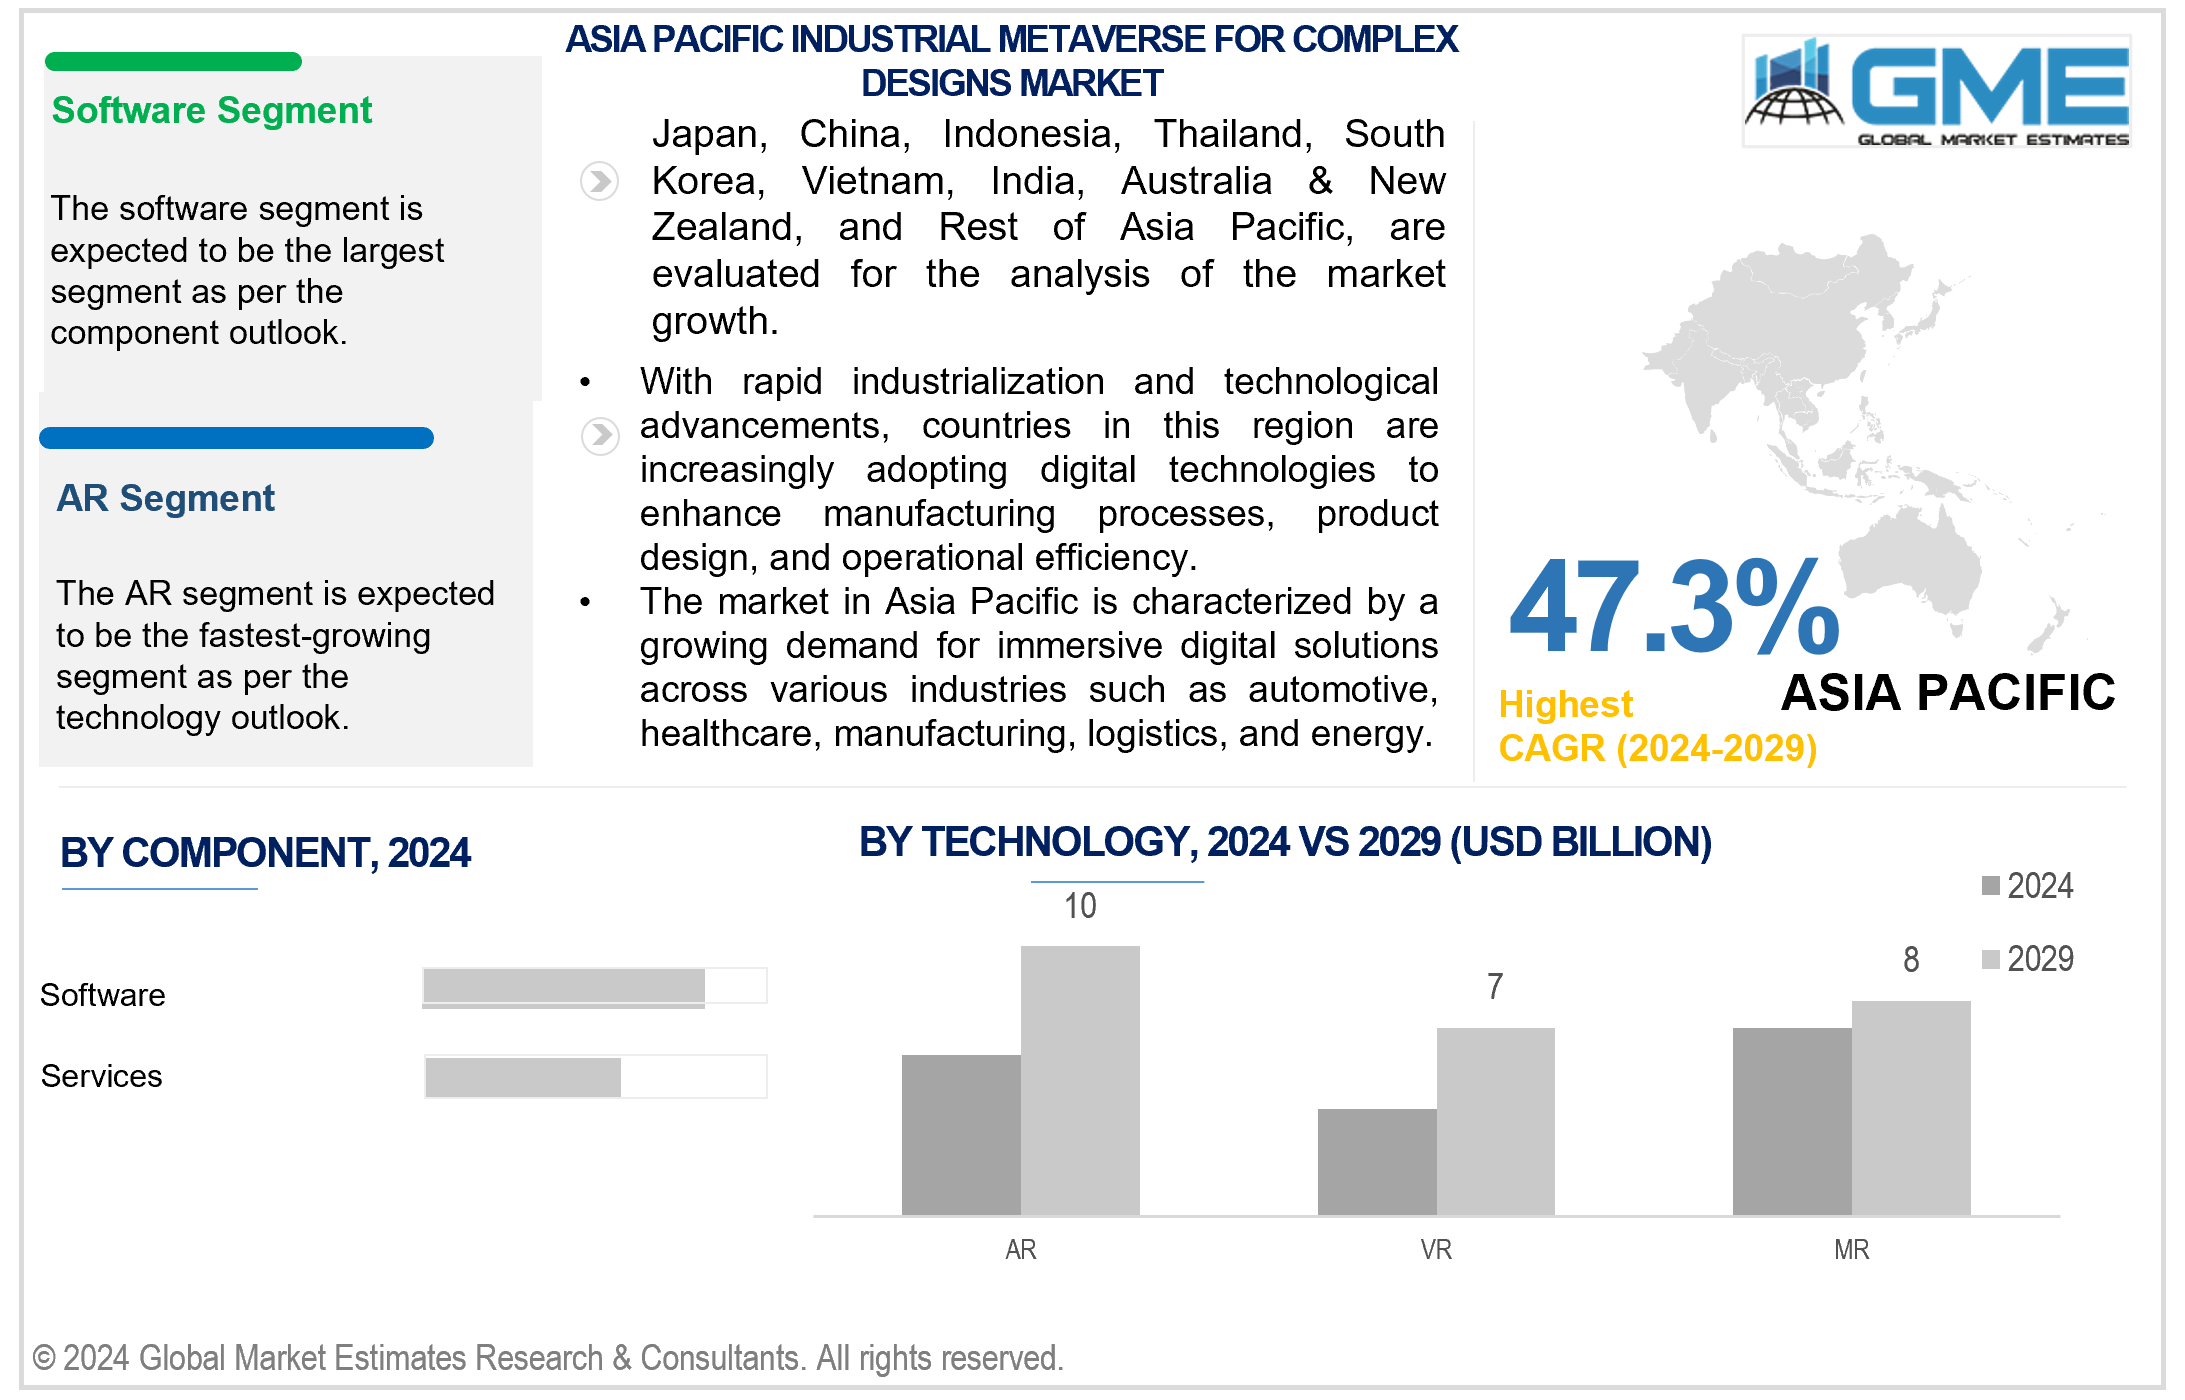
Based on component, the market is segmented into software, hardware, and services. The services segment is expected to hold the largest share of the market during the forecast period. Professional services such as consulting, integration, training, and support are crucial for implementing and managing industrial metaverse solutions. As companies increasingly embrace these technologies, the demand for services to aid in deployment and optimization is anticipated to stay elevated.
The software segment is projected to grow fastest during the forecast period. The software segment is experiencing rapid growth due to the necessity of advanced solutions like simulation software, digital twin platforms, and immersive collaboration tools for building and operating the industrial metaverse. These software offerings are fundamental components driving its expansion.
Based on technology, the market is segmented into AR, VR, and MR. The VR segment is expected to hold the largest share of the market during the forecast period. Virtual reality (VR) has become increasingly prevalent, especially in gaming and entertainment, offering immersive experiences for users. Moreover, its applications extend to industries like healthcare, enabling medical training and therapy simulations, and architecture and design, facilitating virtual walkthroughs of buildings. VR's versatility has positioned it as a valuable tool for enhanced experiences and training simulations across various sectors.
The AR segment is projected to grow fastest during the forecast period. Augmented reality (AR) is popular due to its adaptability and diverse applications across numerous sectors. From enhancing gaming experiences to aiding medical procedures, educational simulations, and improving manufacturing processes, AR's versatility makes it a valuable tool for enhancing real-world environments with digital overlays, transforming industries worldwide.
Based on application, the market is segmented into product design & development, virtual prototyping, training & simulation, remote collaboration, maintenance & repair, supply chain optimization, and data visualization & analytics. The product design & development segment is expected to hold the largest share of the market during the forecast period. Design & development is a crucial application of the industrial metaverse for complex designs market. It involves leveraging immersive digital environments to simulate and iterate complex designs before physical prototyping or implementation. This application allows design teams to collaborate in real-time, gain insights, and test multiple iterations efficiently, accelerating the product development cycle. By utilizing the industrial metaverse, companies can reduce costs associated with physical prototyping, minimize time-to-market, and enhance the overall quality of their products through iterative design processes.
The remote collaboration segment is projected to grow fastest during the forecast period. Remote collaboration in the context of the industrial metaverse for complex designs involves leveraging immersive digital environments and advanced communication technologies to facilitate collaboration among geographically dispersed teams working on complex design projects. This application allows engineers, designers, and other stakeholders to interact and collaborate in real time, regardless of their physical location. Tools within the industrial metaverse can facilitate synchronous communication, enabling team members to communicate verbally, visually, and through gestures within the virtual environment.
Based on end-use, the market is segmented into automotive, healthcare, logistics & transportation, manufacturing, energy and utilities, and others. The manufacturing segment is expected to hold the largest share of the market during the forecast period. Manufacturers utilize the industrial metaverse to optimize production processes, improve product design, and streamline operations. By leveraging immersive digital environments, manufacturers can simulate and iterate complex designs, conduct virtual prototyping, enhance training and simulation for workers, and optimize maintenance and repair activities. This ultimately leads to increased efficiency, reduced costs, and improved competitiveness in the manufacturing sector.
The logistics and transportation segment is projected to grow fastest during the forecast period. By leveraging immersive digital environments, logistics companies can better plan and execute complex logistics operations, leading to cost savings, improved customer satisfaction, and enhanced competitiveness in the market.
North America is analysed to be the largest region in the global industrial metaverse for complex designs market during the forecast period. The region's focus on innovation and digital transformation drives the demand for immersive digital environments for product design, virtual prototyping, training and simulation, remote collaboration, maintenance and repair, supply chain optimization, and data visualization and analytics.
Asia Pacific is analyzed to be the fastest-growing region in the global industrial metaverse for the complex designs market during the forecast period. With rapid industrialization and technological advancements, countries in this region are increasingly adopting digital technologies to enhance manufacturing processes, product design, and operational efficiency. The Asia Pacific market is characterized by a growing demand for immersive digital solutions across various automotive, healthcare, manufacturing, logistics, and energy industries. Factors such as increasing investments in research and development, rising demand for innovative products, and government initiatives to promote digitalization are driving the growth of the industrial metaverse market in the Asia-Pacific region. Additionally, the presence of key players and technological advancements in countries like China, Japan, South Korea, and India further contribute to the expansion of this market in Asia Pacific.
Bentley Systems, Inc., Dassault Systems SE, HTC Corporation, Magic Leap, Inc., Microsoft Corporation, NVIDIA Corporation, PTC Inc, Siemens AG, Swanson Analysis Systems Inc., and Unity Software Inc., among others are some of the key players operating in the global market.
Please note: This is not an exhaustive list of companies profiled in the report.
In June 2022, Siemens and NVIDIA announced an expansion of their partnership to enable the industrial metaverse and increase the use of AI-driven digital twin technology that will help bring industrial automation to a new level.
1 STRATEGIC INSIGHTS ON NEW REVENUE POCKETS
1.1 Strategic Opportunity & Attractiveness Analysis
1.1.1 Hot Revenue Pockets
1.1.2 Market Attractiveness Score
1.1.3 Revenue Impacting Opportunity
1.1.4 High Growing Region/Country
1.1.5 Competitor Analysis
1.1.6 Consumer Analysis
1.2 Global Market Estimates' View
1.3 Strategic Insights across Business Functions
1.3.1 For Chief Executive Officers
1.3.2 For Chief Marketing Officers
1.3.3 For Chief Strategy Officers
1.4 Evaluate the Potential of your Existing Business Lines vs. New Lines to Enter Into
2 TECHNOLOGICAL TRENDS
2.1 Technological Adoption Rate
2.2 Current Trend Impact Analysis
2.3 Future Trend Impact Analysis
3 GLOBAL MARKET OUTLOOK
3.1 Market Pyramid Analysis
3.1.1 Introduction
3.1.2 Adjacent Market Opportunities
3.1.3 Ancillary Market Opportunities
3.2 Demand Side Analysis
3.2.1 Market Drivers: Impact Analysis
3.2.2 Market Restraints: Impact Analysis
3.2.3 Market Opportunities: Impact Analysis
3.2.4 Market Challenges: Impact Analysis
3.3 Supply Side Analysis
3.3.1 Porter’s Five Forces Analysis
3.3.1.1 Threat of New Entrants
3.3.1.2 Threat of New Substitutes
3.3.1.3 Bargaining Power of Suppliers
3.3.1.4 Bargaining Power of Buyers
3.3.1.5 Intensity of Competitive Rivalry
3.3.2 SWOT Analysis; By Factor (Political & Legal, Economic, and Technological)
3.3.2.1 Political Landscape
3.3.2.2 Economic Landscape
3.3.2.3 Social Landscape
3.3.2.4 Technology Landscape
3.3.3 Value Chain Analysis
3.3.4 Trend Analysis
3.3.5 Gap Analysis
3.3.6 Cost Analysis
4 GLOBAL INDUSTRIAL METAVERSE FOR COMPLEX DESIGNS MARKET, BY COMPONENT
4.1 Introduction
4.2 Industrial Metaverse for Complex Designs Market: Component Scope Key Takeaways
4.3 Revenue Growth Analysis, 2023 & 2029
4.4 Software
4.4.1 Software Market Estimates and Forecast, 2021-2029 (USD Million)
4.5 Hardware
4.5.1 Hardware Market Estimates and Forecast, 2021-2029 (USD Million)
4.6 Services
4.6.1 Services Market Estimates and Forecast, 2021-2029 (USD Million)
5 GLOBAL INDUSTRIAL METAVERSE FOR COMPLEX DESIGNS MARKET, BY APPLICATION
5.1 Introduction
5.2 Industrial Metaverse for Complex Designs Market: Application Scope Key Takeaways
5.3 Revenue Growth Analysis, 2023 & 2029
5.4 Product Design & Development
5.4.1 Product Design & Development Market Estimates and Forecast, 2021-2029 (USD Million)
5.5 Virtual Prototyping
5.5.1 Virtual Prototyping Market Estimates and Forecast, 2021-2029 (USD Million)
5.6 Training & Simulation
5.6.1 Training & Simulation Market Estimates and Forecast, 2021-2029 (USD Million)
5.7.1 Remote Collaboration Market Estimates and Forecast, 2021-2029 (USD Million)
5.8 Maintenance & Repair
5.8.1 Maintenance & Repair Market Estimates and Forecast, 2021-2029 (USD Million)
5.9 Supply Chain Optimization
5.9.1 Supply Chain Optimization Market Estimates and Forecast, 2021-2029 (USD Million)
5.10 Data Visualization & Analytics
5.10.1 Data Visualization & Analytics Market Estimates and Forecast, 2021-2029 (USD Million)
6 GLOBAL INDUSTRIAL METAVERSE FOR COMPLEX DESIGNS MARKET, BY TECHNOLOGY
6.1 Introduction
6.2 Industrial Metaverse for Complex Designs Market: Device Type Scope Key Takeaways
6.3 Revenue Growth Analysis, 2023 & 2029
6.4 AR
6.4.1 AR Market Estimates and Forecast, 2021-2029 (USD Million)
6.5 VR
6.5.1 VR Market Estimates and Forecast, 2021-2029 (USD Million)
6.6 MR
6.6.1 MR Market Estimates and Forecast, 2021-2029 (USD Million)
7 GLOBAL INDUSTRIAL METAVERSE FOR COMPLEX DESIGNS MARKET, BY END-USE
7.1 Introduction
7.2 Industrial Metaverse for Complex Designs Market: End User Scope Key Takeaways
7.3 Revenue Growth Analysis, 2023 & 2029
7.4 Automotive
7.4.1 Automotive Market Estimates and Forecast, 2021-2029 (USD Million)
7.5 Healthcare
7.5.1 Healthcare Market Estimates and Forecast, 2021-2029 (USD Million)
7.6 Logistics & Transportation
7.6.1 Logistics & Transportation Market Estimates and Forecast, 2021-2029 (USD Million)
7.7 Manufacturing
7.7.1 Manufacturing Market Estimates and Forecast, 2021-2029 (USD Million)
7.8 Energy and Utilities
7.8.1 Energy and Utilities Market Estimates and Forecast, 2021-2029 (USD Million)
7.9 Others
7.9.1 Others Market Estimates and Forecast, 2021-2029 (USD Million)
8 GLOBAL INDUSTRIAL METAVERSE FOR COMPLEX DESIGNS MARKET, BY REGION
8.1 Introduction
8.2 North America Industrial Metaverse for Complex Designs Market Estimates and Forecast, 2021-2029 (USD Million)
8.2.1 By Component
8.2.2 By Application
8.2.3 By Technology
8.2.4 By End-use
8.2.5 By Country
8.2.5.1 U.S. Industrial Metaverse for Complex Designs Market Estimates and Forecast, 2021-2029 (USD Million)
8.2.5.1.1 By Component
8.2.5.1.2 By Application
8.2.5.1.3 By Technology
8.2.5.1.4 By End-use
8.2.5.2 Canada Industrial Metaverse for Complex Designs Market Estimates and Forecast, 2021-2029 (USD Million)
8.2.5.2.1 By Component
8.2.5.2.2 By Application
8.2.5.2.3 By Technology
8.2.5.2.4 By End-use
8.2.5.3 Mexico Industrial Metaverse for Complex Designs Market Estimates and Forecast, 2021-2029 (USD Million)
8.2.5.3.1 By Component
8.2.5.3.2 By Application
8.2.5.3.3 By Technology
8.2.5.3.4 By End-use
8.3 Europe Industrial Metaverse for Complex Designs Market Estimates and Forecast, 2021-2029 (USD Million)
8.3.1 By Component
8.3.2 By Application
8.3.3 By Technology
8.3.4 By End-use
8.3.5 By Country
8.3.5.1 Germany Industrial Metaverse for Complex Designs Market Estimates and Forecast, 2021-2029 (USD Million)
8.3.5.1.1 By Component
8.3.5.1.2 By Application
8.3.5.1.3 By Technology
8.3.5.1.4 By End-use
8.3.5.2 U.K. Industrial Metaverse for Complex Designs Market Estimates and Forecast, 2021-2029 (USD Million)
8.3.5.2.1 By Component
8.3.5.2.2 By Application
8.3.5.2.3 By Technology
8.3.5.2.4 By End-use
8.3.5.3 France Industrial Metaverse for Complex Designs Market Estimates and Forecast, 2021-2029 (USD Million)
8.3.5.3.1 By Component
8.3.5.3.2 By Application
8.3.5.3.3 By Technology
8.3.5.3.4 By End-use
8.3.5.4 Italy Industrial Metaverse for Complex Designs Market Estimates and Forecast, 2021-2029 (USD Million)
8.3.5.4.1 By Component
8.3.5.4.2 By Application
8.3.5.4.3 By Technology
8.3.5.4.4 By End-use
8.3.5.5 Spain Industrial Metaverse for Complex Designs Market Estimates and Forecast, 2021-2029 (USD Million)
8.3.5.5.1 By Component
8.3.5.5.2 By Application
8.3.5.5.3 By Technology
8.3.5.5.4 By End-use
8.3.5.6 Netherlands Industrial Metaverse for Complex Designs Market Estimates and Forecast, 2021-2029 (USD Million)
8.3.5.6.1 By Component
8.3.5.6.2 By Application
8.3.5.6.3 By Technology
8.3.5.6.4 By End-use
8.3.5.7 Rest of Europe Industrial Metaverse for Complex Designs Market Estimates and Forecast, 2021-2029 (USD Million)
8.3.5.7.1 By Component
8.3.5.7.2 By Application
8.3.5.7.3 By Technology
8.3.5.7.4 By End-use
8.4 Asia Pacific Industrial Metaverse for Complex Designs Market Estimates and Forecast, 2021-2029 (USD Million)
8.4.1 By Component
8.4.2 By Application
8.4.3 By Technology
8.4.4 By End-use
8.4.5 By Country
8.4.5.1 China Industrial Metaverse for Complex Designs Market Estimates and Forecast, 2021-2029 (USD Million)
8.4.5.1.1 By Component
8.4.5.1.2 By Application
8.4.5.1.3 By Technology
8.4.5.1.4 By End-use
8.4.5.2 Japan Industrial Metaverse for Complex Designs Market Estimates and Forecast, 2021-2029 (USD Million)
8.4.5.2.1 By Component
8.4.5.2.2 By Application
8.4.5.2.3 By Technology
8.4.5.2.4 By End-use
8.4.5.3 India Industrial Metaverse for Complex Designs Market Estimates and Forecast, 2021-2029 (USD Million)
8.4.5.3.1 By Component
8.4.5.3.2 By Application
8.4.5.3.3 By Technology
8.4.5.3.4 By End-use
8.4.5.4 South Korea Industrial Metaverse for Complex Designs Market Estimates and Forecast, 2021-2029 (USD Million)
8.4.5.4.1 By Component
8.4.5.4.2 By Application
8.4.5.4.3 By Technology
8.4.5.4.4 By End-use
8.4.5.5 Singapore Industrial Metaverse for Complex Designs Market Estimates and Forecast, 2021-2029 (USD Million)
8.4.5.5.1 By Component
8.4.5.5.2 By Application
8.4.5.5.3 By Technology
8.4.5.5.4 By End-use
8.4.5.6 Malaysia Industrial Metaverse for Complex Designs Market Estimates and Forecast, 2021-2029 (USD Million)
8.4.5.6.1 By Component
8.4.5.6.2 By Application
8.4.5.6.3 By Technology
8.4.5.6.4 By End-use
8.4.5.7 Thailand Industrial Metaverse for Complex Designs Market Estimates and Forecast, 2021-2029 (USD Million)
8.4.5.7.1 By Component
8.4.5.7.2 By Application
8.4.5.7.3 By Technology
8.4.5.7.4 By End-use
8.4.5.8 Indonesia Industrial Metaverse for Complex Designs Market Estimates and Forecast, 2021-2029 (USD Million)
8.4.5.8.1 By Component
8.4.5.8.2 By Application
8.4.5.8.3 By Technology
8.4.5.8.4 By End-use
8.4.5.9 Vietnam Industrial Metaverse for Complex Designs Market Estimates and Forecast, 2021-2029 (USD Million)
8.4.5.9.1 By Component
8.4.5.9.2 By Application
8.4.5.9.3 By Technology
8.4.5.9.4 By End-use
8.4.5.10 Taiwan Industrial Metaverse for Complex Designs Market Estimates and Forecast, 2021-2029 (USD Million)
8.4.5.10.1 By Component
8.4.5.10.2 By Application
8.4.5.10.3 By Technology
8.4.5.10.4 By End-use
8.4.5.11 Rest of Asia Pacific Industrial Metaverse for Complex Designs Market Estimates and Forecast, 2021-2029 (USD Million)
8.4.5.11.1 By Component
8.4.5.11.2 By Application
8.4.5.11.3 By Technology
8.4.5.11.4 By End-use
8.5 Middle East and Africa Industrial Metaverse for Complex Designs Market Estimates and Forecast, 2021-2029 (USD Million)
8.5.1 By Component
8.5.2 By Application
8.5.3 By Technology
8.5.4 By End-use
8.5.5 By Country
8.5.5.1 Saudi Arabia Industrial Metaverse for Complex Designs Market Estimates and Forecast, 2021-2029 (USD Million)
8.5.5.1.1 By Component
8.5.5.1.2 By Application
8.5.5.1.3 By Technology
8.5.5.1.4 By End-use
8.5.5.2 U.A.E. Industrial Metaverse for Complex Designs Market Estimates and Forecast, 2021-2029 (USD Million)
8.5.5.2.1 By Component
8.5.5.2.2 By Application
8.5.5.2.3 By Technology
8.5.5.2.4 By End-use
8.5.5.3 Israel Industrial Metaverse for Complex Designs Market Estimates and Forecast, 2021-2029 (USD Million)
8.5.4.3.1 By Component
8.5.4.3.2 By Application
8.5.4.3.3 By Technology
8.5.5.3.4 By End-use
8.5.5.4 South Africa Industrial Metaverse for Complex Designs Market Estimates and Forecast, 2021-2029 (USD Million)
8.5.5.4.1 By Component
8.5.5.4.2 By Application
8.5.5.4.3 By Technology
8.5.5.4.4 By End-use
8.5.5.5 Rest of Middle East and Africa Industrial Metaverse for Complex Designs Market Estimates and Forecast, 2021-2029 (USD Million)
8.5.5.5.1 By Component
8.5.5.5.2 By Application
8.5.5.5.2 By Technology
8.5.5.5.4 By End-use
8.6 Central & South America Industrial Metaverse for Complex Designs Market Estimates and Forecast, 2021-2029 (USD Million)
8.6.1 By Component
8.6.2 By Application
8.6.3 By Technology
8.6.4 By End-use
8.6.5 By Country
8.6.5.1 Brazil Industrial Metaverse for Complex Designs Market Estimates and Forecast, 2021-2029 (USD Million)
8.6.5.1.1 By Component
8.6.5.1.2 By Application
8.6.5.1.3 By Technology
8.6.5.1.4 By End-use
8.6.5.2 Argentina Industrial Metaverse for Complex Designs Market Estimates and Forecast, 2021-2029 (USD Million)
8.6.5.2.1 By Component
8.6.5.2.2 By Application
8.6.5.2.3 By Technology
8.6.5.2.4 By End-use
8.6.5.3 Chile Industrial Metaverse for Complex Designs Market Estimates and Forecast, 2021-2029 (USD Million)
8.6.5.3.1 By Component
8.6.5.3.2 By Application
8.6.5.3.3 By Technology
8.6.5.5.4 By End-use
8.6.5.4 Rest of Central & South America Industrial Metaverse for Complex Designs Market Estimates and Forecast, 2021-2029 (USD Million)
8.6.5.4.1 By Component
8.6.5.4.2 By Application
8.6.5.4.3 By Technology
8.6.5.4.4 By End-use
9 COMPETITIVE LANDCAPE
9.1 Company Market Share Analysis
9.2 Four Quadrant Positioning Matrix
9.2.1 Market Leaders
9.2.2 Market Visionaries
9.2.3 Market Challengers
9.2.4 Niche Market Players
9.3 Vendor Landscape
9.3.1 North America
9.3.2 Europe
9.3.3 Asia Pacific
9.3.4 Rest of the World
9.4 Company Profiles
9.4.1 Bentley Systems, Inc.
9.4.1.1 Business Description & Financial Analysis
9.4.1.2 SWOT Analysis
9.4.1.3 Products & Services Offered
9.4.1.4 Strategic Alliances between Business Partners
9.4.2 DASSAULT SYSTEMS SE
9.4.2.1 Business Description & Financial Analysis
9.4.2.2 SWOT Analysis
9.4.2.3 Products & Services Offered
9.4.2.4 Strategic Alliances between Business Partners
9.4.3 HTC Corporation
9.4.3.1 Business Description & Financial Analysis
9.4.3.2 SWOT Analysis
9.4.3.3 Products & Services Offered
9.4.3.4 Strategic Alliances between Business Partners
9.4.4 Magic Leap, Inc.
9.4.4.1 Business Description & Financial Analysis
9.4.4.2 SWOT Analysis
9.4.4.3 Products & Services Offered
9.4.4.4 Strategic Alliances between Business Partners
9.4.5 Microsoft Corporation
9.4.5.1 Business Description & Financial Analysis
9.4.5.2 SWOT Analysis
9.4.5.3 Products & Services Offered
9.4.5.4 Strategic Alliances between Business Partners
9.4.6 NVIDIA CORPORATION
9.4.6.1 Business Description & Financial Analysis
9.4.6.2 SWOT Analysis
9.4.6.3 Products & Services Offered
9.4.6.4 Strategic Alliances between Business Partners
9.4.7 PTC Inc
9.4.7.1 Business Description & Financial Analysis
9.4.7.2 SWOT Analysis
9.4.7.3 Products & Services Offered
9.4.8.4 Strategic Alliances between Business Partners
9.4.8 Siemens AG
9.4.8.1 Business Description & Financial Analysis
9.4.8.2 SWOT Analysis
9.4.8.3 Products & Services Offered
9.4.8.4 Strategic Alliances between Business Partners
9.4.9 SWANSON ANALYSIS SYSTEMS INC.
9.4.9.1 Business Description & Financial Analysis
9.4.9.2 SWOT Analysis
9.4.9.3 Products & Services Offered
9.4.9.4 Strategic Alliances between Business Partners
9.4.10 Unity Software Inc.
9.4.10.1 Business Description & Financial Analysis
9.4.10.2 SWOT Analysis
9.4.10.3 Products & Services Offered
9.4.10.4 Strategic Alliances between Business Partners
9.4.11 Other Companies
9.4.11.1 Business Description & Financial Analysis
9.4.11.2 SWOT Analysis
9.4.11.3 Products & Services Offered
9.4.11.4 Strategic Alliances between Business Partners
10 RESEARCH METHODOLOGY
10.1 Market Introduction
10.1.1 Market Definition
10.1.2 Market Scope & Segmentation
10.2 Magic Leap, Inc.mation Procurement
10.2.1 Secondary Research
10.2.1.1 Purchased Databases
10.2.1.2 GMEs Internal Data Repository
10.2.1.3 Secondary Resources & Third Party Perspectives
10.2.1.4 Company Magic Leap, Inc.mation Sources
10.2.2 Primary Research
10.2.2.1 Various Types of Respondents for Primary Interviews
10.2.2.2 Number of Interviews Conducted throughout the Research Process
10.2.2.3 Primary Stakeholders
10.2.2.4 Discussion Guide for Primary Participants
10.2.3 Expert Panels
10.2.3.1 Expert Panels Across 30+ Industry
10.2.4 Paid Local Experts
10.2.4.1 Paid Local Experts Across 30+ Industry Across each Region
10.3 Market Estimation
10.3.1 Top-Down Approach
10.3.1.1 Macro-Economic Indicators Considered
10.3.1.2 Micro-Economic Indicators Considered
10.3.2 Bottom Up Approach
10.3.2.1 Company Share Analysis Approach
10.3.2.2 Estimation of Potential Product Sales
10.4 Data Triangulation
10.4.1 Data Collection
10.4.2 Time Series, Cross Sectional & Panel Data Analysis
10.4.3 Cluster Analysis
10.5 Analysis and Output
10.5.1 Inhouse AI Based Real Time Analytics Tool
10.5.2 Output From Desk & Primary Research
10.6 Research Assumptions & Limitations
10.7.1 Research Assumptions
10.7.2 Research Limitations
LIST OF TABLES
1 Global Industrial Metaverse for Complex Designs Market, By Component, 2021-2029 (USD Million)
2 Software Market, By Region, 2021-2029 (USD Million)
3 Hardware Market, By Region, 2021-2029 (USD Million)
4 Services Market, By Region, 2021-2029 (USD Million)
5 Global Industrial Metaverse for Complex Designs Market, By Application, 2021-2029 (USD Million)
6 Product Design & Development Market, By Region, 2021-2029 (USD Million)
7 Virtual Prototyping Market, By Region, 2021-2029 (USD Million)
8 Training & Simulation Market, By Region, 2021-2029 (USD Million)
9 Remote Collaboration Market, By Region, 2021-2029 (USD Million)
10 Maintenance & Repair Market, By Region, 2021-2029 (USD Million)
11 Supply Chain Optimization Market, By Region, 2021-2029 (USD Million)
12 Data Visualization & Analytics Market, By Region, 2021-2029 (USD Million)
13 Global Industrial Metaverse for Complex Designs Market, By Technology, 2021-2029 (USD Million)
14 AR Market, By Region, 2021-2029 (USD Million)
15 VR Market, By Region, 2021-2029 (USD Million)
16 MR Market, By Region, 2021-2029 (USD Million)
17 Global Industrial Metaverse for Complex Designs Market, By End-use, 2021-2029 (USD Million)
18 Automotive Market, By Region, 2021-2029 (USD Million)
19 HEALTHCARE Market, By Region, 2021-2029 (USD Million)
20 Logistics & Transportation Market, By Region, 2021-2029 (USD Million)
21 Manufacturing Market, By Region, 2021-2029 (USD Million)
22 Energy and Utilities Market, By Region, 2021-2029 (USD Million)
23 Others Market, By Region, 2021-2029 (USD Million)
24 Regional Analysis, 2021-2029 (USD Million)
25 North America Industrial Metaverse for Complex Designs Market, By Component, 2021-2029 (USD Million)
26 North America Industrial Metaverse for Complex Designs Market, By Application, 2021-2029 (USD Million)
27 North America Industrial Metaverse for Complex Designs Market, By Technology, 2021-2029 (USD Million)
28 North America Industrial Metaverse for Complex Designs Market, By End-use, 2021-2029 (USD Million)
29 North America Industrial Metaverse for Complex Designs Market, By Country, 2021-2029 (USD Million)
30 U.S Industrial Metaverse for Complex Designs Market, By Component, 2021-2029 (USD Million)
31 U.S Industrial Metaverse for Complex Designs Market, By Application, 2021-2029 (USD Million)
32 U.S Industrial Metaverse for Complex Designs Market, By Technology, 2021-2029 (USD Million)
33 U.S Industrial Metaverse for Complex Designs Market, By End-use, 2021-2029 (USD Million)
34 Canada Industrial Metaverse for Complex Designs Market, By Component, 2021-2029 (USD Million)
35 Canada Industrial Metaverse for Complex Designs Market, By Application, 2021-2029 (USD Million)
36 Canada Industrial Metaverse for Complex Designs Market, By Technology, 2021-2029 (USD Million)
37 CANADA Industrial Metaverse for Complex Designs Market, By End-use, 2021-2029 (USD Million)
38 Mexico Industrial Metaverse for Complex Designs Market, By Component, 2021-2029 (USD Million)
39 Mexico Industrial Metaverse for Complex Designs Market, By Application, 2021-2029 (USD Million)
40 Mexico Industrial Metaverse for Complex Designs Market, By Technology, 2021-2029 (USD Million)
41 mexico Industrial Metaverse for Complex Designs Market, By End-use, 2021-2029 (USD Million)
42 Europe Industrial Metaverse for Complex Designs Market, By Component, 2021-2029 (USD Million)
43 Europe Industrial Metaverse for Complex Designs Market, By Application, 2021-2029 (USD Million)
44 Europe Industrial Metaverse for Complex Designs Market, By Technology, 2021-2029 (USD Million)
45 europe Industrial Metaverse for Complex Designs Market, By End-use, 2021-2029 (USD Million)
46 europe Industrial Metaverse for Complex Designs Market, By Country, 2021-2029 (USD Million)
47 Germany Industrial Metaverse for Complex Designs Market, By Component, 2021-2029 (USD Million)
48 Germany Industrial Metaverse for Complex Designs Market, By Application, 2021-2029 (USD Million)
49 Germany Industrial Metaverse for Complex Designs Market, By Technology, 2021-2029 (USD Million)
50 germany Industrial Metaverse for Complex Designs Market, By End-use, 2021-2029 (USD Million)
51 UK Industrial Metaverse for Complex Designs Market, By Component, 2021-2029 (USD Million)
52 UK Industrial Metaverse for Complex Designs Market, By Application, 2021-2029 (USD Million)
53 UK Industrial Metaverse for Complex Designs Market, By Technology, 2021-2029 (USD Million)
54 U.kIndustrial Metaverse for Complex Designs Market, By End-use, 2021-2029 (USD Million)
55 France Industrial Metaverse for Complex Designs Market, By Component, 2021-2029 (USD Million)
56 France Industrial Metaverse for Complex Designs Market, By Application, 2021-2029 (USD Million)
57 France Industrial Metaverse for Complex Designs Market, By Technology, 2021-2029 (USD Million)
58 france Industrial Metaverse for Complex Designs Market, By End-use, 2021-2029 (USD Million)
59 Italy Industrial Metaverse for Complex Designs Market, By Component, 2021-2029 (USD Million)
60 Italy Industrial Metaverse for Complex Designs Market, By T Preservation Technique Type, 2021-2029 (USD Million)
61 Italy Industrial Metaverse for Complex Designs Market, By Technology, 2021-2029 (USD Million)
62 italy Industrial Metaverse for Complex Designs Market, By End-use, 2021-2029 (USD Million)
63 Spain Industrial Metaverse for Complex Designs Market, By Component, 2021-2029 (USD Million)
64 Spain Industrial Metaverse for Complex Designs Market, By Application, 2021-2029 (USD Million)
65 Spain Industrial Metaverse for Complex Designs Market, By Technology, 2021-2029 (USD Million)
66 spain Industrial Metaverse for Complex Designs Market, By End-use, 2021-2029 (USD Million)
67 Rest Of Europe Industrial Metaverse for Complex Designs Market, By Component, 2021-2029 (USD Million)
68 Rest Of Europe Industrial Metaverse for Complex Designs Market, By Application, 2021-2029 (USD Million)
69 Rest of Europe Industrial Metaverse for Complex Designs Market, By Technology, 2021-2029 (USD Million)
70 REST OF EUROPE Industrial Metaverse for Complex Designs Market, By End-use, 2021-2029 (USD Million)
71 Asia Pacific Industrial Metaverse for Complex Designs Market, By Component, 2021-2029 (USD Million)
72 Asia Pacific Industrial Metaverse for Complex Designs Market, By Application, 2021-2029 (USD Million)
73 Asia Pacific Industrial Metaverse for Complex Designs Market, By Technology, 2021-2029 (USD Million)
74 asia Industrial Metaverse for Complex Designs Market, By End-use, 2021-2029 (USD Million)
75 Asia Pacific Industrial Metaverse for Complex Designs Market, By Country, 2021-2029 (USD Million)
76 China Industrial Metaverse for Complex Designs Market, By Component, 2021-2029 (USD Million)
77 China Industrial Metaverse for Complex Designs Market, By Application, 2021-2029 (USD Million)
78 China Industrial Metaverse for Complex Designs Market, By Technology, 2021-2029 (USD Million)
79 china Industrial Metaverse for Complex Designs Market, By End-use, 2021-2029 (USD Million)
80 India Industrial Metaverse for Complex Designs Market, By Component, 2021-2029 (USD Million)
81 India Industrial Metaverse for Complex Designs Market, By Application, 2021-2029 (USD Million)
82 India Industrial Metaverse for Complex Designs Market, By Technology, 2021-2029 (USD Million)
83 india Industrial Metaverse for Complex Designs Market, By End-use, 2021-2029 (USD Million)
84 Japan Industrial Metaverse for Complex Designs Market, By Component, 2021-2029 (USD Million)
85 Japan Industrial Metaverse for Complex Designs Market, By Application, 2021-2029 (USD Million)
86 Japan Industrial Metaverse for Complex Designs Market, By Technology, 2021-2029 (USD Million)
87 japan Industrial Metaverse for Complex Designs Market, By End-use, 2021-2029 (USD Million)
88 South Korea Industrial Metaverse for Complex Designs Market, By Component, 2021-2029 (USD Million)
89 South Korea Industrial Metaverse for Complex Designs Market, By Application, 2021-2029 (USD Million)
90 South Korea Industrial Metaverse for Complex Designs Market, By Technology, 2021-2029 (USD Million)
91 south korea Industrial Metaverse for Complex Designs Market, By End-use, 2021-2029 (USD Million)
92 Vietnam Industrial Metaverse for Complex Designs Market, By Component, 2021-2029 (USD Million)
93 Vietnam Industrial Metaverse for Complex Designs Market, By Application, 2021-2029 (USD Million)
94 Vietnam Industrial Metaverse for Complex Designs Market, By Technology, 2021-2029 (USD Million)
95 Vietnam Industrial Metaverse for Complex Designs Market, By End-use, 2021-2029 (USD Million)
96 Thailand Industrial Metaverse for Complex Designs Market, By Component, 2021-2029 (USD Million)
97 Thailand Industrial Metaverse for Complex Designs Market, By Application, 2021-2029 (USD Million)
98 Thailand Industrial Metaverse for Complex Designs Market, By Technology, 2021-2029 (USD Million)
99 Thailand Industrial Metaverse for Complex Designs Market, By End-use, 2021-2029 (USD Million)
100 Indonesia Industrial Metaverse for Complex Designs Market, By Component, 2021-2029 (USD Million)
101 Indonesia Industrial Metaverse for Complex Designs Market, By Application, 2021-2029 (USD Million)
102 Indonesia Industrial Metaverse for Complex Designs Market, By Technology, 2021-2029 (USD Million)
103 Indonesia Industrial Metaverse for Complex Designs Market, By End-use, 2021-2029 (USD Million)
104 Rest of Asia Pacific Industrial Metaverse for Complex Designs Market, By Component, 2021-2029 (USD Million)
105 Rest of Asia Pacific Industrial Metaverse for Complex Designs Market, By Application, 2021-2029 (USD Million)
106 Rest of Asia Pacific Industrial Metaverse for Complex Designs Market, By Technology, 2021-2029 (USD Million)
107 Rest of Asia Pacific Industrial Metaverse for Complex Designs Market, By End-use, 2021-2029 (USD Million)
108 Middle East and Africa Industrial Metaverse for Complex Designs Market, By Component, 2021-2029 (USD Million)
109 Middle East and Africa Industrial Metaverse for Complex Designs Market, By Application, 2021-2029 (USD Million)
110 Middle East and Africa Industrial Metaverse for Complex Designs Market, By Technology, 2021-2029 (USD Million)
111 MIDDLE EAST AND AFRICA Industrial Metaverse for Complex Designs Market, By End-use, 2021-2029 (USD Million)
112 Middle East and Africa Industrial Metaverse for Complex Designs Market, By Country, 2021-2029 (USD Million)
113 Saudi Arabia Industrial Metaverse for Complex Designs Market, By Component, 2021-2029 (USD Million)
114 Saudi Arabia Industrial Metaverse for Complex Designs Market, By Application, 2021-2029 (USD Million)
115 Saudi Arabia Industrial Metaverse for Complex Designs Market, By Technology, 2021-2029 (USD Million)
116 saudi arabia Industrial Metaverse for Complex Designs Market, By End-use, 2021-2029 (USD Million)
117 UAE Industrial Metaverse for Complex Designs Market, By Component, 2021-2029 (USD Million)
118 UAE Industrial Metaverse for Complex Designs Market, By Application, 2021-2029 (USD Million)
119 UAE Industrial Metaverse for Complex Designs Market, By Technology, 2021-2029 (USD Million)
120 uae Industrial Metaverse for Complex Designs Market, By End-use, 2021-2029 (USD Million)
121 Qatar Industrial Metaverse for Complex Designs Market, By Component, 2021-2029 (USD Million)
122 Qatar Industrial Metaverse for Complex Designs Market, By Application, 2021-2029 (USD Million)
123 Qatar Industrial Metaverse for Complex Designs Market, By Technology, 2021-2029 (USD Million)
124 Qatar Industrial Metaverse for Complex Designs Market, By End-use, 2021-2029 (USD Million)
125 rest of Middle East and Africa Industrial Metaverse for Complex Designs Market, By Component, 2021-2029 (USD Million)
126 rest of Middle East and Africa Industrial Metaverse for Complex Designs Market, By Application, 2021-2029 (USD Million)
127 rest of Middle East and Africa Industrial Metaverse for Complex Designs Market, By Technology, 2021-2029 (USD Million)
128 rest of Middle East and Africa Industrial Metaverse for Complex Designs Market, By End-use, 2021-2029 (USD Million)
129 Central & South America Industrial Metaverse for Complex Designs Market, By Component, 2021-2029 (USD Million)
130 Central & South America Industrial Metaverse for Complex Designs Market, By Application, 2021-2029 (USD Million)
131 Central & South America Industrial Metaverse for Complex Designs Market, By Technology, 2021-2029 (USD Million)
132 CENTRAL & SOUTH AMERICA Industrial Metaverse for Complex Designs Market, By End-use, 2021-2029 (USD Million)
133 Central & South America Industrial Metaverse for Complex Designs Market, By Country, 2021-2029 (USD Million)
134 Brazil Industrial Metaverse for Complex Designs Market, By Component, 2021-2029 (USD Million)
135 Brazil Industrial Metaverse for Complex Designs Market, By Application, 2021-2029 (USD Million)
136 Brazil Industrial Metaverse for Complex Designs Market, By Technology, 2021-2029 (USD Million)
137 brazil Industrial Metaverse for Complex Designs Market, By End-use, 2021-2029 (USD Million)
138 Argentina Industrial Metaverse for Complex Designs Market, By Component, 2021-2029 (USD Million)
139 Argentina Industrial Metaverse for Complex Designs Market, By Application, 2021-2029 (USD Million)
140 Argentina Industrial Metaverse for Complex Designs Market, By Technology, 2021-2029 (USD Million)
141 Argentina Industrial Metaverse for Complex Designs Market, By End-use, 2021-2029 (USD Million)
142 Rest of CENTRAL & SOUTH AMERICA Industrial Metaverse for Complex Designs Market, By Component, 2021-2029 (USD Million)
143 Rest of CENTRAL & SOUTH AMERICA Industrial Metaverse for Complex Designs Market, By Application, 2021-2029 (USD Million)
144 Rest of CENTRAL & SOUTH AMERICA Industrial Metaverse for Complex Designs Market, By Technology, 2021-2029 (USD Million)
145 Rest of CENTRAL & SOUTH AMERICA Industrial Metaverse for Complex Designs Market, By End-use, 2021-2029 (USD Million)
146 Bentley Systems, Inc.: Products & Services Offering
147 DASSAULT SYSTEMS SE: Products & Services Offering
148 HTC Corporation: Products & Services Offering
149 Magic Leap, Inc.: Products & Services Offering
150 Microsoft Corporation: Products & Services Offering
151 NVIDIA CORPORATION: Products & Services Offering
152 PTC Inc: Products & Services Offering
153 Siemens AG: Products & Services Offering
154 SWANSON ANALYSIS SYSTEMS INC.: Products & Services Offering
155 Unity Software Inc.: Products & Services Offering
156 Other Companies: Products & Services Offering
LIST OF FIGURES
1 Global Industrial Metaverse for Complex Designs Market Overview
2 Global Industrial Metaverse for Complex Designs Market Value From 2021-2029 (USD Million)
3 Global Industrial Metaverse for Complex Designs Market Share, By Component (2023)
4 Global Industrial Metaverse for Complex Designs Market Share, By Application (2023)
5 Global Industrial Metaverse for Complex Designs Market Share, By Technology (2023)
6 Global Industrial Metaverse for Complex Designs Market Share, By End-use (2023)
7 Global Industrial Metaverse for Complex Designs Market, By Region (Asia Pacific Market)
8 Technological Trends In Global Industrial Metaverse for Complex Designs Market
9 Four Quadrant Competitor Positioning Matrix
10 Impact Of Macro & Micro Indicators On The Market
11 Impact Of Key Drivers On The Global Industrial Metaverse for Complex Designs Market
12 Impact Of Challenges On The Global Industrial Metaverse for Complex Designs Market
13 Porter’s Five Forces Analysis
14 Global Industrial Metaverse for Complex Designs Market: By Component Scope Key Takeaways
15 Global Industrial Metaverse for Complex Designs Market, By Component Segment: Revenue Growth Analysis
16 Software Market, By Region, 2021-2029 (USD Million)
17 Hardware Market, By Region, 2021-2029 (USD Million)
18 Services Market, By Region, 2021-2029 (USD Million)
19 Global Industrial Metaverse for Complex Designs Market: By Application Scope Key Takeaways
20 Global Industrial Metaverse for Complex Designs Market, By Application Segment: Revenue Growth Analysis
21 Product Design & Development Market, By Region, 2021-2029 (USD Million)
22 Virtual Prototyping Market, By Region, 2021-2029 (USD Million)
23 Training & Simulation Market, By Region, 2021-2029 (USD Million)
24 Remote Collaboration Market, By Region, 2021-2029 (USD Million)
25 Maintenance & Repair Market, By Region, 2021-2029 (USD Million)
26 Supply Chain Optimization Market, By Region, 2021-2029 (USD Million)
27 Data Visualization & Analytics Market, By Region, 2021-2029 (USD Million)
28 Global Industrial Metaverse for Complex Designs Market: By Technology Scope Key Takeaways
29 Global Industrial Metaverse for Complex Designs Market, By Technology Segment: Revenue Growth Analysis
30 AR Market, By Region, 2021-2029 (USD Million)
31 VR Market, By Region, 2021-2029 (USD Million)
32 MR Market, By Region, 2021-2029 (USD Million)
33 Global Industrial Metaverse for Complex Designs Market: By End-use Scope Key Takeaways
34 Global Industrial Metaverse for Complex Designs Market, By End-use Segment: Revenue Growth Analysis
35 Automotive Market, By Region, 2021-2029 (USD Million)
36 Healthcare Market, By Region, 2021-2029 (USD Million)
37 Logistics & Transportation Market, By Region, 2021-2029 (USD Million)
38 Manufacturing Market, By Region, 2021-2029 (USD Million)
39 Energy and Utilities Market, By Region, 2021-2029 (USD Million)
40 Others Market, By Region, 2021-2029 (USD Million)
41 Regional Segment: Revenue Growth Analysis
42 Global Industrial Metaverse for Complex Designs Market: Regional Analysis
43 North America Industrial Metaverse for Complex Designs Market Overview
44 North America Industrial Metaverse for Complex Designs Market, By Component
45 North America Industrial Metaverse for Complex Designs Market, By Application
46 North America Industrial Metaverse for Complex Designs Market, By Technology
47 North America Industrial Metaverse for Complex Designs Market, By End-use
48 North America Industrial Metaverse for Complex Designs Market, By Country
49 U.S. Industrial Metaverse for Complex Designs Market, By Component
50 U.S. Industrial Metaverse for Complex Designs Market, By Application
51 U.S. Industrial Metaverse for Complex Designs Market, By Technology
52 U.S. Industrial Metaverse for Complex Designs Market, By End-use
53 Canada Industrial Metaverse for Complex Designs Market, By Component
54 Canada Industrial Metaverse for Complex Designs Market, By Application
55 Canada Industrial Metaverse for Complex Designs Market, By Technology
56 Canada Industrial Metaverse for Complex Designs Market, By End-use
57 Mexico Industrial Metaverse for Complex Designs Market, By Component
58 Mexico Industrial Metaverse for Complex Designs Market, By Application
59 Mexico Industrial Metaverse for Complex Designs Market, By Technology
60 Mexico Industrial Metaverse for Complex Designs Market, By End-use
61 Four Quadrant Positioning Matrix
62 Company Market Share Analysis
63 Bentley Systems, Inc.: Company Snapshot
64 Bentley Systems, Inc.: SWOT Analysis
65 Bentley Systems, Inc.: Geographic Presence
66 DASSAULT SYSTEMS SE: Company Snapshot
67 DASSAULT SYSTEMS SE: SWOT Analysis
68 DASSAULT SYSTEMS SE: Geographic Presence
69 HTC Corporation: Company Snapshot
70 HTC Corporation: SWOT Analysis
71 HTC Corporation: Geographic Presence
72 Magic Leap, Inc.: Company Snapshot
73 Magic Leap, Inc.: Swot Analysis
74 Magic Leap, Inc.: Geographic Presence
75 Microsoft Corporation: Company Snapshot
76 Microsoft Corporation: SWOT Analysis
77 Microsoft Corporation: Geographic Presence
78 NVIDIA CORPORATION: Company Snapshot
79 NVIDIA CORPORATION: SWOT Analysis
80 NVIDIA CORPORATION: Geographic Presence
81 PTC Inc: Company Snapshot
82 PTC Inc: SWOT Analysis
83 PTC Inc: Geographic Presence
84 Siemens AG: Company Snapshot
85 Siemens AG: SWOT Analysis
86 Siemens AG: Geographic Presence
87 SWANSON ANALYSIS SYSTEMS INC..: Company Snapshot
88 SWANSON ANALYSIS SYSTEMS INC..: SWOT Analysis
89 SWANSON ANALYSIS SYSTEMS INC..: Geographic Presence
90 Unity Software Inc.: Company Snapshot
91 Unity Software Inc.: SWOT Analysis
92 Unity Software Inc.: Geographic Presence
93 Other Companies: Company Snapshot
94 Other Companies: SWOT Analysis
95 Other Companies: Geographic Presence
The Global Industrial Metaverse for Complex Designs Market has been studied from the year 2019 till 2028. However, the CAGR provided in the report is from the year 2023 to 2028. The research methodology involved three stages: Desk research, Primary research, and Analysis & Output from the entire research process.

The desk research involved a robust background study which meant referring to paid and unpaid databases to understand the market dynamics; mapping contracts from press releases; identifying the key players in the market, studying their product portfolio, competition level, annual reports/SEC filings & investor presentations; and learning the demand and supply-side analysis for the Industrial Metaverse for Complex Designs Market.

The primary research activity included telephonic conversations with more than 50 tier 1 industry consultants, distributors, and end-use product manufacturers.

Finally, based on the above thorough research process, an in-depth analysis was carried out considering the following aspects: market attractiveness, current & future market trends, market share analysis, SWOT analysis of the company and customer analytics.

Frequently Asked Questions

This FREE sample includes market data points, ranging from trend analyses to market estimates & forecasts. See for yourself.
Or view our licence options:
Tailor made solutions just for you
80% of our clients seek made-to-order reports. How do you want us to tailor yours?
OUR CLIENTS


