This report was recently updated on August 8 2025 with the latest and most recent
market numbers
Global Lab Workflow Optimization Market Size, Trends & Analysis - Forecasts to 2029 By Type of Solution (Laboratory Information Management Systems (LIMS), Electronic Lab Notebooks (ELN), Laboratory Automation Systems, Scientific Data Management Systems (SDMS), Laboratory Execution Systems (LES), Inventory Management Systems, and Others), By End User (Pharmaceutical and Biotechnology Organizations, Academic and Research Institutes, Contract Research Organizations (CROs), Clinical Diagnostics Laboratories, Food and Beverage Laboratories, Environmental Testing Laboratories, and Others ), and By Region (North America, Asia Pacific, Central and South America, Europe, and Middle East and Africa), Competitive Landscape, Company Market Share Analysis, and End User Analysis
The global lab workflow optimization market is estimated to exhibit a CAGR of 6.8% from 2024 to 2029.
The primary factors propelling the market growth are the growing number of laboratory tests and the increasing outsourcing of laboratory services. As the world's population ages and grows, there is a rising demand for healthcare services, especially diagnostic testing. As a result, more laboratory tests are conducted in various healthcare settings. Furthermore, organizations and healthcare providers are putting more of an emphasis on enhancing the effectiveness and quality of healthcare delivery. Laboratory procedures should be streamlined to improve patient care overall, minimize errors, and shorten turnaround times. Lab workflow optimization solutions play a crucial role in achieving these objectives. For instance, clinical lab tests are the most often used medical benefit, with 14 billion conducted annually in the United States, according to the Managed Healthcare Executive (2023).
The increasing number of lab automation product launches and the rising demand for laboratory efficiency are expected to support the market growth. Lab automation products optimize laboratory workflows by automating laborious tasks, including sample preparation, testing, and data processing. As a result, manual intervention is greatly decreased, errors are reduced, and throughput is increased, improving lab productivity and efficiency. Additionally, contemporary lab automation products provide great flexibility and scalability, enabling laboratories to adjust to shifting workload demands and testing specifications. For instance, Accuris Instruments AutoMATE 96 of Benchmark Scientific was released in March 2023 by Scientific Laboratory Supplies. With its outstanding liquid handling capabilities, this completely automatic equipment helps to boost throughput in laboratory processes.
The growing adoption of electronic lab notebooks (ELNs) and rising research and development (R&D) activities propel market growth. Better data administration, analysis, and interpretation are made possible by sophisticated lab workflow optimization tools and technologies, which enable researchers to draw important conclusions from enormous datasets produced during R&D operations. This facilitates hypothesis testing, knowledge discovery, and well-informed decision-making, which results in innovations and discoveries in research. Furthermore, research laboratories can maintain regulatory compliance by utilizing lab workflow optimization tools, which include features like data integrity controls, audit trails, and electronic documentation. Ensuring the validity and dependability of experimental data helps innovative products and therapies get approved by regulators and submitted for approval.
Large-scale data generation in laboratories is creating an increasing demand for advanced analytics tools to handle, process, and extract knowledge from this data. Companies that provide analytics, integration, and data management solutions specifically designed for laboratory procedures have enormous development opportunities. Since AI and ML technologies can optimize procedures, predict results, and find patterns in data, they have an opportunity to transform laboratory workflows completely. In the lab workflow optimization market, companies that create AI-powered solutions for activities like image analysis, decision assistance, and predictive analytics are likely to see growth.
However, integrating new workflow optimization technologies and high maintenance cost of lab workflow optimization systems hinder market growth.
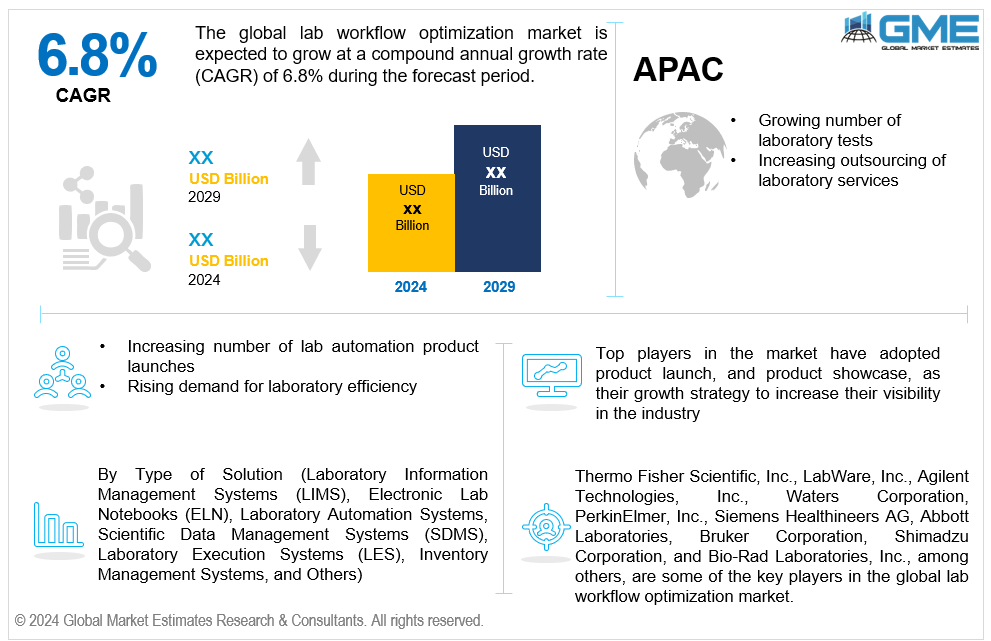
The laboratory information management systems (LIMS) segment is expected to hold the largest share of the market over the forecast period. For handling various laboratory processes, such as sample management, data management, instrument integration, quality assurance, and regulatory compliance, LIMS provide all-inclusive solutions. Due to their extensive functionality, LIMS are essential instruments for optimizing operations, meeting the complicated demands of contemporary laboratories.
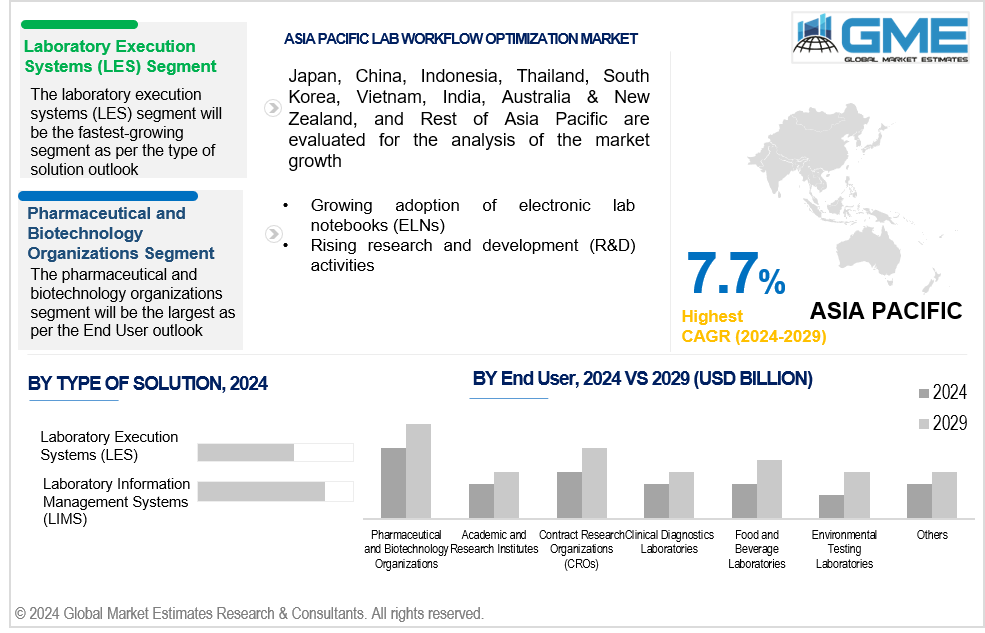
The laboratory execution systems (LES) segment is expected to be the fastest-growing segment in the market from 2024 to 2029. Laboratory execution systems include automated features that improve productivity, decrease manual error rates, and streamline laboratory procedures. The need for LES solutions is rising as labs in a variety of industries want to enhance their operations and productivity.
The pharmaceutical and biotechnology segment is expected to hold the largest share of the market over the forecast period. Adherence to stringent quality standards and regulatory norms is crucial in these highly regulated industries. This segment has the highest share since lab workflow optimization solutions are essential for guaranteeing data integrity, traceability, and compliance with legal standards like Good Manufacturing Practices (GMP) and Good Laboratory Practices (GLP).
The environmental testing segment is anticipated to be the fastest-growing segment in the market from 2024 to 2029. The capabilities of environmental testing laboratories have been greatly expanded by advances in analytical apparatus and laboratory technology. By automating workflows, enhancing data accuracy and reproducibility, and streamlining analytical procedures, lab workflow optimization solutions increase productivity and efficiency.
North America is expected to be the largest region in the global market. The laboratory ecosystem's increasing usage of cloud-based solutions is fueling the market growth in North America. Platforms for cloud-based workflow optimization facilitate data sharing, remote access, and collaboration amongst geographically separated teams, allowing smooth and effective laboratory operations.
Asia Pacific is anticipated to witness rapid growth during the forecast period. The healthcare and life sciences sectors are expanding rapidly in the Asia Pacific due to growing healthcare costs and an increase in the prevalence of chronic illnesses. This growth is propelling the demand for advanced laboratory technologies and workflow optimization solutions to improve efficiency, productivity, and patient care.
Thermo Fisher Scientific, Inc., LabWare, Inc., Agilent Technologies, Inc., Waters Corporation, PerkinElmer, Inc., Siemens Healthineers AG, Abbott Laboratories, Bruker Corporation, Shimadzu Corporation, and Bio-Rad Laboratories, Inc., among others, are some of the key players in the global lab workflow optimization market.
Please note: This is not an exhaustive list of companies profiled in the report.
In December 2023, Thermo Fisher Scientific Inc. announced the launch of the Applied Biosystem MagMAX Dx Viral/Pathogen NA Isolation Kit and the Thermo Scientific KingFishe Apex Dx, an automated nucleic acid purification instrument to simplify and automate respiratory diagnostic testing.
In March 2023, LabWare announced that machine learning and data science are going to be the foundations of their software. This idea is exclusive to the field and could render future laboratories accessible.
1 STRATEGIC INSIGHTS ON NEW REVENUE POCKETS
1.1 Strategic Opportunity & Attractiveness Analysis
1.1.1 Hot Revenue Pockets
1.1.2 Market Attractiveness Score
1.1.3 Revenue Impacting Opportunity
1.1.4 High Growing Region/Country
1.1.5 Competitor Analysis
1.1.6 Consumer Analysis
1.2 Global Market Estimates' View
1.3 Strategic Insights across Business Functions
1.3.1 For Chief Executive Officers
1.3.2 For Chief Marketing Officers
1.3.3 For Chief Strategy Officers
1.4 Evaluate the Potential of your Existing Business Lines vs. New Lines to Enter Into
2 TECHNOLOGICAL TRENDS
2.1 Technological Adoption Rate
2.2 Current Trend Impact Analysis
2.3 Future Trend Impact Analysis
3 GLOBAL MARKET OUTLOOK
3.1 Market Pyramid Analysis
3.1.1 Introduction
3.1.2 Adjacent Market Opportunities
3.1.3 Ancillary Market Opportunities
3.2 Demand Side Analysis
3.2.1 Market Drivers: Impact Analysis
3.2.2 Market Restraints: Impact Analysis
3.2.3 Market Opportunities: Impact Analysis
3.2.4 Market Challenges: Impact Analysis
3.3 Supply Side Analysis
3.3.1 Porter’s Five Forces Analysis
3.3.1.1 Threat of New Entrants
3.3.1.2 Threat of New Substitutes
3.3.1.3 Bargaining Power of Suppliers
3.3.1.4 Bargaining Power of Buyers
3.3.1.5 Intensity of Competitive Rivalry
3.3.2 SWOT Analysis; By Factor (Political & Legal, Economic, and Technological)
3.3.2.1 Political Landscape
3.3.2.2 Economic Landscape
3.3.2.3 Social Landscape
3.3.2.4 Technology Landscape
3.3.3 Value Chain Analysis
3.3.4 Trend Analysis
3.3.5 Gap Analysis
3.3.6 Cost Analysis
4 GLOBAL LAB WORKFLOW OPTIMIZATION MARKET, BY TYPE OF SOLUTION
4.1 Introduction
4.2 Lab Workflow Optimization Market: Type of Solution Scope Key Takeaways
4.3 Revenue Growth Analysis, 2023 & 2029
4.4 Laboratory Information Management Systems (LIMS)
4.4.1 Laboratory Information Management Systems (LIMS) Market Estimates and Forecast, 2021-2029 (USD Million)
4.5 Electronic Lab Notebooks (ELN)
4.5.1 Electronic Lab Notebooks (ELN) Market Estimates and Forecast, 2021-2029 (USD Million)
4.6 Laboratory Automation Systems
4.6.1 Laboratory Automation Systems Market Estimates and Forecast, 2021-2029 (USD Million)
4.7 Scientific Data Management Systems (SDMS)
4.7.1 Scientific Data Management Systems (SDMS) Market Estimates and Forecast, 2021-2029 (USD Million)
4.8 Laboratory Execution Systems (LES)
4.8.1 Laboratory Execution Systems (LES) Market Estimates and Forecast, 2021-2029 (USD Million)
4.9 Inventory Management Systems
4.9.1 Inventory Management Systems Market Estimates and Forecast, 2021-2029 (USD Million)
4.10 Others
4.10.1 Others Market Estimates and Forecast, 2021-2029 (USD Million)
5 GLOBAL LAB WORKFLOW OPTIMIZATION MARKET, BY END USER
5.1 Introduction
5.2 Lab Workflow Optimization Market: End User Scope Key Takeaways
5.3 Revenue Growth Analysis, 2023 & 2029
5.4 Pharmaceutical and Biotechnology Organizations
5.4.1 Pharmaceutical and Biotechnology Organizations Market Estimates and Forecast, 2021-2029 (USD Million)
5.5 Academic and Research Institutes
5.5.1 Academic and Research Institutes Market Estimates and Forecast, 2021-2029 (USD Million)
5.6 Contract Research Organizations (CROs)
5.6.1 Contract Research Organizations (CROs) Market Estimates and Forecast, 2021-2029 (USD Million)
5.7 Clinical Diagnostics Laboratories
5.7.1 Clinical Diagnostics Laboratories Market Estimates and Forecast, 2021-2029 (USD Million)
5.8 Food and Beverage Laboratories
5.8.1 Food and Beverage Laboratories Market Estimates and Forecast, 2021-2029 (USD Million)
5.9 Environmental Testing Laboratories
5.9.1 Environmental Testing Laboratories Market Estimates and Forecast, 2021-2029 (USD Million)
5.10 Others
5.10.1 Others Market Estimates and Forecast, 2021-2029 (USD Million)
6 GLOBAL LAB WORKFLOW OPTIMIZATION MARKET, BY REGION
6.1 Introduction
6.2 North America Lab Workflow Optimization Market Estimates and Forecast, 2021-2029 (USD Million)
6.2.1 By Type of Solution
6.2.2 By End User
6.2.3 By Country
6.2.3.1 U.S. Lab Workflow Optimization Market Estimates and Forecast, 2021-2029 (USD Million)
6.2.3.1.1 By Type of Solution
6.2.3.1.2 By End User
6.2.3.2 Canada Lab Workflow Optimization Market Estimates and Forecast, 2021-2029 (USD Million)
6.2.3.2.1 By Type of Solution
6.2.3.2.2 By End User
6.2.3.3 Mexico Lab Workflow Optimization Market Estimates and Forecast, 2021-2029 (USD Million)
6.2.3.3.1 By Type of Solution
6.2.3.3.2 By End User
6.3 Europe Lab Workflow Optimization Market Estimates and Forecast, 2021-2029 (USD Million)
6.3.1 By Type of Solution
6.3.2 By End User
6.3.3 By Country
6.3.3.1 Germany Lab Workflow Optimization Market Estimates and Forecast, 2021-2029 (USD Million)
6.3.3.1.1 By Type of Solution
6.3.3.1.2 By End User
6.3.3.2 U.K. Lab Workflow Optimization Market Estimates and Forecast, 2021-2029 (USD Million)
6.3.3.2.1 By Type of Solution
6.3.3.2.2 By End User
6.3.3.3 France Lab Workflow Optimization Market Estimates and Forecast, 2021-2029 (USD Million)
6.3.3.3.1 By Type of Solution
6.3.3.3.2 By End User
6.3.3.4 Italy Lab Workflow Optimization Market Estimates and Forecast, 2021-2029 (USD Million)
6.3.3.4.1 By Type of Solution
6.3.3.4.2 By End User
6.3.3.5 Spain Lab Workflow Optimization Market Estimates and Forecast, 2021-2029 (USD Million)
6.3.3.5.1 By Type of Solution
6.3.3.5.2 By End User
6.3.3.6 Netherlands Lab Workflow Optimization Market Estimates and Forecast, 2021-2029 (USD Million)
6.3.3.6.1 By Type of Solution
6.3.3.6.2 By End User
6.3.3.7 Rest of Europe Lab Workflow Optimization Market Estimates and Forecast, 2021-2029 (USD Million)
6.3.3.6.1 By Type of Solution
6.3.3.6.2 By End User
6.4 Asia Pacific Lab Workflow Optimization Market Estimates and Forecast, 2021-2029 (USD Million)
6.4.1 By Type of Solution
6.4.2 By End User
6.4.3 By Country
6.4.3.1 China Lab Workflow Optimization Market Estimates and Forecast, 2021-2029 (USD Million)
6.4.3.1.1 By Type of Solution
6.4.3.1.2 By End User
6.4.3.2 Japan Lab Workflow Optimization Market Estimates and Forecast, 2021-2029 (USD Million)
6.4.3.2.1 By Type of Solution
6.4.3.2.2 By End User
6.4.3.3 India Lab Workflow Optimization Market Estimates and Forecast, 2021-2029 (USD Million)
6.4.3.3.1 By Type of Solution
6.4.3.3.2 By End User
6.4.3.4 South Korea Lab Workflow Optimization Market Estimates and Forecast, 2021-2029 (USD Million)
6.4.3.4.1 By Type of Solution
6.4.3.4.2 By End User
6.4.3.5 Singapore Lab Workflow Optimization Market Estimates and Forecast, 2021-2029 (USD Million)
6.4.3.5.1 By Type of Solution
6.4.3.5.2 By End User
6.4.3.6 Malaysia Lab Workflow Optimization Market Estimates and Forecast, 2021-2029 (USD Million)
6.4.3.6.1 By Type of Solution
6.4.3.6.2 By End User
6.4.3.7 Thailand Lab Workflow Optimization Market Estimates and Forecast, 2021-2029 (USD Million)
6.4.3.6.1 By Type of Solution
6.4.3.6.2 By End User
6.4.3.8 Indonesia Lab Workflow Optimization Market Estimates and Forecast, 2021-2029 (USD Million)
6.4.3.7.1 By Type of Solution
6.4.3.7.2 By End User
6.4.3.9 Vietnam Lab Workflow Optimization Market Estimates and Forecast, 2021-2029 (USD Million)
6.4.3.8.1 By Type of Solution
6.4.3.8.2 By End User
6.4.3.10 Taiwan Lab Workflow Optimization Market Estimates and Forecast, 2021-2029 (USD Million)
6.4.3.10.1 By Type of Solution
6.4.3.10.2 By End User
6.4.3.11 Rest of Asia Pacific Lab Workflow Optimization Market Estimates and Forecast, 2021-2029 (USD Million)
6.4.3.11.1 By Type of Solution
6.4.3.11.2 By End User
6.5 Middle East and Africa Lab Workflow Optimization Market Estimates and Forecast, 2021-2029 (USD Million)
6.5.1 By Type of Solution
6.5.2 By End User
6.5.3 By Country
6.5.3.1 Saudi Arabia Lab Workflow Optimization Market Estimates and Forecast, 2021-2029 (USD Million)
6.5.3.1.1 By Type of Solution
6.5.3.1.2 By End User
6.5.3.2 U.A.E. Lab Workflow Optimization Market Estimates and Forecast, 2021-2029 (USD Million)
6.5.3.2.1 By Type of Solution
6.5.3.2.2 By End User
6.5.3.3 Israel Lab Workflow Optimization Market Estimates and Forecast, 2021-2029 (USD Million)
6.5.3.3.1 By Type of Solution
6.5.3.3.2 By End User
6.5.3.4 South Africa Lab Workflow Optimization Market Estimates and Forecast, 2021-2029 (USD Million)
6.5.3.4.1 By Type of Solution
6.5.3.4.2 By End User
6.5.3.5 Rest of Middle East and Africa Lab Workflow Optimization Market Estimates and Forecast, 2021-2029 (USD Million)
6.5.3.5.1 By Type of Solution
6.5.3.5.2 By End User
6.6 Central and South America Lab Workflow Optimization Market Estimates and Forecast, 2021-2029 (USD Million)
6.6.1 By Type of Solution
6.6.2 By End User
6.6.3 By Country
6.6.3.1 Brazil Lab Workflow Optimization Market Estimates and Forecast, 2021-2029 (USD Million)
6.6.3.1.1 By Type of Solution
6.6.3.1.2 By End User
6.6.3.2 Argentina Lab Workflow Optimization Market Estimates and Forecast, 2021-2029 (USD Million)
6.6.3.2.1 By Type of Solution
6.6.3.2.2 By End User
6.6.3.3 Chile Lab Workflow Optimization Market Estimates and Forecast, 2021-2029 (USD Million)
6.6.3.3.1 By Type of Solution
6.6.3.3.2 By End User
6.6.3.3 Rest of Central and South America Lab Workflow Optimization Market Estimates and Forecast, 2021-2029 (USD Million)
6.6.3.3.1 By Type of Solution
6.6.3.3.2 By End User
7 COMPETITIVE LANDCAPE
7.1 Company Market Share Analysis
7.2 Four Quadrant Positioning Matrix
7.2.1 Market Leaders
7.2.2 Market Visionaries
7.2.3 Market Challengers
7.2.4 Niche Market Players
7.3 Vendor Landscape
7.3.1 North America
7.3.2 Europe
7.3.3 Asia Pacific
7.3.4 Rest of the World
7.4 Company Profiles
7.4.1 Thermo Fisher Scientific, Inc.
7.4.1.1 Business Description & Financial Analysis
7.4.1.2 SWOT Analysis
7.4.1.3 Products & Services Offered
7.4.1.4 Strategic Alliances between Business Partners
7.4.2 LabWare, Inc.
7.4.2.1 Business Description & Financial Analysis
7.4.2.2 SWOT Analysis
7.4.2.3 Products & Services Offered
7.4.2.4 Strategic Alliances between Business Partners
7.4.3 Agilent Technologies, Inc.
7.4.3.1 Business Description & Financial Analysis
7.4.3.2 SWOT Analysis
7.4.3.3 Products & Services Offered
7.4.3.4 Strategic Alliances between Business Partners
7.4.4 Waters Corporation
7.4.4.1 Business Description & Financial Analysis
7.4.4.2 SWOT Analysis
7.4.4.3 Products & Services Offered
7.4.4.4 Strategic Alliances between Business Partners
7.4.5 PerkinElmer, Inc.
7.4.5.1 Business Description & Financial Analysis
7.4.5.2 SWOT Analysis
7.4.5.3 Products & Services Offered
7.4.5.4 Strategic Alliances between Business Partners
7.4.6 SIEMENS HEALTHINEERS AG
7.4.6.1 Business Description & Financial Analysis
7.4.6.2 SWOT Analysis
7.4.6.3 Products & Services Offered
7.4.6.4 Strategic Alliances between Business Partners
7.4.7 Abbott Laboratories
7.4.7.1 Business Description & Financial Analysis
7.4.7.2 SWOT Analysis
7.4.7.3 Products & Services Offered
7.4.7.4 Strategic Alliances between Business Partners
7.4.8 Bruker Corporation
7.4.8.1 Business Description & Financial Analysis
7.4.8.2 SWOT Analysis
7.4.8.3 Products & Services Offered
7.4.8.4 Strategic Alliances between Business Partners
7.4.9 Shimadzu Corporation
7.4.9.1 Business Description & Financial Analysis
7.4.9.2 SWOT Analysis
7.4.9.3 Products & Services Offered
7.4.9.4 Strategic Alliances between Business Partners
7.4.10 Bio-Rad Laboratories, Inc.
7.4.10.1 Business Description & Financial Analysis
7.4.10.2 SWOT Analysis
7.4.10.3 Products & Services Offered
7.4.10.4 Strategic Alliances between Business Partners
7.4.11 Other Companies
7.4.11.1 Business Description & Financial Analysis
7.4.11.2 SWOT Analysis
7.4.11.3 Products & Services Offered
7.4.11.4 Strategic Alliances between Business Partners
8 RESEARCH METHODOLOGY
8.1 Market Introduction
8.1.1 Market Definition
8.1.2 Market Scope & Segmentation
8.2 Information Procurement
8.2.1 Secondary Research
8.2.1.1 Purchased Databases
8.2.1.2 GMEs Internal Data Repository
8.2.1.3 Secondary Resources & Third Party Perspectives
8.2.1.4 Company Information Sources
8.2.2 Primary Research
8.2.2.1 Various Types of Respondents for Primary Interviews
8.2.2.2 Number of Interviews Conducted throughout the Research Process
8.2.2.3 Primary Stakeholders
8.2.2.4 Discussion Guide for Primary Participants
8.2.3 Expert Panels
8.2.3.1 Expert Panels Across 30+ Industry
8.2.4 Paid Local Experts
8.2.4.1 Paid Local Experts Across 30+ Industry Across each Region
8.3 Market Estimation
8.3.1 Top-Down Approach
8.3.1.1 Macro-Economic Indicators Considered
8.3.1.2 Micro-Economic Indicators Considered
8.3.2 Bottom Up Approach
8.3.2.1 Company Share Analysis Approach
8.3.2.2 Estimation of Potential Product Sales
8.4 Data Triangulation
8.4.1 Data Collection
8.4.2 Time Series, Cross Sectional & Panel Data Analysis
8.4.3 Cluster Analysis
8.5 Analysis and Output
8.5.1 Inhouse AI Based Real Time Analytics Tool
8.5.2 Output From Desk & Primary Research
8.6 Research Assumptions & Limitations
8.6.1 Research Assumptions
8.6.2 Research Limitations
LIST OF TABLES
1 Global Lab Workflow Optimization Market, By Type of Solution, 2021-2029 (USD Mllion)
2 Laboratory Information Management Systems (LIMS) Market, By Region, 2021-2029 (USD Mllion)
3 Electronic Lab Notebooks (ELN) Market, By Region, 2021-2029 (USD Mllion)
4 Laboratory Automation Systems Market, By Region, 2021-2029 (USD Mllion)
5 Scientific Data Management Systems (SDMS) Market, By Region, 2021-2029 (USD Mllion)
6 Laboratory Execution Systems (LES) Market, By Region, 2021-2029 (USD Mllion)
7 Inventory Management Systems Market, By Region, 2021-2029 (USD Mllion)
8 Others Market, By Region, 2021-2029 (USD Mllion)
9 Global Lab Workflow Optimization Market, By End User, 2021-2029 (USD Mllion)
10 Pharmaceutical and Biotechnology Organizations Market, By Region, 2021-2029 (USD Mllion)
11 Academic and Research Institutes Market, By Region, 2021-2029 (USD Mllion)
12 Contract Research Organizations (CROs) Market, By Region, 2021-2029 (USD Mllion)
13 Clinical Diagnostics Laboratories Market, By Region, 2021-2029 (USD Mllion)
14 Food and Beverage Laboratories Market, By Region, 2021-2029 (USD Mllion)
15 Environmental Testing Laboratories Market, By Region, 2021-2029 (USD Mllion)
16 Others Market, By Region, 2021-2029 (USD Mllion)
17 Regional Analysis, 2021-2029 (USD Mllion)
18 North America Lab Workflow Optimization Market, By Type of Solution, 2021-2029 (USD Mllion)
19 North America Lab Workflow Optimization Market, By End User, 2021-2029 (USD Mllion)
20 North America Lab Workflow Optimization Market, By COUNTRY, 2021-2029 (USD Mllion)
21 U.S. Lab Workflow Optimization Market, By Type of Solution, 2021-2029 (USD Mllion)
22 U.S. Lab Workflow Optimization Market, By End User, 2021-2029 (USD Mllion)
23 Canada Lab Workflow Optimization Market, By Type of Solution, 2021-2029 (USD Mllion)
24 Canada Lab Workflow Optimization Market, By End User, 2021-2029 (USD Mllion)
25 Mexico Lab Workflow Optimization Market, By Type of Solution, 2021-2029 (USD Mllion)
26 Mexico Lab Workflow Optimization Market, By End User, 2021-2029 (USD Mllion)
27 Europe Lab Workflow Optimization Market, By Type of Solution, 2021-2029 (USD Mllion)
28 Europe Lab Workflow Optimization Market, By End User, 2021-2029 (USD Mllion)
29 EUROPE Lab Workflow Optimization Market, By COUNTRY, 2021-2029 (USD Mllion)
30 Germany Lab Workflow Optimization Market, By Type of Solution, 2021-2029 (USD Mllion)
31 Germany Lab Workflow Optimization Market, By End User, 2021-2029 (USD Mllion)
32 U.K. Lab Workflow Optimization Market, By Type of Solution, 2021-2029 (USD Mllion)
33 U.K. Lab Workflow Optimization Market, By End User, 2021-2029 (USD Mllion)
34 France Lab Workflow Optimization Market, By Type of Solution, 2021-2029 (USD Mllion)
35 France Lab Workflow Optimization Market, By End User, 2021-2029 (USD Mllion)
36 Italy Lab Workflow Optimization Market, By Type of Solution, 2021-2029 (USD Mllion)
37 Italy Lab Workflow Optimization Market, By End User, 2021-2029 (USD Mllion)
38 Spain Lab Workflow Optimization Market, By Type of Solution, 2021-2029 (USD Mllion)
39 Spain Lab Workflow Optimization Market, By End User, 2021-2029 (USD Mllion)
40 Netherlands Lab Workflow Optimization Market, By Type of Solution, 2021-2029 (USD Mllion)
41 Netherlands Lab Workflow Optimization Market, By End User, 2021-2029 (USD Mllion)
42 Rest Of Europe Lab Workflow Optimization Market, By Type of Solution, 2021-2029 (USD Mllion)
43 Rest Of Europe Lab Workflow Optimization Market, By End User, 2021-2029 (USD Mllion)
44 Asia Pacific Lab Workflow Optimization Market, By Type of Solution, 2021-2029 (USD Mllion)
45 Asia Pacific Lab Workflow Optimization Market, By End User, 2021-2029 (USD Mllion)
46 ASIA PACIFIC Lab Workflow Optimization Market, By COUNTRY, 2021-2029 (USD Mllion)
47 China Lab Workflow Optimization Market, By Type of Solution, 2021-2029 (USD Mllion)
48 China Lab Workflow Optimization Market, By End User, 2021-2029 (USD Mllion)
49 Japan Lab Workflow Optimization Market, By Type of Solution, 2021-2029 (USD Mllion)
50 Japan Lab Workflow Optimization Market, By End User, 2021-2029 (USD Mllion)
51 India Lab Workflow Optimization Market, By Type of Solution, 2021-2029 (USD Mllion)
52 India Lab Workflow Optimization Market, By End User, 2021-2029 (USD Mllion)
53 South Korea Lab Workflow Optimization Market, By Type of Solution, 2021-2029 (USD Mllion)
54 South Korea Lab Workflow Optimization Market, By End User, 2021-2029 (USD Mllion)
55 Singapore Lab Workflow Optimization Market, By Type of Solution, 2021-2029 (USD Mllion)
56 Singapore Lab Workflow Optimization Market, By End User, 2021-2029 (USD Mllion)
57 Thailand Lab Workflow Optimization Market, By Type of Solution, 2021-2029 (USD Mllion)
58 Thailand Lab Workflow Optimization Market, By End User, 2021-2029 (USD Mllion)
59 Malaysia Lab Workflow Optimization Market, By Type of Solution, 2021-2029 (USD Mllion)
60 Malaysia Lab Workflow Optimization Market, By End User, 2021-2029 (USD Mllion)
61 Indonesia Lab Workflow Optimization Market, By Type of Solution, 2021-2029 (USD Mllion)
62 Indonesia Lab Workflow Optimization Market, By End User, 2021-2029 (USD Mllion)
63 Vietnam Lab Workflow Optimization Market, By Type of Solution, 2021-2029 (USD Mllion)
64 Vietnam Lab Workflow Optimization Market, By End User, 2021-2029 (USD Mllion)
65 Taiwan Lab Workflow Optimization Market, By Type of Solution, 2021-2029 (USD Mllion)
66 Taiwan Lab Workflow Optimization Market, By End User, 2021-2029 (USD Mllion)
67 Rest of APAC Lab Workflow Optimization Market, By Type of Solution, 2021-2029 (USD Mllion)
68 Rest of APAC Lab Workflow Optimization Market, By End User, 2021-2029 (USD Mllion)
69 Middle East and Africa Lab Workflow Optimization Market, By Type of Solution, 2021-2029 (USD Mllion)
70 Middle East and Africa Lab Workflow Optimization Market, By End User, 2021-2029 (USD Mllion)
71 MIDDLE EAST & ADRICA Lab Workflow Optimization Market, By COUNTRY, 2021-2029 (USD Mllion)
72 Saudi Arabia Lab Workflow Optimization Market, By Type of Solution, 2021-2029 (USD Mllion)
73 Saudi Arabia Lab Workflow Optimization Market, By End User, 2021-2029 (USD Mllion)
74 UAE Lab Workflow Optimization Market, By Type of Solution, 2021-2029 (USD Mllion)
75 UAE Lab Workflow Optimization Market, By End User, 2021-2029 (USD Mllion)
76 Israel Lab Workflow Optimization Market, By Type of Solution, 2021-2029 (USD Mllion)
77 Israel Lab Workflow Optimization Market, By End User, 2021-2029 (USD Mllion)
78 South Africa Lab Workflow Optimization Market, By Type of Solution, 2021-2029 (USD Mllion)
79 South Africa Lab Workflow Optimization Market, By End User, 2021-2029 (USD Mllion)
80 Rest Of Middle East and Africa Lab Workflow Optimization Market, By Type of Solution, 2021-2029 (USD Mllion)
81 Rest Of Middle East and Africa Lab Workflow Optimization Market, By End User, 2021-2029 (USD Mllion)
82 Central and South America Lab Workflow Optimization Market, By Type of Solution, 2021-2029 (USD Mllion)
83 Central and South America Lab Workflow Optimization Market, By End User, 2021-2029 (USD Mllion)
84 CENTRAL AND SOUTH AMERICA Lab Workflow Optimization Market, By COUNTRY, 2021-2029 (USD Mllion)
85 Brazil Lab Workflow Optimization Market, By Type of Solution, 2021-2029 (USD Mllion)
86 Brazil Lab Workflow Optimization Market, By End User, 2021-2029 (USD Mllion)
87 Chile Lab Workflow Optimization Market, By Type of Solution, 2021-2029 (USD Mllion)
88 Chile Lab Workflow Optimization Market, By End User, 2021-2029 (USD Mllion)
89 Argentina Lab Workflow Optimization Market, By Type of Solution, 2021-2029 (USD Mllion)
90 Argentina Lab Workflow Optimization Market, By End User, 2021-2029 (USD Mllion)
91 Rest Of Central and South America Lab Workflow Optimization Market, By Type of Solution, 2021-2029 (USD Mllion)
92 Rest Of Central and South America Lab Workflow Optimization Market, By End User, 2021-2029 (USD Mllion)
93 Thermo Fisher Scientific, Inc.: Products & Services Offering
94 LabWare, Inc.: Products & Services Offering
95 Agilent Technologies, Inc.: Products & Services Offering
96 Waters Corporation: Products & Services Offering
97 PerkinElmer, Inc.: Products & Services Offering
98 SIEMENS HEALTHINEERS AG: Products & Services Offering
99 Abbott Laboratories : Products & Services Offering
100 Bruker Corporation: Products & Services Offering
101 Shimadzu Corporation, Inc: Products & Services Offering
102 Bio-Rad Laboratories, Inc.: Products & Services Offering
103 Other Companies: Products & Services Offering
LIST OF FIGURES
1 Global Lab Workflow Optimization Market Overview
2 Global Lab Workflow Optimization Market Value From 2021-2029 (USD Mllion)
3 Global Lab Workflow Optimization Market Share, By Type of Solution (2023)
4 Global Lab Workflow Optimization Market Share, By End User (2023)
5 Global Lab Workflow Optimization Market, By Region (Asia Pacific Market)
6 Technological Trends In Global Lab Workflow Optimization Market
7 Four Quadrant Competitor Positioning Matrix
8 Impact Of Macro & Micro Indicators On The Market
9 Impact Of Key Drivers On The Global Lab Workflow Optimization Market
10 Impact Of Challenges On The Global Lab Workflow Optimization Market
11 Porter’s Five Forces Analysis
12 Global Lab Workflow Optimization Market: By Type of Solution Scope Key Takeaways
13 Global Lab Workflow Optimization Market, By Type of Solution Segment: Revenue Growth Analysis
14 Laboratory Information Management Systems (LIMS) Market, By Region, 2021-2029 (USD Mllion)
15 Electronic Lab Notebooks (ELN) Market, By Region, 2021-2029 (USD Mllion)
16 Laboratory Automation Systems Market, By Region, 2021-2029 (USD Mllion)
17 Scientific Data Management Systems (SDMS) Market, By Region, 2021-2029 (USD Mllion)
18 Laboratory Execution Systems (LES) Market, By Region, 2021-2029 (USD Mllion)
19 Inventory Management Systems Market, By Region, 2021-2029 (USD Mllion)
20 Others Market, By Region, 2021-2029 (USD Mllion)
21 Global Lab Workflow Optimization Market, By End User Segment: Revenue Growth Analysis
22 Pharmaceutical and Biotechnology Organizations Market, By Region, 2021-2029 (USD Mllion)
23 Academic and Research Institutes Market, By Region, 2021-2029 (USD Mllion)
24 Contract Research Organizations (CROs) Market, By Region, 2021-2029 (USD Mllion)
25 Clinical Diagnostics Laboratories Market, By Region, 2021-2029 (USD Mllion)
26 Food and Beverage Laboratories Market, By Region, 2021-2029 (USD Mllion)
27 Environmental Testing Laboratories Market, By Region, 2021-2029 (USD Mllion)
28 Others Market, By Region, 2021-2029 (USD Mllion)
29 Regional Segment: Revenue Growth Analysis
30 Global Lab Workflow Optimization Market: Regional Analysis
31 North America Lab Workflow Optimization Market Overview
32 North America Lab Workflow Optimization Market, By Type of Solution
33 North America Lab Workflow Optimization Market, By End User
34 North America Lab Workflow Optimization Market, By Country
35 U.S. Lab Workflow Optimization Market, By Type of Solution
36 U.S. Lab Workflow Optimization Market, By End User
37 Canada Lab Workflow Optimization Market, By Type of Solution
38 Canada Lab Workflow Optimization Market, By End User
39 Mexico Lab Workflow Optimization Market, By Type of Solution
40 Mexico Lab Workflow Optimization Market, By End User
41 Four Quadrant Positioning Matrix
42 Company Market Share Analysis
43 Thermo Fisher Scientific, Inc.: Company Snapshot
44 Thermo Fisher Scientific, Inc.: SWOT Analysis
45 Thermo Fisher Scientific, Inc.: Geographic Presence
46 LabWare, Inc.: Company Snapshot
47 LabWare, Inc.: SWOT Analysis
48 LabWare, Inc.: Geographic Presence
49 Agilent Technologies, Inc.: Company Snapshot
50 Agilent Technologies, Inc.: SWOT Analysis
51 Agilent Technologies, Inc.: Geographic Presence
52 Waters Corporation: Company Snapshot
53 Waters Corporation: Swot Analysis
54 Waters Corporation: Geographic Presence
55 PerkinElmer, Inc.: Company Snapshot
56 PerkinElmer, Inc.: SWOT Analysis
57 PerkinElmer, Inc.: Geographic Presence
58 SIEMENS HEALTHINEERS AG: Company Snapshot
59 SIEMENS HEALTHINEERS AG: SWOT Analysis
60 SIEMENS HEALTHINEERS AG: Geographic Presence
61 Abbott Laboratories : Company Snapshot
62 Abbott Laboratories : SWOT Analysis
63 Abbott Laboratories : Geographic Presence
64 Bruker Corporation: Company Snapshot
65 Bruker Corporation: SWOT Analysis
66 Bruker Corporation: Geographic Presence
67 Shimadzu Corporation, Inc.: Company Snapshot
68 Shimadzu Corporation, Inc.: SWOT Analysis
69 Shimadzu Corporation, Inc.: Geographic Presence
70 Bio-Rad Laboratories, Inc.: Company Snapshot
71 Bio-Rad Laboratories, Inc.: SWOT Analysis
72 Bio-Rad Laboratories, Inc.: Geographic Presence
73 Other Companies: Company Snapshot
74 Other Companies: SWOT Analysis
75 Other Companies: Geographic Presence
The Global Lab Workflow Optimization Market has been studied from the year 2019 till 2029. However, the CAGR provided in the report is from the year 2024 to 2029. The research methodology involved three stages: Desk research, Primary research, and Analysis & Output from the entire research process.

The desk research involved a robust background study which meant referring to paid and unpaid databases to understand the market dynamics; mapping contracts from press releases; identifying the key players in the market, studying their product portfolio, competition level, annual reports/SEC filings & investor presentations; and learning the demand and supply-side analysis for the Lab Workflow Optimization Market.

The primary research activity included telephonic conversations with more than 50 tier 1 industry consultants, distributors, and end-use product manufacturers.

Finally, based on the above thorough research process, an in-depth analysis was carried out considering the following aspects: market attractiveness, current & future market trends, market share analysis, SWOT analysis of the company and customer analytics.

Frequently Asked Questions

This FREE sample includes market data points, ranging from trend analyses to market estimates & forecasts. See for yourself.
Or view our licence options:
Tailor made solutions just for you
80% of our clients seek made-to-order reports. How do you want us to tailor yours?
OUR CLIENTS


