This report was recently updated on August 29 2025 with the latest and most recent
market numbers
Global Low Code Technology in Insurance Market Size, Trends & Analysis - Forecasts to 2029 By Component (Platform and Services), By Application Type (Web-based, Mobile-based, and Desktop and Server-based), By Organization Size (SMEs and Large Enterprises), and By Region (North America, Asia Pacific, Central & South America, Europe, and Middle East and Africa), Competitive Landscape, Company Market Share Analysis, and End User Analysis
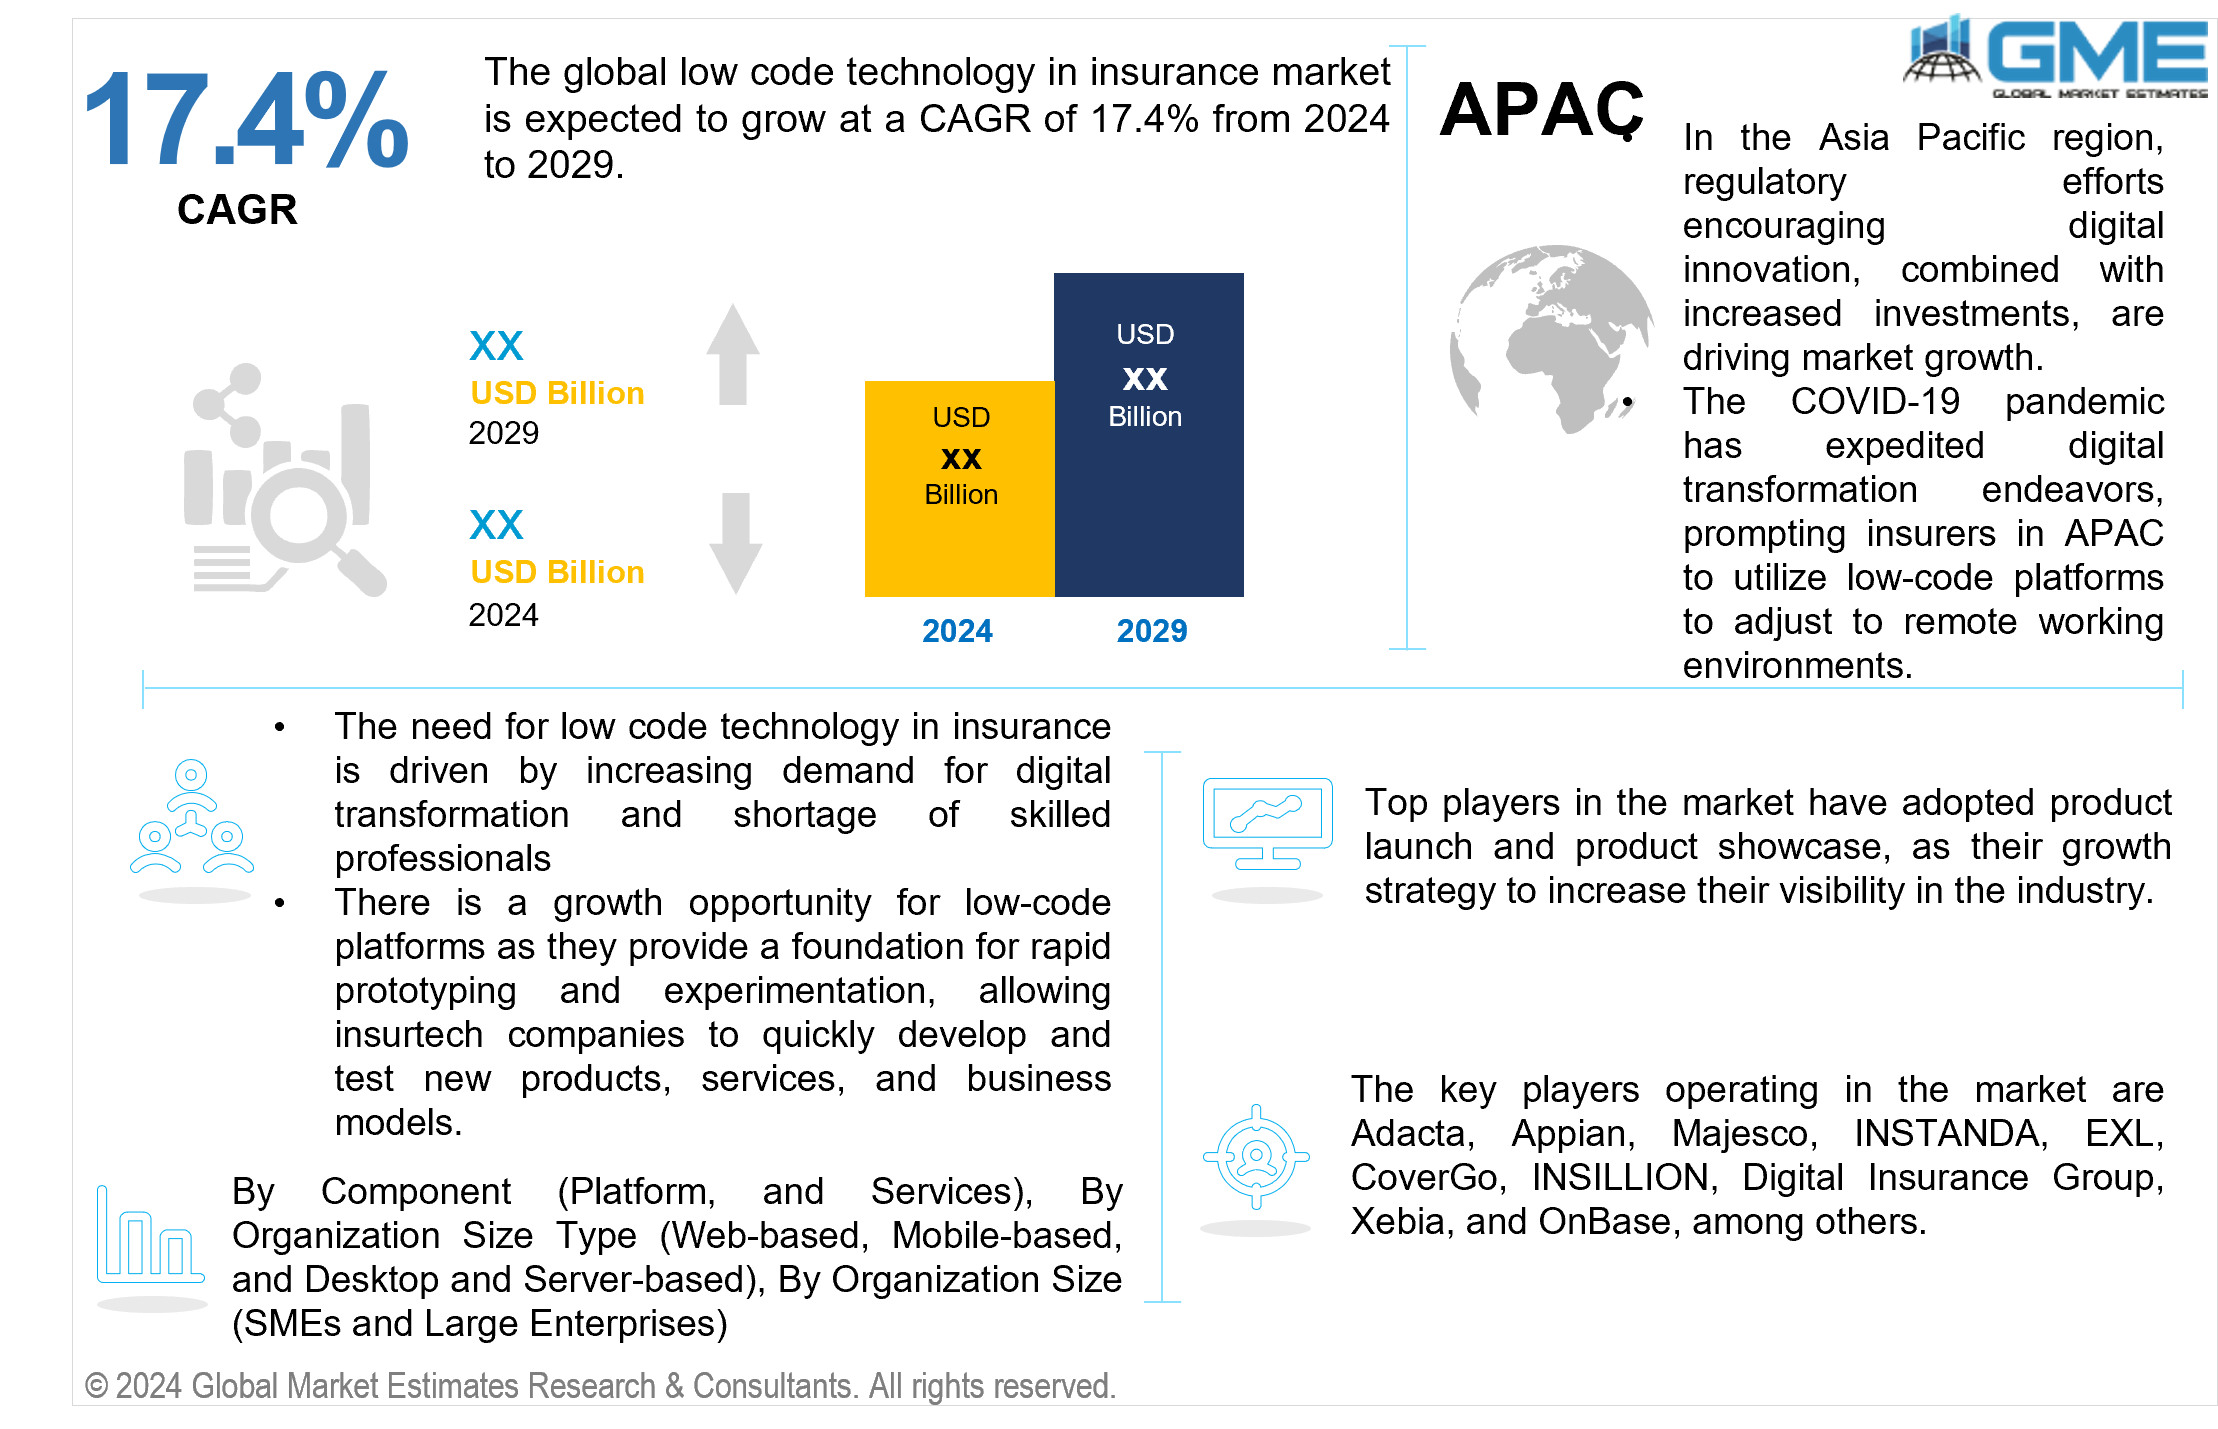
The global low code technology in insurance market is expected to grow at a CAGR of 17.4% from 2024 to 2029. Low-code technology in the insurance industry revolutionizes how insurers manage their processes, workflows, and customer interactions. It provides a platform enabling users to develop applications with minimal coding requirements, utilizing intuitive visual interfaces and drag-and-drop functionalities.
The market drivers include increasing demand for digital transformation and a shortage of skilled professionals. The insurance industry is undergoing a significant digital transformation to meet customers' evolving needs and stay competitive. Low-code technology enables insurers to rapidly develop and deploy digital solutions such as mobile apps, self-service portals, and chatbots. Low-code platforms empower non-technical users, such as business analysts and citizen developers, to create applications with minimal coding knowledge. By reducing the reliance on IT departments and accelerating the development process, low-code technology addresses the challenge of talent scarcity in the insurance sector. Low-code platforms provide a foundation for rapid prototyping and experimentation, allowing insurtech companies to quickly develop and test new products, services, and business models.
While low-code platforms offer flexibility and speed in application development, there are concerns about the security of these applications. Rapid development cycles and the involvement of non-technical users may lead to oversights in security protocols and vulnerability management.
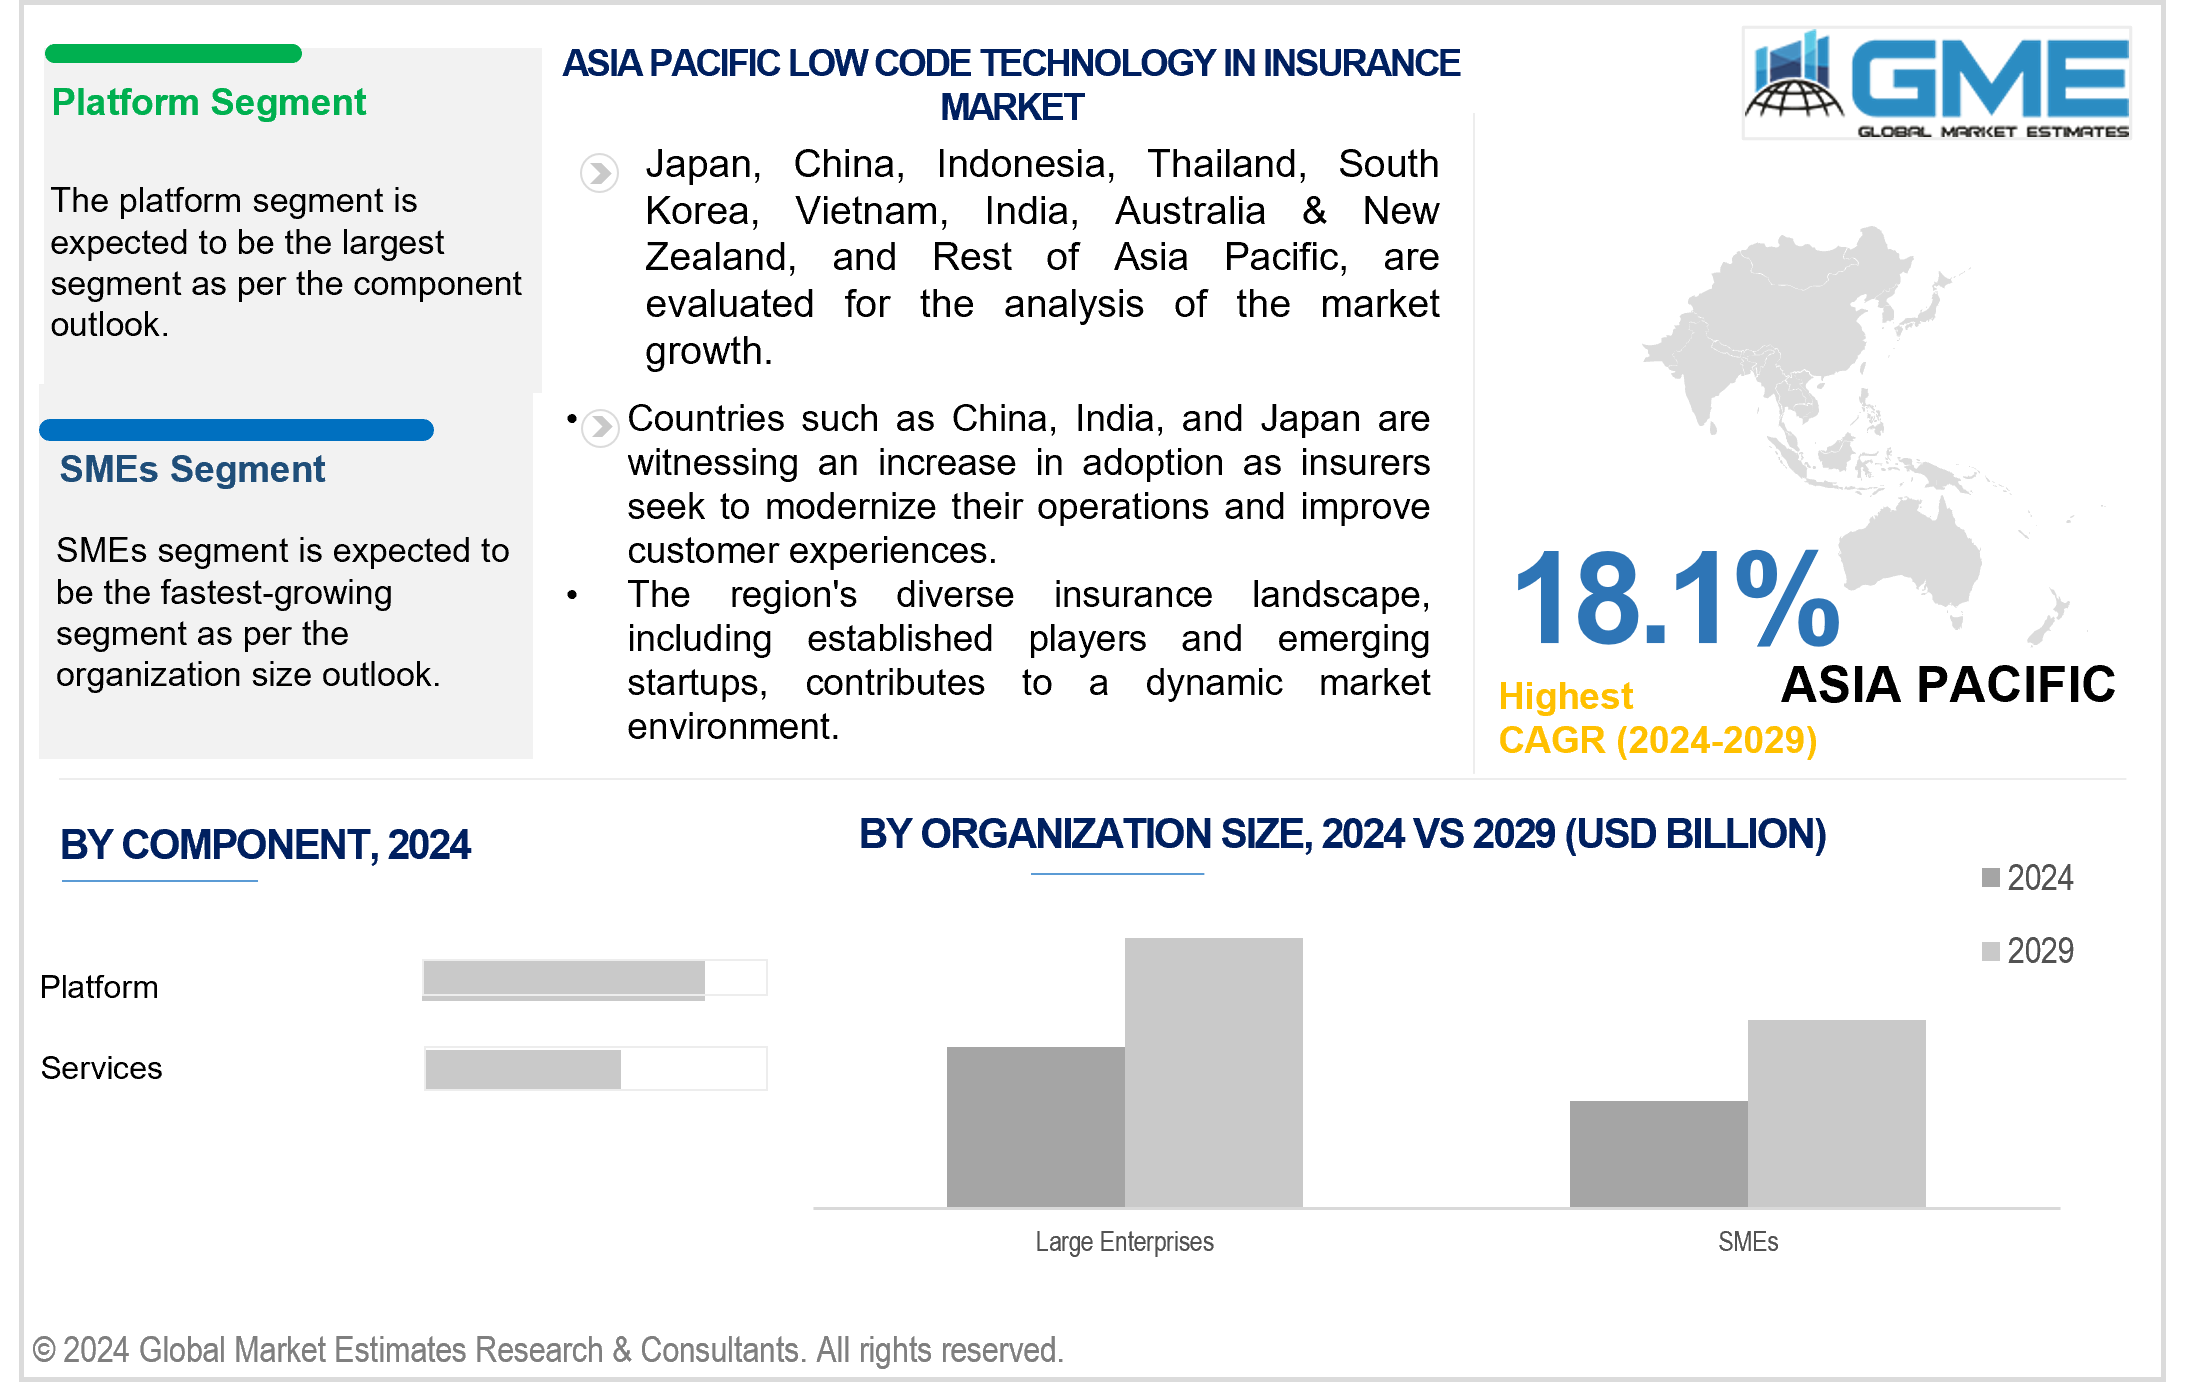
Based on component, the market is segmented into platform and services. The platform segment is expected to dominate the market over the forecast period. This is because the platform is the core technology enabling users to build, deploy, and manage applications with minimal coding. The platform provides the visual development environment, tools, and frameworks necessary for creating software solutions, making it an essential component of the low-code ecosystem.
The services segment is projected to grow fastest during the forecast period. It includes consulting, implementation, training, and support services. As more insurers adopt low-code technology, they require assistance in implementing and integrating the platform into their existing infrastructure, training their staff on how to use the platform effectively, and receiving ongoing support and maintenance services.
Based on application type, the market is segmented into web-based, mobile-based, and desktop and server-based. The web-based segment is expected to hold the largest share of the market during the forecast period. Web-based applications are widely used in the insurance industry for various purposes, including customer portals, policy management systems, claims processing platforms, and agent portals. These applications can be accessed remotely with an internet connection, providing flexibility and convenience for users.
The mobile-based segment is projected to witness the fastest growth during the forecast period. With the increasing use of smartphones and tablets, insurance companies are investing in mobile applications to enhance customer engagement, provide self-service options, and enable on-the-go access to insurance services. Mobile-based applications allow insurers to reach a broader audience, improve customer satisfaction, and stay competitive in the digital age. As a result, the demand for mobile-based low-code applications in the insurance sector is expected to continue growing rapidly.
Based on organization size, the market is segmented into SMEs and large enterprises. The large enterprises segment is expected to dominate the market in the forecast period. Large insurance companies have substantial resources and complex operations, making them prime candidates for adopting low-code platforms to streamline processes, improve efficiency, and enhance customer experiences. These enterprises often have diverse IT needs and require scalable solutions that can accommodate their extensive operations and regulatory requirements.
The SMEs segment is projected to grow fastest during the forecast period. SMEs in the insurance sector are increasingly recognizing the benefits of low-code technology in driving innovation, reducing costs, and gaining a competitive edge. Low-code platforms enable SMEs to rapidly develop and deploy customized solutions tailored to their specific needs without the need for extensive coding expertise or large IT budgets.
North America is analyzed to be the largest region in the global low code technology in insurance market during the forecast period. North American insurance companies increasingly embrace low-code technology to modernize operations, improve efficiency, and enhance customer experiences. Low-code technology enables insurers to develop customer-centric applications like self-service portals, mobile apps, and chatbots. This assists in delivering personalized services, streamlining communication, and enhancing engagement throughout the customer lifecycle.
Asia Pacific is analyzed to be the fastest-growing region in the global low code technology in insurance market during the forecast period. Countries such as China, India, and Japan are witnessing an increase in adoption as insurers seek to modernize their operations and improve customer experiences. The region's diverse insurance landscape, including established players and emerging start-ups, contributes to a dynamic market environment. Regulatory initiatives promoting digital innovation, coupled with growing investments in technology infrastructure, further propel market expansion. Additionally, the COVID-19 pandemic has accelerated digital transformation efforts, with insurers leveraging low-code platforms to adapt to remote work setups and meet evolving customer needs.
Whatfix, WalkMe, Stonly, Oracle, AppLearn, SAP, Userlane, Pendo, Knowmore, and Appcues are some of the market players operating in the global market.
Please note: This is not an exhaustive list of companies profiled in the report.
Recent Developments
On February 14, 2024, Appian announced that it was named a Leader in the Everest Group insurance technology report, Low-code Technology Providers in Insurance PEAK Matrix Assessment 2023.
1 STRATEGIC INSIGHTS ON NEW REVENUE POCKETS
1.1 Strategic Opportunity & Attractiveness Analysis
1.1.1 Hot Revenue Pockets
1.1.2 Market Attractiveness Score
1.1.3 Revenue Impacting Opportunity
1.1.4 High Growing Region/Country
1.1.5 Competitor Analysis
1.1.6 Consumer Analysis
1.2 Global Market Estimates' View
1.3 Strategic Insights across Business Functions
1.3.1 For Chief Executive Officers
1.3.2 For Chief Marketing Officers
1.3.3 For Chief Strategy Officers
1.4 Evaluate the Potential of your Existing Business Lines vs. New Lines to Enter Into
2 TECHNOLOGICAL TRENDS
2.1 Technological Adoption Rate
2.2 Current Trend Impact Analysis
2.3 Future Trend Impact Analysis
2.4 Data Metrics
3 GLOBAL LOW CODE TECHNOLOGY IN INSURANCE MARKET OUTLOOK
3.1 Market Pyramid Analysis
3.1.1 Introduction
3.1.2 Adjacent Market Opportunities
3.1.3 Ancillary Market Opportunities
3.2 Demand Side Analysis
3.2.1 Market Drivers: Impact Analysis
3.2.2 Market Restraints: Impact Analysis
3.2.3 Market Opportunities: Impact Analysis
3.2.4 Market Challenges: Impact Analysis
3.3 Supply Side Analysis
3.3.1 Porter’s Five Forces Analysis
3.3.1.1 Threat of New Entrants
3.3.1.2 Threat of New Substitutes
3.3.1.3 Bargaining Power of Suppliers
3.3.1.4 Bargaining Power of Buyers
3.3.1.5 Intensity of Competitive Rivalry
3.3.2 SWOT Analysis; By Factor (Political & Legal, Economic, and Technological)
3.3.2.1 Political Landscape
3.3.2.2 Economic Landscape
3.3.2.3 Social Landscape
3.3.2.4 Technology Landscape
3.3.3 Value Chain Analysis
3.3.4 Trend Analysis
3.3.5 Gap Analysis
3.3.6 Cost Analysis
4 GLOBAL LOW CODE TECHNOLOGY IN INSURANCE MARKET, BY COMPONENT
4.1 Introduction
4.2 Low Code Technology in Insurance Market: Component Scope Key Takeaways
4.3 Revenue Growth Analysis, 2023 & 2029
4.4 Platform
4.4.1 Platform Market Estimates and Forecast, 2021-2029 (USD Million)
4.5 Services
4.5.1 Services Market Estimates and Forecast, 2021-2029 (USD Million)
5 GLOBAL LOW CODE TECHNOLOGY IN INSURANCE MARKET, BY APPLICATION TYPE
5.1 Introduction
5.2 Low Code Technology in Insurance Market: Application Type Scope Key Takeaways
5.3 Revenue Growth Analysis, 2023 & 2029
5.4 Web-based
5.4.1 Web-based Market Estimates and Forecast, 2021-2029 (USD Million)
5.5 Mobile-based
5.5.1 Mobile-based Market Estimates and Forecast, 2021-2029 (USD Million)
5.6 Desktop and Server-based
5.6.1 Desktop and Server-based Market Estimates and Forecast, 2021-2029 (USD Million)
6 GLOBAL LOW CODE TECHNOLOGY IN INSURANCE MARKET, BY ORGANIZATION SIZE
6.1 Introduction
6.2 Low Code Technology in Insurance Market: Organization Size Scope Key Takeaways
6.3 Revenue Growth Analysis, 2023 & 2029
6.4 SMEs
6.4.1 SMEs Market Estimates and Forecast, 2021-2029 (USD Million)
6.5 Large Enterprises
6.5.1 Large Enterprises Market Estimates and Forecast, 2021-2029 (USD Million)
7 GLOBAL LOW CODE TECHNOLOGY IN INSURANCE MARKET, BY REGION
7.1 Introduction
7.2 North America Low Code Technology in Insurance Market Estimates and Forecast, 2021-2029 (USD Million)
7.2.1 By Component
7.2.2 By Application Type
7.2.3 By Organization Size
7.2.4 By Country
7.2.4.1 U.S. Low Code Technology in Insurance Market Estimates and Forecast, 2021-2029 (USD Million)
7.2.4.1.1 By Component
7.2.4.1.2 By Application Type
7.2.4.1.3 By Organization Size
7.2.4.2 Canada Low Code Technology in Insurance Market Estimates and Forecast, 2021-2029 (USD Million)
7.2.4.2.1 By Component
7.2.4.2.2 By Application Type
7.2.4.2.3 By Organization Size
7.2.4.3 Mexico Low Code Technology in Insurance Market Estimates and Forecast, 2021-2029 (USD Million)
7.2.4.3.1 By Component
7.2.4.3.2 By Application Type
7.2.4.3.3 By Organization Size
7.3 Europe Low Code Technology in Insurance Market Estimates and Forecast, 2021-2029 (USD Million)
7.3.1 By Component
7.3.2 By Application Type
7.3.3 By Organization Size
7.3.4 By Country
7.3.4.1 Germany Low Code Technology in Insurance Market Estimates and Forecast, 2021-2029 (USD Million)
7.3.4.1.1 By Component
7.3.4.1.2 By Application Type
7.3.4.1.3 By Organization Size
7.3.4.2 U.K. Low Code Technology in Insurance Market Estimates and Forecast, 2021-2029 (USD Million)
7.3.4.2.1 By Component
7.3.4.2.2 By Application Type
7.3.4.2.3 By Organization Size
7.3.4.3 France Low Code Technology in Insurance Market Estimates and Forecast, 2021-2029 (USD Million)
7.3.4.3.1 By Component
7.3.4.3.2 By Application Type
7.3.4.3.3 By Organization Size
7.3.4.4 Italy Low Code Technology in Insurance Market Estimates and Forecast, 2021-2029 (USD Million)
7.3.4.4.1 By Component
7.3.4.4.2 By Application Type
7.2.4.4.3 By Organization Size
7.3.4.5 Spain Low Code Technology in Insurance Market Estimates and Forecast, 2021-2029 (USD Million)
7.3.4.5.1 By Component
7.3.4.5.2 By Application Type
7.2.4.5.3 By Organization Size
7.3.4.6 Netherlands Low Code Technology in Insurance Market Estimates and Forecast, 2021-2029 (USD Million)
7.3.4.6.1 By Component
7.3.4.6.2 By Application Type
7.2.4.6.3 By Organization Size
7.3.4.7 Rest of Europe Low Code Technology in Insurance Market Estimates and Forecast, 2021-2029 (USD Million)
7.3.4.7.1 By Component
7.3.4.7.2 By Application Type
7.2.4.7.3 By Organization Size
7.4 Asia Pacific Low Code Technology in Insurance Market Estimates and Forecast, 2021-2029 (USD Million)
7.4.1 By Component
7.4.2 By Application Type
7.4.3 By Organization Size
7.4.4 By Country
7.4.4.1 China Low Code Technology in Insurance Market Estimates and Forecast, 2021-2029 (USD Million)
7.4.4.1.1 By Component
7.4.4.1.2 By Application Type
7.4.4.1.3 By Organization Size
7.4.4.2 Japan Low Code Technology in Insurance Market Estimates and Forecast, 2021-2029 (USD Million)
7.4.4.2.1 By Component
7.4.4.2.2 By Application Type
7.4.4.2.3 By Organization Size
7.4.4.3 India Low Code Technology in Insurance Market Estimates and Forecast, 2021-2029 (USD Million)
7.4.4.3.1 By Component
7.4.4.3.2 By Application Type
7.4.4.3.3 By Organization Size
7.4.4.4 South Korea Low Code Technology in Insurance Market Estimates and Forecast, 2021-2029 (USD Million)
7.4.4.4.1 By Component
7.4.4.4.2 By Application Type
7.4.4.4.3 By Organization Size
7.4.4.5 Singapore Low Code Technology in Insurance Market Estimates and Forecast, 2021-2029 (USD Million)
7.4.4.5.1 By Component
7.4.4.5.2 By Application Type
7.4.4.5.3 By Organization Size
7.4.4.6 Malaysia Low Code Technology in Insurance Market Estimates and Forecast, 2021-2029 (USD Million)
7.4.4.6.1 By Component
7.4.4.6.2 By Application Type
7.4.4.6.3 By Organization Size
7.4.4.7 Thailand Low Code Technology in Insurance Market Estimates and Forecast, 2021-2029 (USD Million)
7.4.4.7.1 By Component
7.4.4.7.2 By Application Type
7.4.4.7.3 By Organization Size
7.4.4.8 Indonesia Low Code Technology in Insurance Market Estimates and Forecast, 2021-2029 (USD Million)
7.4.4.8.1 By Component
7.4.4.8.2 By Application Type
7.4.4.8.3 By Organization Size
7.4.4.9 Vietnam Low Code Technology in Insurance Market Estimates and Forecast, 2021-2029 (USD Million)
7.4.4.9.1 By Component
7.4.4.9.2 By Application Type
7.4.4.9.3 By Organization Size
7.4.4.10 Taiwan Low Code Technology in Insurance Market Estimates and Forecast, 2021-2029 (USD Million)
7.4.4.10.1 By Component
7.4.4.10.2 By Application Type
7.4.4.10.3 By Organization Size
7.4.4.11 Rest of Asia Pacific Low Code Technology in Insurance Market Estimates and Forecast, 2021-2029 (USD Million)
7.4.4.11.1 By Component
7.4.4.11.2 By Application Type
7.4.4.11.3 By Organization Size
7.5 Middle East & Africa Low Code Technology in Insurance Market Estimates and Forecast, 2021-2029 (USD Million)
7.5.1 By Component
7.5.2 By Application Type
7.5.3 By Organization Size
7.5.4 By Country
7.5.4.1 Saudi Arabia Low Code Technology in Insurance Market Estimates and Forecast, 2021-2029 (USD Million)
7.5.4.1.1 By Component
7.5.4.1.2 By Application Type
7.5.4.1.3 By Organization Size
7.5.4.2 U.A.E. Low Code Technology in Insurance Market Estimates and Forecast, 2021-2029 (USD Million)
7.5.4.2.1 By Component
7.5.4.2.2 By Application Type
7.5.4.2.3 By Organization Size
7.5.4.3 Israel Low Code Technology in Insurance Market Estimates and Forecast, 2021-2029 (USD Million)
7.5.4.3.1 By Component
7.5.4.3.2 By Application Type
7.5.4.3.3 By Organization Size
7.5.4.4 South Africa Low Code Technology in Insurance Market Estimates and Forecast, 2021-2029 (USD Million)
7.5.4.4.1 By Component
7.5.4.4.2 By Application Type
7.5.4.4.3 By Organization Size
7.5.4.5 Rest of Middle East & Africa Low Code Technology in Insurance Market Estimates and Forecast, 2021-2029 (USD Million)
7.5.4.5.1 By Component
7.5.4.5.2 By Application Type
7.5.4.5.2 By Organization Size
7.6 Central & South America Low Code Technology in Insurance Market Estimates and Forecast, 2021-2029 (USD Million)
7.6.1 By Component
7.6.2 By Application Type
7.6.3 By Organization Size
7.6.4 By Country
7.6.4.1 Brazil Low Code Technology in Insurance Market Estimates and Forecast, 2021-2029 (USD Million)
7.6.4.1.1 By Component
7.6.4.1.2 By Application Type
7.6.4.1.3 By Organization Size
7.6.4.2 Argentina Eaporative Air Cooler Market Estimates and Forecast, 2021-2029 (USD Million)
7.6.4.2.1 By Component
7.6.4.2.2 By Application Type
7.6.4.2.3 By Organization Size
7.6.4.3 Chile Low Code Technology in Insurance Market Estimates and Forecast, 2021-2029 (USD Million)
7.6.4.3.1 By Component
7.6.4.3.2 By Application Type
7.6.4.3.3 By Organization Size
7.6.4.4 Rest of Central & South America Low Code Technology in Insurance Market Estimates and Forecast, 2021-2029 (USD Million)
7.6.4.4.1 By Component
7.6.4.4.2 By Application Type
7.6.4.4.3 By Organization Size
8 COMPETITIVE LANDCAPE
8.1 Company Market Share Analysis
8.2 Four Quadrant Positioning Matrix
8.2.1 Market Leaders
8.2.2 Market Visionaries
8.2.3 Market Challengers
8.2.4 Niche Market Players
8.3 Vendor Landscape
8.3.1 North America
8.3.2 Europe
8.3.3 Asia Pacific
8.3.4 Rest of the World
8.4 Company Profiles
8.4.1 Adacta
8.4.1.1 Business Description & Financial Analysis
8.4.1.2 SWOT Analysis
8.4.1.3 Products & Services Offered
8.4.1.4 Strategic Alliances between Business Partners
8.4.2 Appian
8.4.2.1 Business Description & Financial Analysis
8.4.2.2 SWOT Analysis
8.4.2.3 Products & Services Offered
8.4.2.4 Strategic Alliances between Business Partners
8.4.3 Majesco
8.4.3.1 Business Description & Financial Analysis
8.4.3.2 SWOT Analysis
8.4.3.3 Products & Services Offered
8.4.3.4 Strategic Alliances between Business Partners
8.4.4 INSTANDA
8.4.4.1 Business Description & Financial Analysis
8.4.4.2 SWOT Analysis
8.4.4.3 Products & Services Offered
8.4.4.4 Strategic Alliances between Business Partners
8.4.5 EXL
8.4.5.1 Business Description & Financial Analysis
8.4.5.2 SWOT Analysis
8.4.5.3 Products & Services Offered
8.4.5.4 Strategic Alliances between Business Partners
8.4.6 COVERGO
8.4.6.1 Business Description & Financial Analysis
8.4.6.2 SWOT Analysis
8.4.6.3 Products & Services Offered
8.4.6.4 Strategic Alliances between Business Partners
8.4.7 INSILLION
8.4.7.1 Business Description & Financial Analysis
8.4.7.2 SWOT Analysis
8.4.7.3 Products & Services Offered
8.4.8.4 Strategic Alliances between Business Partners
8.4.8 Digital Insurance Group
8.4.8.1 Business Description & Financial Analysis
8.4.8.2 SWOT Analysis
8.4.8.3 Products & Services Offered
8.4.8.4 Strategic Alliances between Business Partners
8.4.9 XEBIA
8.4.9.1 Business Description & Financial Analysis
8.4.9.2 SWOT Analysis
8.4.9.3 Products & Services Offered
8.4.9.4 Strategic Alliances between Business Partners
8.4.10 OnBase
8.4.10.1 Business Description & Financial Analysis
8.4.10.2 SWOT Analysis
8.4.10.3 Products & Services Offered
8.4.10.4 Strategic Alliances between Business Partners
8.4.11 Other Companies
8.4.11.1 Business Description & Financial Analysis
8.4.11.2 SWOT Analysis
8.4.11.3 Products & Services Offered
8.4.11.4 Strategic Alliances between Business Partners
9 RESEARCH METHODOLOGY
9.1 Market Introduction
9.1.1 Market Definition
9.1.2 Market Scope & Segmentation
9.2 Information Procurement
9.2.1 Secondary Research
9.2.1.1 Purchased Databases
9.2.1.2 GMEs Internal Data Repository
9.2.1.3 Secondary Resources & Third Party Perspectives
9.2.1.4 Company Information Sources
9.2.2 Primary Research
9.2.2.1 Various Types of Respondents for Primary Interviews
9.2.2.2 Number of Interviews Conducted throughout the Research Process
9.2.2.3 Primary Stakeholders
9.2.2.4 Discussion Guide for Primary Participants
9.2.3 Expert Panels
9.2.3.1 Expert Panels Across 30+ Industry
9.2.4 Paid Local Experts
9.2.4.1 Paid Local Experts Across 30+ Industry Across each Region
9.3 Market Estimation
9.3.1 Top-Down Approach
9.3.1.1 Macro-Economic Indicators Considered
9.3.1.2 Micro-Economic Indicators Considered
9.3.2 Bottom Up Approach
9.3.2.1 Company Share Analysis Approach
9.3.2.2 Estimation of Potential Product Sales
9.4 Data Triangulation
9.4.1 Data Collection
9.4.2 Time Series, Cross Sectional & Panel Data Analysis
9.4.3 Cluster Analysis
9.5 Analysis and Output
9.5.1 Inhouse AI Based Real Time Analytics Tool
9.5.2 Output From Desk & Primary Research
9.6 Research Assumptions & Limitations
9.7.1 Research Assumptions
9.7.2 Research Limitations
LIST OF TABLES
1 Global Low Code Technology in Insurance Market, By Component, 2021-2029 (USD Mllion)
2 Platform Market, By Region, 2021-2029 (USD Mllion)
3 Services Market, By Region, 2021-2029 (USD Mllion)
4 Global Low Code Technology in Insurance Market, By Application Type, 2021-2029 (USD Mllion)
5 Web-based Market, By Region, 2021-2029 (USD Mllion)
6 Mobile-based Market, By Region, 2021-2029 (USD Mllion)
7 Desktop and Server-based Market, By Region, 2021-2029 (USD Mllion)
8 Global Low Code Technology in Insurance Market, By Organization Size, 2021-2029 (USD Mllion)
9 SMEs Market, By Region, 2021-2029 (USD Mllion)
10 LARGE ENTERPRISES Market, By Region, 2021-2029 (USD Mllion)
11 Regional Analysis, 2021-2029 (USD Mllion)
12 North America Low Code Technology in Insurance Market, By Component, 2021-2029 (USD Million)
13 North America Low Code Technology in Insurance Market, By Application Type, 2021-2029 (USD Million)
14 North America Low Code Technology in Insurance Market, By Organization Size, 2021-2029 (USD Million)
15 North America Low Code Technology in Insurance Market, By Country, 2021-2029 (USD Million)
16 U.S Low Code Technology in Insurance Market, By Component, 2021-2029 (USD Million)
17 U.S Low Code Technology in Insurance Market, By Application Type, 2021-2029 (USD Million)
18 U.S Low Code Technology in Insurance Market, By Organization Size, 2021-2029 (USD Million)
19 Canada Low Code Technology in Insurance Market, By Component, 2021-2029 (USD Million)
20 Canada Low Code Technology in Insurance Market, By Application Type, 2021-2029 (USD Million)
21 Canada Low Code Technology in Insurance Market, By Organization Size, 2021-2029 (USD Million)
22 Mexico Low Code Technology in Insurance Market, By Component, 2021-2029 (USD Million)
23 Mexico Low Code Technology in Insurance Market, By Application Type, 2021-2029 (USD Million)
24 Mexico Low Code Technology in Insurance Market, By Organization Size, 2021-2029 (USD Million)
25 Europe Low Code Technology in Insurance Market, By Component, 2021-2029 (USD Million)
26 Europe Low Code Technology in Insurance Market, By Application Type, 2021-2029 (USD Million)
27 Europe Low Code Technology in Insurance Market, By Organization Size, 2021-2029 (USD Million)
28 Germany Low Code Technology in Insurance Market, By Component, 2021-2029 (USD Million)
29 Germany Low Code Technology in Insurance Market, By Application Type, 2021-2029 (USD Million)
30 Germany Low Code Technology in Insurance Market, By Organization Size, 2021-2029 (USD Million)
31 UK Low Code Technology in Insurance Market, By Component, 2021-2029 (USD Million)
32 UK Low Code Technology in Insurance Market, By Application Type, 2021-2029 (USD Million)
33 UK Low Code Technology in Insurance Market, By Organization Size, 2021-2029 (USD Million)
34 France Low Code Technology in Insurance Market, By Component, 2021-2029 (USD Million)
35 France Low Code Technology in Insurance Market, By Application Type, 2021-2029 (USD Million)
36 France Low Code Technology in Insurance Market, By Organization Size, 2021-2029 (USD Million)
37 Italy Low Code Technology in Insurance Market, By Component, 2021-2029 (USD Million)
38 Italy Low Code Technology in Insurance Market, By T End Use Type, 2021-2029 (USD Million)
39 Italy Low Code Technology in Insurance Market, By Organization Size, 2021-2029 (USD Million)
40 Spain Low Code Technology in Insurance Market, By Component, 2021-2029 (USD Million)
41 Spain Low Code Technology in Insurance Market, By Application Type, 2021-2029 (USD Million)
42 Spain Low Code Technology in Insurance Market, By Organization Size, 2021-2029 (USD Million)
43 Rest Of Europe Low Code Technology in Insurance Market, By Component, 2021-2029 (USD Million)
44 Rest Of Europe Low Code Technology in Insurance Market, By Application Type, 2021-2029 (USD Million)
45 Rest of Europe Low Code Technology in Insurance Market, By Organization Size, 2021-2029 (USD Million)
46 Asia Pacific Low Code Technology in Insurance Market, By Component, 2021-2029 (USD Million)
47 Asia Pacific Low Code Technology in Insurance Market, By Application Type, 2021-2029 (USD Million)
48 Asia Pacific Low Code Technology in Insurance Market, By Organization Size, 2021-2029 (USD Million)
49 Asia Pacific Low Code Technology in Insurance Market, By Country, 2021-2029 (USD Million)
50 China Low Code Technology in Insurance Market, By Component, 2021-2029 (USD Million)
51 China Low Code Technology in Insurance Market, By Application Type, 2021-2029 (USD Million)
52 China Low Code Technology in Insurance Market, By Organization Size, 2021-2029 (USD Million)
53 India Low Code Technology in Insurance Market, By Component, 2021-2029 (USD Million)
54 India Low Code Technology in Insurance Market, By Application Type, 2021-2029 (USD Million)
55 India Low Code Technology in Insurance Market, By Organization Size, 2021-2029 (USD Million)
56 Japan Low Code Technology in Insurance Market, By Component, 2021-2029 (USD Million)
57 Japan Low Code Technology in Insurance Market, By Application Type, 2021-2029 (USD Million)
58 Japan Low Code Technology in Insurance Market, By Organization Size, 2021-2029 (USD Million)
59 South Korea Low Code Technology in Insurance Market, By Component, 2021-2029 (USD Million)
60 South Korea Low Code Technology in Insurance Market, By Application Type, 2021-2029 (USD Million)
61 South Korea Low Code Technology in Insurance Market, By Organization Size, 2021-2029 (USD Million)
62 Malaysia Low Code Technology in Insurance Market, By Component, 2021-2029 (USD Million)
63 Malaysia Low Code Technology in Insurance Market, By Application Type, 2021-2029 (USD Million)
64 Malaysia Low Code Technology in Insurance Market, By Organization Size, 2021-2029 (USD Million)
65 Vietnam Low Code Technology in Insurance Market, By Component, 2021-2029 (USD Million)
66 Vietnam Low Code Technology in Insurance Market, By Application Type, 2021-2029 (USD Million)
67 Vietnam Low Code Technology in Insurance Market, By Organization Size, 2021-2029 (USD Million)
68 Rest of Asia Pacific Low Code Technology in Insurance Market, By Component, 2021-2029 (USD Million)
69 Rest of Asia Pacific Low Code Technology in Insurance Market, By Application Type, 2021-2029 (USD Million)
70 Rest of Asia Pacific Low Code Technology in Insurance Market, By Organization Size, 2021-2029 (USD Million)
71 Middle East & Africa Low Code Technology in Insurance Market, By Component, 2021-2029 (USD Million)
72 Middle East & Africa Low Code Technology in Insurance Market, By Application Type, 2021-2029 (USD Million)
73 Middle East & Africa Low Code Technology in Insurance Market, By Organization Size, 2021-2029 (USD Million)
74 Middle East & Africa Low Code Technology in Insurance Market, By Country, 2021-2029 (USD Million)
75 Saudi Arabia Low Code Technology in Insurance Market, By Component, 2021-2029 (USD Million)
76 Saudi Arabia Low Code Technology in Insurance Market, By Application Type, 2021-2029 (USD Million)
77 Saudi Arabia Low Code Technology in Insurance Market, By Organization Size, 2021-2029 (USD Million)
78 UAE Low Code Technology in Insurance Market, By Component, 2021-2029 (USD Million)
79 UAE Low Code Technology in Insurance Market, By Application Type, 2021-2029 (USD Million)
80 UAE Low Code Technology in Insurance Market, By Organization Size, 2021-2029 (USD Million)
81 Rest of Middle East and Africa Low Code Technology in Insurance Market, By Component, 2021-2029 (USD Million)
82 Rest of Middle East and Africa Low Code Technology in Insurance Market, By Application Type, 2021-2029 (USD Million)
83 Rest of Middle East and Africa Low Code Technology in Insurance Market, By Organization Size, 2021-2029 (USD Million)
84 Central & South America Low Code Technology in Insurance Market, By Component, 2021-2029 (USD Million)
85 Central & South America Low Code Technology in Insurance Market, By Application Type, 2021-2029 (USD Million)
86 Central & South America Low Code Technology in Insurance Market, By Organization Size, 2021-2029 (USD Million)
87 Central & South America Low Code Technology in Insurance Market, By Country, 2021-2029 (USD Million)
88 Brazil Low Code Technology in Insurance Market, By Component, 2021-2029 (USD Million)
89 Brazil Low Code Technology in Insurance Market, By Application Type, 2021-2029 (USD Million)
90 Brazil Low Code Technology in Insurance Market, By Organization Size, 2021-2029 (USD Million)
91 Argentina Low Code Technology in Insurance Market, By Component, 2021-2029 (USD Million)
92 Argentina Low Code Technology in Insurance Market, By Application Type, 2021-2029 (USD Million)
93 Argentina Low Code Technology in Insurance Market, By Organization Size, 2021-2029 (USD Million)
94 Rest of Central & South America Low Code Technology in Insurance Market, By Component, 2021-2029 (USD Million)
95 Rest of Central & South America Low Code Technology in Insurance Market, By Application Type, 2021-2029 (USD Million)
96 Rest of Central & South America Low Code Technology in Insurance Market, By Organization Size, 2021-2029 (USD Million)
97 Adacta: Products & Services Offering
98 Appian: Products & Services Offering
99 Majesco: Products & Services Offering
100 INSTANDA: Products & Services Offering
101 EXL: Products & Services Offering
102 COVERGO: Products & Services Offering
103 INSILLION: Products & Services Offering
104 Digital Insurance Group: Products & Services Offering
105 XEBIA: Products & Services Offering
106 OnBase: Products & Services Offering
107 Other Companies: Products & Services Offering
LIST OF FIGURES
1 Global Low Code Technology in Insurance Market Overview
2 Global Low Code Technology in Insurance Market Value From 2021-2029 (USD Mllion)
3 Global Low Code Technology in Insurance Market Share, By Component (2023)
4 Global Low Code Technology in Insurance Market Share, By Application Type (2023)
5 Global Low Code Technology in Insurance Market Share, By Organization Size (2023)
6 Global Low Code Technology in Insurance Market, By Region (Asia Pacific Market)
7 Technological Trends In Global Low Code Technology in Insurance Market
8 Four Quadrant Competitor Positioning Matrix
9 Impact Of Macro & Micro Indicators On The Market
10 Impact Of Key Drivers On The Global Low Code Technology in Insurance Market
11 Impact Of Challenges On The Global Low Code Technology in Insurance Market
12 Porter’s Five Forces Analysis
13 Global Low Code Technology in Insurance Market: By Component Scope Key Takeaways
14 Global Low Code Technology in Insurance Market, By Component Segment: Revenue Growth Analysis
15 Platform Market, By Region, 2021-2029 (USD Mllion)
16 Services Market, By Region, 2021-2029 (USD Mllion)
17 Global Low Code Technology in Insurance Market: By Application Type Scope Key Takeaways
18 Global Low Code Technology in Insurance Market, By Application Type Segment: Revenue Growth Analysis
19 Web-based Market, By Region, 2021-2029 (USD Mllion)
20 Mobile-based Market, By Region, 2021-2029 (USD Mllion)
21 Desktop and Server-based Market, By Region, 2021-2029 (USD Mllion)
22 Global Low Code Technology in Insurance Market: By Organization Size Scope Key Takeaways
23 Global Low Code Technology in Insurance Market, By Organization Size Segment: Revenue Growth Analysis
24 SMEs Market, By Region, 2021-2029 (USD Mllion)
25 Large Enterprises Market, By Region, 2021-2029 (USD Mllion)
26 Regional Segment: Revenue Growth Analysis
27 Global Low Code Technology in Insurance Market: Regional Analysis
28 North America Low Code Technology in Insurance Market Overview
29 North America Low Code Technology in Insurance Market, By Component
30 North America Low Code Technology in Insurance Market, By Application Type
31 North America Low Code Technology in Insurance Market, By Organization Size
32 North America Low Code Technology in Insurance Market, By Country
33 U.S. Low Code Technology in Insurance Market, By Component
34 U.S. Low Code Technology in Insurance Market, By Application Type
35 U.S. Low Code Technology in Insurance Market, By Organization Size
36 Canada Low Code Technology in Insurance Market, By Component
37 Canada Low Code Technology in Insurance Market, By Application Type
38 Canada Low Code Technology in Insurance Market, By Organization Size
39 Mexico Low Code Technology in Insurance Market, By Component
40 Mexico Low Code Technology in Insurance Market, By Application Type
41 Mexico Low Code Technology in Insurance Market, By Organization Size
42 Four Quadrant Positioning Matrix
43 Company Market Share Analysis
44 Adacta: Company Snapshot
45 Adacta: SWOT Analysis
46 Adacta: Geographic Presence
47 Appian: Company Snapshot
48 Appian: SWOT Analysis
49 Appian: Geographic Presence
50 Majesco: Company Snapshot
51 Majesco: SWOT Analysis
52 Majesco: Geographic Presence
53 INSTANDA: Company Snapshot
54 INSTANDA: Swot Analysis
55 INSTANDA: Geographic Presence
56 EXL: Company Snapshot
57 EXL: SWOT Analysis
58 EXL: Geographic Presence
59 COVERGO: Company Snapshot
60 COVERGO: SWOT Analysis
61 COVERGO: Geographic Presence
62 INSILLION: Company Snapshot
63 INSILLION: SWOT Analysis
64 INSILLION: Geographic Presence
65 Digital Insurance Group: Company Snapshot
66 Digital Insurance Group: SWOT Analysis
67 Digital Insurance Group: Geographic Presence
68 XEBIA.: Company Snapshot
69 XEBIA.: SWOT Analysis
70 XEBIA.: Geographic Presence
71 OnBase: Company Snapshot
72 OnBase: SWOT Analysis
73 OnBase: Geographic Presence
74 Other Companies: Company Snapshot
75 Other Companies: SWOT Analysis
76 Other Companies: Geographic Presence
The Global Low Code Technology in Insurance Market has been studied from the year 2019 till 2029. However, the CAGR provided in the report is from the year 2024 to 2029. The research methodology involved three stages: Desk research, Primary research, and Analysis & Output from the entire research process.

The desk research involved a robust background study which meant referring to paid and unpaid databases to understand the market dynamics; mapping contracts from press releases; identifying the key players in the market, studying their product portfolio, competition level, annual reports/SEC filings & investor presentations; and learning the demand and supply-side analysis for the Low Code Technology in Insurance Market.

The primary research activity included telephonic conversations with more than 50 tier 1 industry consultants, distributors, and end-use product manufacturers.

Finally, based on the above thorough research process, an in-depth analysis was carried out considering the following aspects: market attractiveness, current & future market trends, market share analysis, SWOT analysis of the company and customer analytics.

Frequently Asked Questions

This FREE sample includes market data points, ranging from trend analyses to market estimates & forecasts. See for yourself.
Or view our licence options:
Tailor made solutions just for you
80% of our clients seek made-to-order reports. How do you want us to tailor yours?
OUR CLIENTS


