This report was recently updated on August 27 2025 with the latest and most recent
market numbers
Global Marine Big Data Market Size, Trends & Analysis - Forecasts to 2027 By Software (Data Analytics, Data Collection, Data Discovery & Visualization Data Management), By Services (Consulting, System Integration and Operation Maintenance), By Application (Renewable Energy, Oil & Gas, Fishery, Whale Watching, Marine Protected Area, Dredging, Harbor, Offshore Construction), By Type of Data Source (Environmental, Oceanographic, Geological Data, Economic), By Region (North America, Asia Pacific, Central, and South America, Europe, and the Middle East and Africa), Competitive Landscape Company Market Share Analysis, and Competitor Analysis
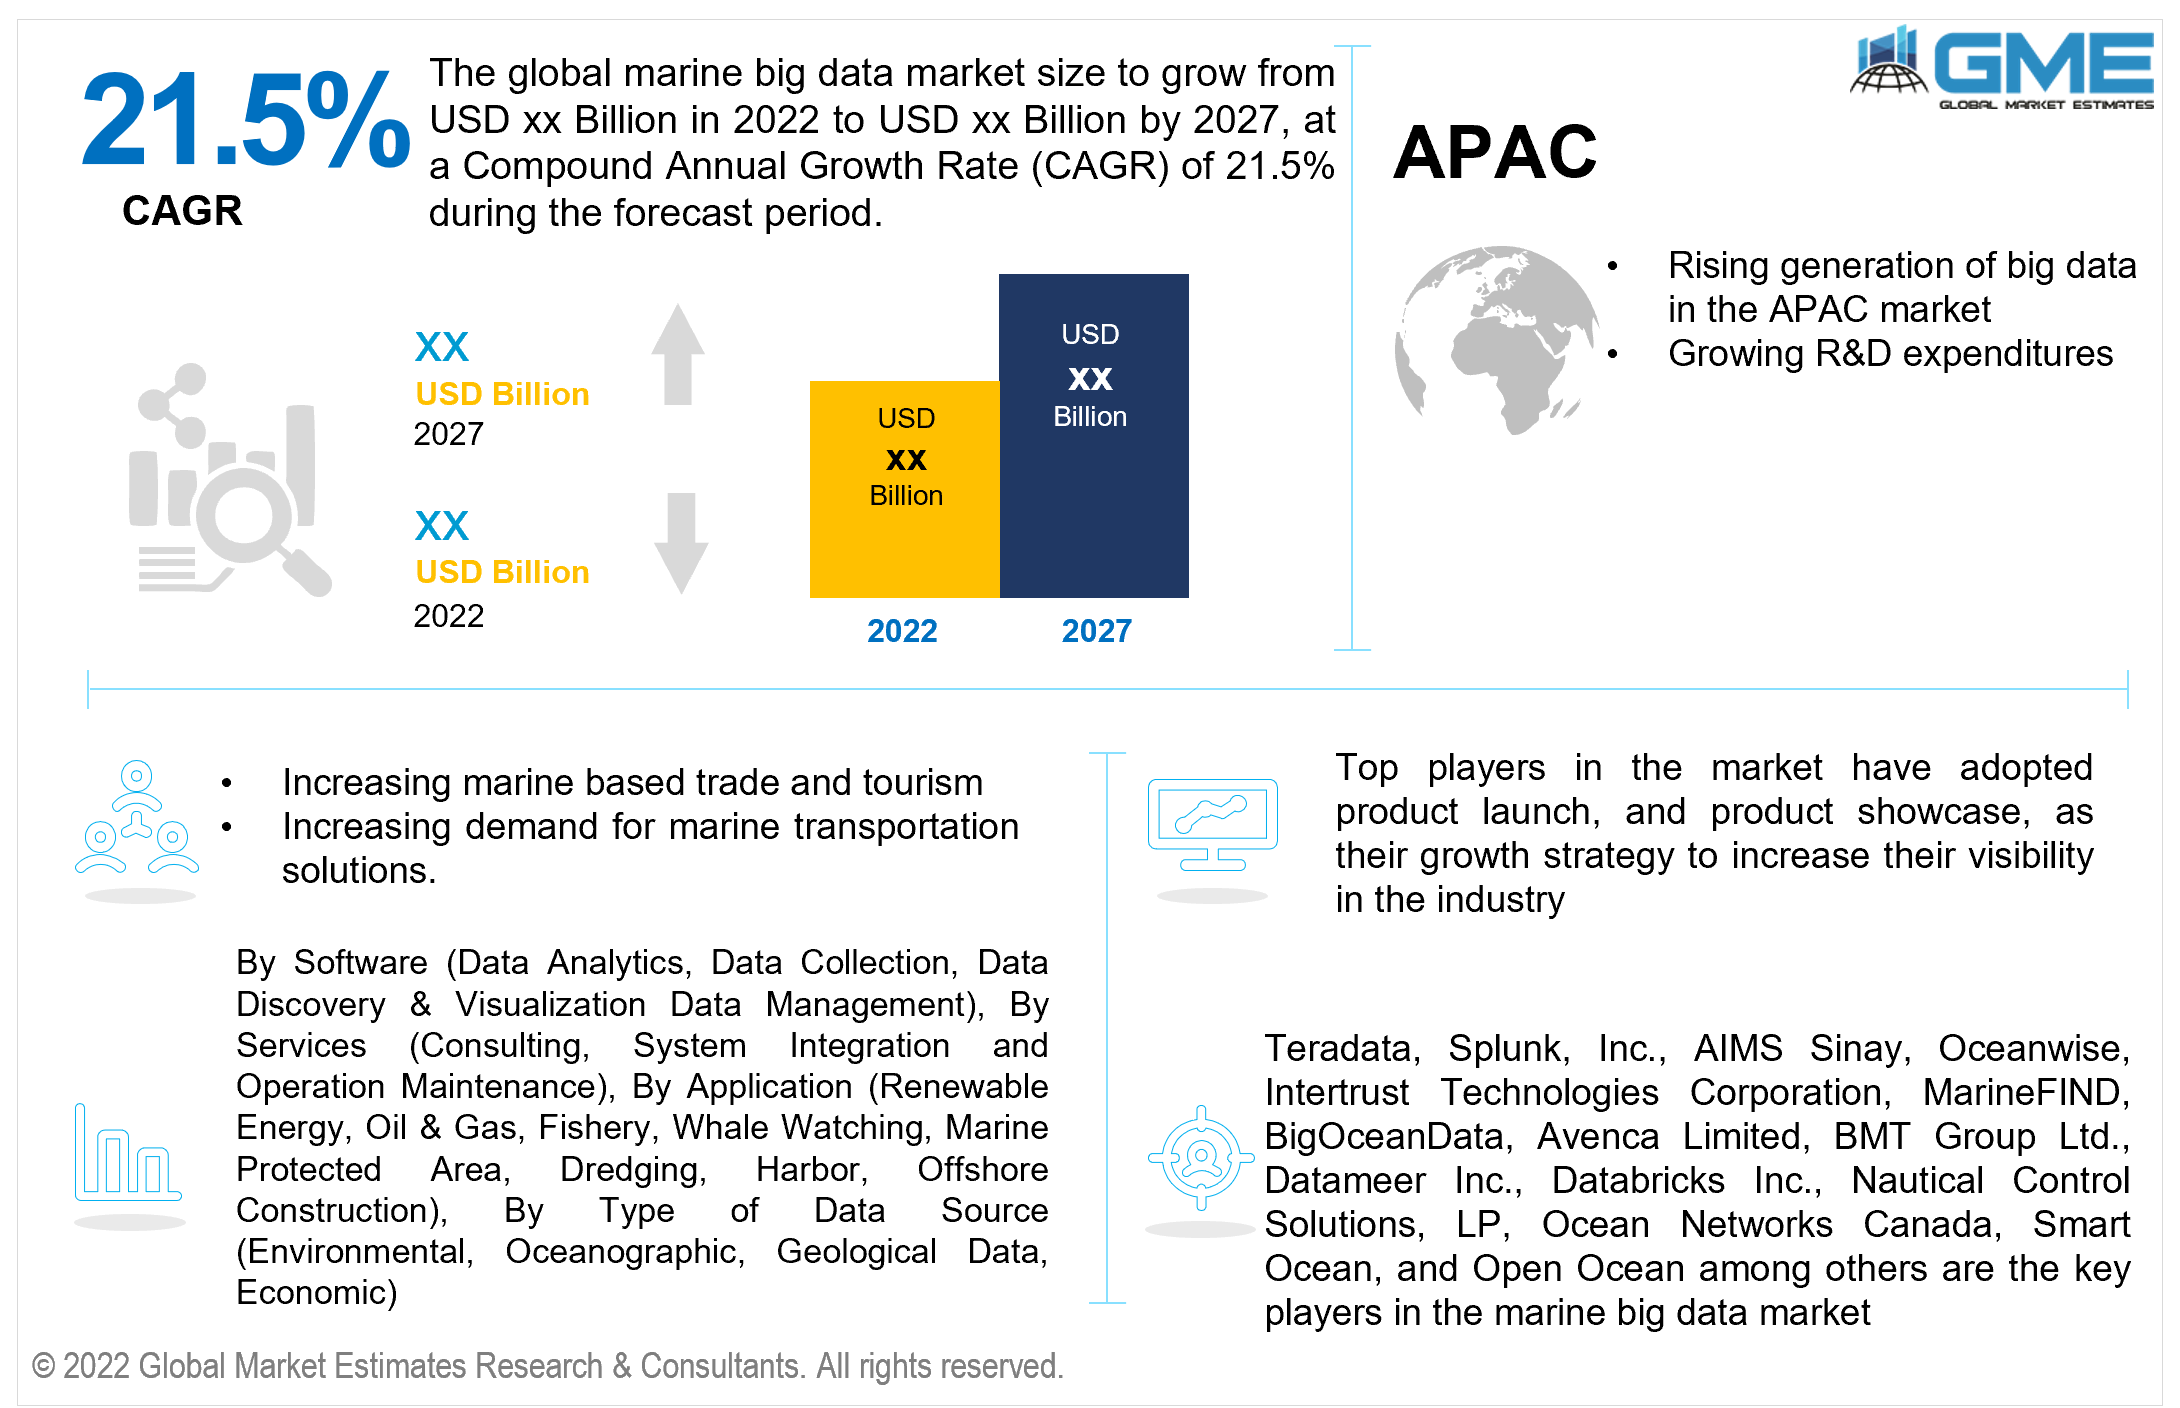
The Global Marine Big Data Market is projected to grow at a CAGR value of 21.5% from 2022 to 2027.
The advent of a massive generation of information has led to the revolutionizing concept of big data, which has conquered every sector of the economy due to its ability to solve problems and predict forecasts almost accurately. Marine transportation handles approximately 90% of trade worldwide, leading to huge data generation. Big data has helped the shipping and maritime industry grow at a more robust pace over the past few years. The operational efficiency of ships and vessels has improved because of the effective harnessing of big data. Big data is also used to control ship sensors, track lost containers and vessels, and create reliable ways to deliver goods and commodities.
The market will be driven during the forecast period by the exponential growth of big data in the maritime industry, increasing demand for integration of digitalization of marine transportation, rise in trade and transportation via vessels and ships, and growing demand for more efficient operational processes in the shipping industry.
Furthermore, rising investments by governments and organizations in the maritime industry due to the increase in globalized trade is also a factor that will boost the marine big data market.
The COVID-19 pandemic has exacerbated trade issues relating to the maritime industry tremendously. The unavailability of vessels, restrictions on the entry of cargo ships in various regions, and pricing competition during the pandemic have harmed the naval industry. However, big data can lead to timely communication between traders and customers and can lead to the mitigation of trade volatility. The maritime industry has realized the need for optimizing the maintenance of shipping vessels during the pandemic. Big data is used to understand the lifetime reliability of vessels and help in reducing costs spent on inventory. The post-pandemic situation is expected to boost the marine big data market owing to the growing awareness of the essential benefits that the generation of big data provides to the industry.
The transportation and logistics industry has seen severe disruptions in its activity owing to the conflict between Russia and Ukraine. Disruption in trade routes owing to blockades in the Black Sea and other shipping routes has seen a fall in demand for shipping through seaways. With major shipping companies stopping services to and from Russia, the demand for marine services is expected to fall in the two countries.
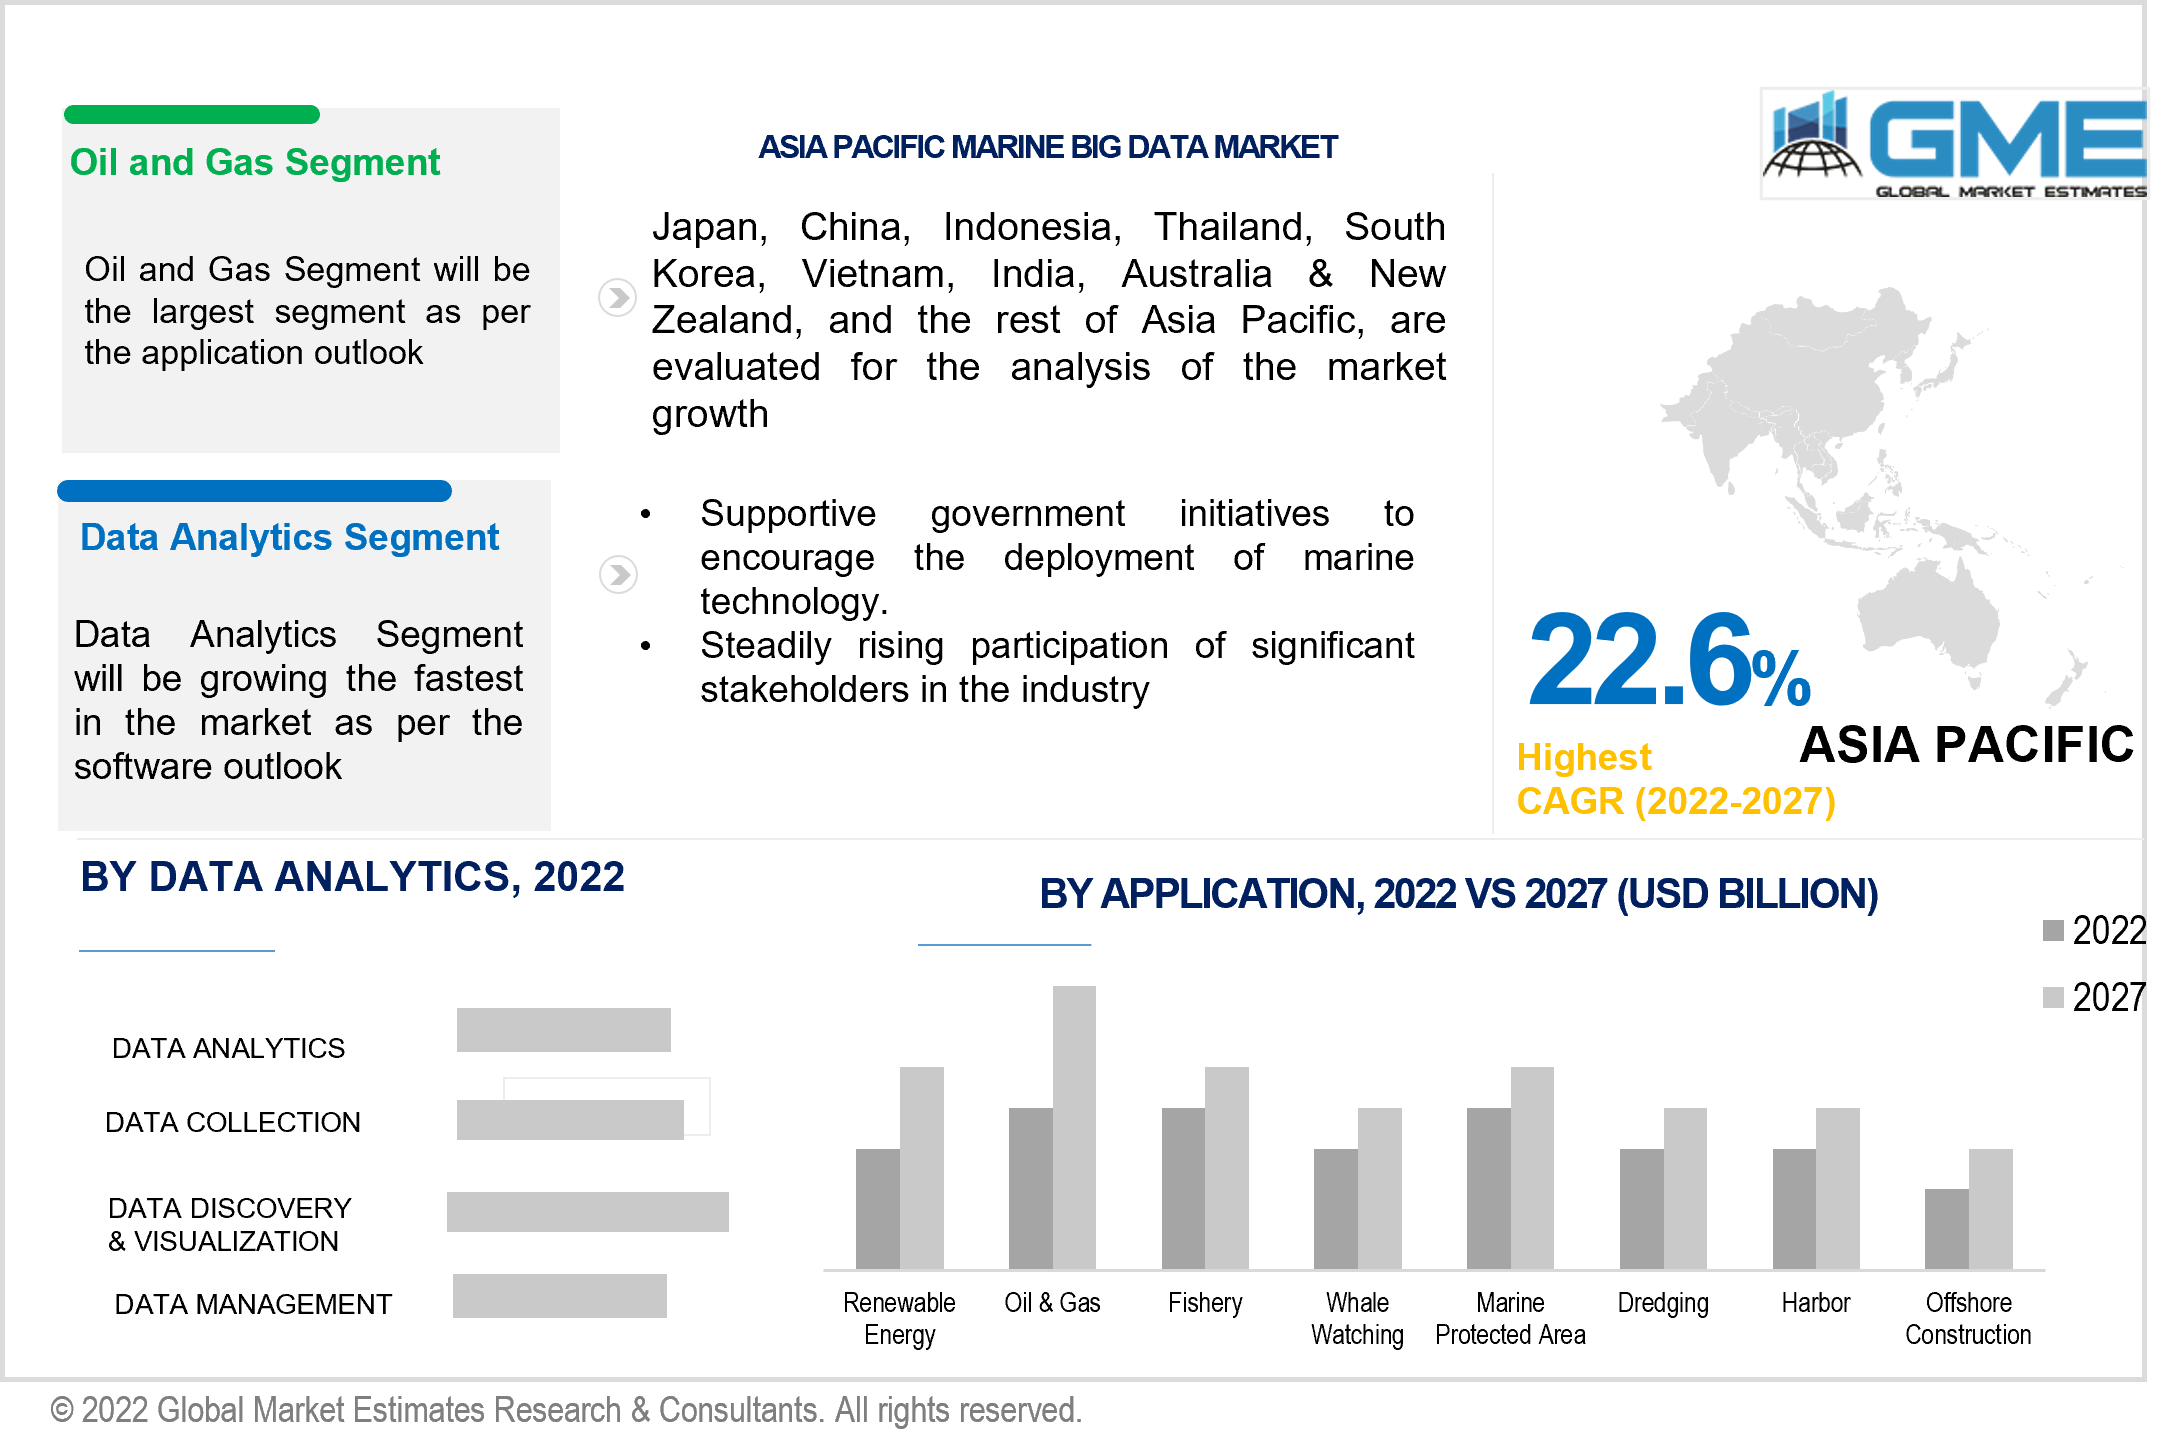
Data analytics is expected to be the fastest-growing segment in the market from 2022 to 2027.
Data analytics play a huge role in enhancing maritime operations by reducing time and decreasing the environmental impact of the emission of fossil fuels. Data analytics discovers correlations between several variables to come up with trends and predictions that would increase the optimality of shipping operations. Data analytics also provide performance prediction of onboard vessels and solutions to ship operators.
The consulting segment is expected to be the largest segment in the market from 2022 to 2027.
Several leading companies provide consulting teams to shipping industries in order to create profitable solutions in maritime trade and transport. Stagnating revenue, overcapacity, and lack of profitability have plagued the maritime industry. Shipping consultancies provide offerings such as logistics solutions to attain efficiency, save costs, and lead to a larger customer base.
The oil and gas segment is expected to be the largest segment in the market from 2022 to 2027.
Oil and gas delivery done through marine transportation makes use of big data for more optimal performance. Big data on oil-gas distribution help in the utilization of marine resources. Big data in the oil and gas industry also help in maritime exploration for newer sources of oil due to the increasing price competitive nature of oil and gas.
The economic segment is expected to be the largest segment from 2022 to 2027.
Economic data sources form an important part of the trade and transportation between countries. Economic big data in marine transportation also helps transparency between government institutions, traders, and customers.
North America (the United States, Canada, and Mexico) will have a dominant share in the Marine Big Data market from 2022 to 2027. The major factor driving the growth of the market in the North American region is due to increasing marine trade and transportation, the rising generation of marine data from a wide variety of sources, and the growing demand for logistics solutions for marine-based imports and export.
Moreover, the Asia Pacific (India, China, Japan, Malaysia, Singapore, and the Rest of Asia Pacific) region is expected to be the fastest-growing segment in the Marine Big Data market during the forecast period. Rapidly rising export and import activities via waterways, increasing technological developments in the maritime industry, and large investments by shipping corporations in the region will propel the marine big data market.
Marine Big Data Market Share and Competitor Analysis
Teradata, Splunk, Inc., AIMS Sinay, Oceanwise, Intertrust Technologies Corporation, MarineFIND, BigOceanData, Avenca Limited, BMT Group Ltd., Datameer Inc., Databricks Inc., Nautical Control Solutions, LP, Ocean Networks Canada, Smart Ocean, and Open Ocean among others are the key players in the marine big data market.
Please note: This is not an exhaustive list of companies profiled in the report.
Chapter 1 Research Methodology
1.1 Research Assumptions
1.2 Research Methodology
1.2.1 Estimates and Forecast Timeline
1.3 Information Procurement
1.3.1 Purchased Database
1.3.2 GME’s Internal Database
1.3.3 Primary Research
1.3.4 Secondary Sources & Third-Party Perspectives
1.3.4.1 Company Information Sources: Annual Reports, Investor Presentation, Press Release, SEC Filing, Company Blogs & Website
1.3.4.2 Secondary Data Sources: Microsoft Corporation, Elsevier, Thomson Reuters, IBM Publications and Database
1.4 Information or Data Analysis
1.4.1 Data Analysis Models
1.5 Market Services & Data Visualization
1.6 Data Validation & Publishing
1.7 Market Model
1.7.1 Model Details
1.7.1.1 Top-Down Approach
1.7.1.2 Bottom-Up Approach
1.8 Market Segmentation & Scope
1.9 Market Definition
Chapter 2 Executive Summary
2.1. Global Market Outlook
2.2 Software Outlook
2.3 Application Outlook
2.4 Services Outlook
2.5 Type of Data Source Outlook
2.6 Regional Outlook
Chapter 3 Global Marine Actuators and Valves Market Trend Analysis
3.1. Market Introduction
3.2 Penetration & Growth Prospect Mapping
3.3 Impact of COVID-19 on the Marine Actuators and Valves Market
3.4 Metric Data on Shipping & Logistics Industry
3.5 Market Dynamic
3.5.1 Market Driver Analysis
3.5.2 Market Restraint Analysis
3.5.3 Industry Challenges
3.5.4 Industry Opportunities
3.6 Porter’s Five Analysis
3.6.1 Supplier Power
3.6.2 Buyer Power
3.6.3 Substitution Threat
3.6.4 Threat from New Entrant
3.7 Market Entry Strategies
Chapter 4 Marine Actuators and Valves Market: Software Trend Analysis
4.1 Software: Historic Data vs. Forecast Data Analysis, 2021 vs. 2027
4.2 Data Analytics
4.2.1 Market Estimates & Forecast Analysis of Data Analytics Segment, By Region, 2019-2027 (USD Billion)
4.3 Data Collection
4.3.1 Market Estimates & Forecast Analysis of Data Collection Markets Segment, By Region, 2019-2027 (USD Billion)
4.4 Data Discovery & Visualization Data Management
4.4.1 Market Estimates & Forecast Analysis of Data Discovery & Visualization Data Management Markets Segment, By Region, 2019-2027 (USD Billion)
Chapter 5 Marine Actuators and Valves Market: Application Trend Analysis
5.1 Application: Historic Data vs. Forecast Data Analysis, 2021 vs. 2027
5.2 Renewable Energy
5.2.1 Market Estimates & Forecast Analysis of Renewable Energy Segment, By Region, 2019-2027 (USD Billion)
5.3 Oil & Gas
5.3.1 Market Estimates & Forecast Analysis of Oil & Gas Segment, By Region, 2019-2027 (USD Billion)
5.4 Fishery
5.4.1 Market Estimates & Forecast Analysis of Fishery Segment, By Region, 2019-2027 (USD Billion)
5.5 Whale Watching
5.5.1 Market Estimates & Forecast Analysis of Whale Watching Segment, By Region, 2019-2027 (USD Billion)
5.6 Marine Protected Area
5.6.1 Market Estimates & Forecast Analysis of Marine Protected Area Segment, By Region, 2019-2027 (USD Billion)
5.7 Dredging
5.7.1 Market Estimates & Forecast Analysis of Dredging Segment, By Region, 2019-2027 (USD Billion)
5.8 Harbor
5.8.1 Market Estimates & Forecast Analysis of Harbor Segment, By Region, 2019-2027 (USD Billion)
5.9 Offshore Construction
5.9.1 Market Estimates & Forecast Analysis of Offshore Construction Segment, By Region, 2019-2027 (USD Billion)
Chapter 6 Marine Actuators and Valves Market: Services Trend Analysis
6.1 Services: Historic Data vs. Forecast Data Analysis, 2021 vs. 2027
6.2 Consulting
6.2.1 Market Estimates & Forecast Analysis of Consulting Segment, By Region, 2019-2027 (USD Billion)
6.3 System Integration and Operation Maintenance
6.3.1 Market Estimates & Forecast Analysis of System Integration and Operation Maintenance Segment, By Region, 2019-2027 (USD Billion)
Chapter 7 Marine Actuators and Valves Market: Type of Data Source Trend Analysis
7.1 Type of Data Source: Historic Data vs. Forecast Data Analysis, 2021 vs. 2027
7.2 Environmental
7.2.1 Market Estimates & Forecast Analysis of Environmental Segment, By Region, 2019-2027 (USD Billion)
7.3 Oceanographic
7.3.1 Market Estimates & Forecast Analysis of Oceanographic Segment, By Region, 2019-2027 (USD Billion)
7.4 Geological Data
7.4.1 Market Estimates & Forecast Analysis of Geological Data Segment, By Region, 2019-2027 (USD Billion)
7.5 Economic
7.5.1 Market Estimates & Forecast Analysis of Economic Segment, By Region, 2019-2027 (USD Billion)
Chapter 8 Marine Actuators and Valves Market, By Region
8.1 Regional Outlook
8.2 North America
8.2.1 Market Estimates & Forecast Analysis, By Country 2019-2027(USD Billion)
8.2.2 Market Estimates & Forecast Analysis, By Software, 2019-2027(USD Billion)
8.2.3 Market Estimates & Forecast Analysis, By Application, 2019-2027(USD Billion)
8.2.4 Market Estimates & Forecast Analysis, By Services, 2019-2027(USD Billion)
8.2.5 Market Estimates & Forecast Analysis, By Type of Data Source, 2019-2027(USD Billion)
8.2.6 U.S.
8.2.6.1 Market Estimates & Forecast Analysis, By Software, 2019-2027(USD Billion)
8.2.6.2 Market Estimates & Forecast Analysis, By Application, 2019-2027(USD Billion)
8.2.6.3 Market Estimates & Forecast Analysis, By Services, 2019-2027(USD Billion)
8.2.6.4 Market Estimates & Forecast Analysis, By Type of Data Source, 2019-2027(USD Billion)
8.2.7 Canada
8.2.7.1 Market Estimates & Forecast Analysis, By Software, 2019-2027(USD Billion)
8.2.7.2 Market Estimates & Forecast Analysis, By Application, 2019-2027(USD Billion)
8.2.7.3 Market Estimates & Forecast Analysis, By Services, 2019-2027(USD Billion)
8.2.7.4 Market Estimates & Forecast Analysis, By Type of Data Source, 2019-2027(USD Billion)
8.2.8 Mexico
8.2.8.1 Market Estimates & Forecast Analysis, By Software, 2019-2027 (USD Billion)
8.2.8.2 Market Estimates & Forecast Analysis, By Application, 2019-2027 (USD Billion)
8.2.8.3 Market Estimates & Forecast Analysis, By Services, 2019-2027 (USD Billion)
8.2.8.4 Market Estimates & Forecast Analysis, By Type of Data Source, 2019-2027(USD Billion)
8.3 Europe
8.3.1 Market Estimates & Forecast Analysis, By Country 2019-2027(USD Billion)
8.3.2 Market Estimates & Forecast Analysis, By Software, 2019-2027(USD Billion)
8.3.3 Market Estimates & Forecast Analysis, By Application, 2019-2027(USD Billion)
8.3.4 Market Estimates & Forecast Analysis, By Services, 2019-2027(USD Billion)
8.3.5 Market Estimates & Forecast Analysis, By Type of Data Source, 2019-2027(USD Billion)
8.3.6 Germany
8.3.6.1 Market Estimates & Forecast Analysis, By Software, 2019-2027(USD Billion)
8.3.6.2 Market Estimates & Forecast Analysis, By Application, 2019-2027(USD Billion)
8.3.6.3 Market Estimates & Forecast Analysis, By Services, 2019-2027(USD Billion)
8.3.6.4 Market Estimates & Forecast Analysis, By Type of Data Source, 2019-2027(USD Billion)
8.3.7 UK
8.3.7.1 Market Estimates & Forecast Analysis, By Software, 2019-2027(USD Billion)
8.3.7.2 Market Estimates & Forecast Analysis, By Application, 2019-2027(USD Billion)
8.3.7.3 Market Estimates & Forecast Analysis, By Services, 2019-2027(USD Billion)
8.3.7.4 Market Estimates & Forecast Analysis, By Type of Data Source, 2019-2027(USD Billion)
8.3.8 France
8.3.8.1 Market Estimates & Forecast Analysis, By Software, 2019-2027(USD Billion)
8.3.8.2 Market Estimates & Forecast Analysis, By Application, 2019-2027(USD Billion)
8.3.8.3 Market Estimates & Forecast Analysis, By Services, 2019-2027(USD Billion)
8.3.8.4 Market Estimates & Forecast Analysis, By Type of Data Source, 2019-2027(USD Billion)
8.3.9 Russia
8.3.9.1 Market Estimates & Forecast Analysis, By Software, 2019-2027(USD Billion)
8.3.9.2 Market Estimates & Forecast Analysis, By Application, 2019-2027(USD Billion)
8.3.9.3 Market Estimates & Forecast Analysis, By Services, 2019-2027(USD Billion)
8.3.9.4 Market Estimates & Forecast Analysis, By Type of Data Source, 2019-2027(USD Billion)
8.3.10 Italy
8.3.10.1 Market Estimates & Forecast Analysis, By Software, 2019-2027(USD Billion)
8.3.10.2 Market Estimates & Forecast Analysis, By Application, 2019-2027(USD Billion)
8.3.10.3 Market Estimates & Forecast Analysis, By Services, 2019-2027(USD Billion)
8.3.10.4 Market Estimates & Forecast Analysis, By Type of Data Source, 2019-2027(USD Billion)
8.3.11 Spain
8.3.11.1 Market Estimates & Forecast Analysis, By Software, 2019-2027(USD Billion)
8.3.11.2 Market Estimates & Forecast Analysis, By Application, 2019-2027(USD Billion)
8.3.11.3 Market Estimates & Forecast Analysis, By Services, 2019-2027(USD Billion)
8.3.11.4 Market Estimates & Forecast Analysis, By Type of Data Source, 2019-2027(USD Billion)
8.3.12 Rest of Europe
8.3.12.1 Market Estimates & Forecast Analysis, By Software, 2019-2027 (USD Billion)
8.3.12.2 Market Estimates & Forecast Analysis, By Application, 2019-2027 (USD Billion)
8.3.12.3 Market Estimates & Forecast Analysis, By Services, 2019-2027 (USD Billion)
8.3.12.4 Market Estimates & Forecast Analysis, By Type of Data Source, 2019-2027(USD Billion)
8.4 Asia Pacific
8.4.1 Market Estimates & Forecast Analysis, By Country 2019-2027(USD Billion)
8.4.2 Market Estimates & Forecast Analysis, By Software, 2019-2027(USD Billion)
8.4.3 Market Estimates & Forecast Analysis, By Application, 2019-2027(USD Billion)
8.4.4 Market Estimates & Forecast Analysis, By Services, 2019-2027(USD Billion)
8.4.5 Market Estimates & Forecast Analysis, By Type of Data Source, 2019-2027(USD Billion)
8.4.6 China
8.4.6.1 Market Estimates & Forecast Analysis, By Software, 2019-2027(USD Billion)
8.4.6.2 Market Estimates & Forecast Analysis, By Application, 2019-2027(USD Billion)
8.4.6.3 Market Estimates & Forecast Analysis, By Services, 2019-2027(USD Billion)
8.4.6.4 Market Estimates & Forecast Analysis, By Type of Data Source, 2019-2027(USD Billion)
8.4.7 India
8.4.7.1 Market Estimates & Forecast Analysis, By Software, 2019-2027(USD Billion)
8.4.7.2 Market Estimates & Forecast Analysis, By Application, 2019-2027(USD Billion)
8.4.7.3 Market Estimates & Forecast Analysis, By Services, 2019-2027(USD Billion)
8.4.7.4 Market Estimates & Forecast Analysis, By Type of Data Source, 2019-2027(USD Billion)
8.4.8 Japan
8.4.8.1 Market Estimates & Forecast Analysis, By Software, 2019-2027(USD Billion)
8.4.8.2 Market Estimates & Forecast Analysis, By Application, 2019-2027(USD Billion)
8.4.8.3 Market Estimates & Forecast Analysis, By Services, 2019-2027(USD Billion)
8.4.8.4 Market Estimates & Forecast Analysis, By Type of Data Source, 2019-2027(USD Billion)
8.4.9 Australia
8.4.9.1 Market Estimates & Forecast Analysis, By Software, 2019-2027(USD Billion)
8.4.9.2 Market Estimates & Forecast Analysis, By Application, 2019-2027(USD Billion)
8.4.9.3 Market Estimates & Forecast Analysis, By Services, 2019-2027(USD Billion)
8.4.9.4 Market Estimates & Forecast Analysis, By Type of Data Source, 2019-2027(USD Billion)
8.4.10 South Korea
8.4.10.1 Market Estimates & Forecast Analysis, By Software, 2019-2027(USD Billion)
8.4.10.2 Market Estimates & Forecast Analysis, By Application, 2019-2027(USD Billion)
8.4.10.3 Market Estimates & Forecast Analysis, By Services, 2019-2027(USD Billion)
8.4.10.4 Market Estimates & Forecast Analysis, By Type of Data Source, 2019-2027(USD Billion)
8.4.11 Rest of Asia Pacific
8.4.11.1 Market Estimates & Forecast Analysis, By Software, 2019-2027 (USD Billion)
8.4.11.2 Market Estimates & Forecast Analysis, By Application, 2019-2027 (USD Billion)
8.4.11.3 Market Estimates & Forecast Analysis, By Services, 2019-2027 (USD Billion)
8.4.11.4 Market Estimates & Forecast Analysis, By Type of Data Source, 2019-2027(USD Billion)
8.5 Central & South America
8.5.1 Market Estimates & Forecast Analysis, By Country 2019-2027(USD Billion)
8.5.2 Market Estimates & Forecast Analysis, By Software, 2019-2027(USD Billion)
8.5.3 Market Estimates & Forecast Analysis, By Application, 2019-2027(USD Billion)
8.5.4 Market Estimates & Forecast Analysis, By Services, 2019-2027(USD Billion)
8.5.5 Market Estimates & Forecast Analysis, By Type of Data Source, 2019-2027(USD Billion)
8.5.6 Brazil
8.5.6.1 Market Estimates & Forecast Analysis, By Software, 2019-2027(USD Billion)
8.5.6.2 Market Estimates & Forecast Analysis, By Application, 2019-2027(USD Billion)
8.5.6.3 Market Estimates & Forecast Analysis, By Services, 2019-2027(USD Billion)
8.5.6.4 Market Estimates & Forecast Analysis, By Type of Data Source, 2019-2027(USD Billion)
8.5.7 Rest of Central & South America
8.5.7.1 Market Estimates & Forecast Analysis, By Software, 2019-2027(USD Billion)
8.5.7.2 Market Estimates & Forecast Analysis, By Application, 2019-2027(USD Billion)
8.5.7.3 Market Estimates & Forecast Analysis, By Services, 2019-2027(USD Billion)
8.5.7.4 Market Estimates & Forecast Analysis, By Type of Data Source, 2019-2027(USD Billion)
8.6 Middle East & Africa
8.6.1 Market Estimates & Forecast Analysis, By Country 2019-2027(USD Billion)
8.6.2 Market Estimates & Forecast Analysis, By Software, 2019-2027(USD Billion)
8.6.3 Market Estimates & Forecast Analysis, By Application, 2019-2027(USD Billion)
8.6.4 Market Estimates & Forecast Analysis, By Services, 2019-2027(USD Billion)
8.6.5 Market Estimates & Forecast Analysis, By Type of Data Source, 2019-2027(USD Billion)
8.6.6 Saudi Arabia
8.6.6.1 Market Estimates & Forecast Analysis, By Software, 2019-2027(USD Billion)
8.6.6.2 Market Estimates & Forecast Analysis, By Application, 2019-2027(USD Billion)
8.6.6.3 Market Estimates & Forecast Analysis, By Services, 2019-2027(USD Billion)
8.6.6.4 Market Estimates & Forecast Analysis, By Type of Data Source, 2019-2027(USD Billion)
8.6.7 United Arab Emirates
8.6.7.1 Market Estimates & Forecast Analysis, By Software, 2019-2027(USD Billion)
8.6.7.2 Market Estimates & Forecast Analysis, By Application, 2019-2027(USD Billion)
8.6.7.3 Market Estimates & Forecast Analysis, By Services, 2019-2027(USD Billion)
8.6.7.4 Market Estimates & Forecast Analysis, By Type of Data Source, 2019-2027(USD Billion)
8.6.8 South Africa
8.6.8.1 Market Estimates & Forecast Analysis, By Software, 2019-2027(USD Billion)
8.6.8.2 Market Estimates & Forecast Analysis, By Application, 2019-2027(USD Billion)
8.6.8.3 Market Estimates & Forecast Analysis, By Services, 2019-2027(USD Billion)
8.6.8.4 Market Estimates & Forecast Analysis, By Type of Data Source, 2019-2027(USD Billion)
8.6.9 Rest of Middle East & Africa
8.6.9.1 Market Estimates & Forecast Analysis, By Software, 2019-2027 (USD Billion)
8.6.9.2 Market Estimates & Forecast Analysis, By Application, 2019-2027 (USD Billion)
8.6.9.3 Market Estimates & Forecast Analysis, By Services, 2019-2027 (USD Billion)
8.6.9.4 Market Estimates & Forecast Analysis, By Type of Data Source, 2019-2027(USD Billion)
Chapter 9 Competitive Analysis
9.1 Key Global Players, Recent Developments & their Impact on the Industry
9.2 Four Quadrant Competitor Positioning Matrix
9.2.1 Key Innovators
9.2.2 Market Leaders
9.2.3 Emerging Players
9.2.4 Market Challengers
9.3 Vendor Landscape Analysis
9.4 End-User Landscape Analysis
9.5 Company Market Share Analysis, 2021
Chapter 10 Company Profile Analysis
10.1 Teradata
10.1.1 Company Overview
10.1.2 Financial Analysis
10.1.3 Strategic Initiatives
10.1.4 Product Benchmarking
10.2 Splunk, Inc.
10.2.1 Company Overview
10.2.2 Financial Analysis
10.2.3 Strategic Initiatives
10.2.4 Product Benchmarking
10.3 AIMS Sinay
10.3.1 Company Overview
10.3.2 Financial Analysis
10.3.3 Strategic Initiatives
10.3.4 Product Benchmarking
10.4 Oceanwise
10.4.1 Company Overview
10.4.2 Financial Analysis
10.4.3 Strategic Initiatives
10.4.4 Product Benchmarking
10.5 Intertrust Technologies Corporation
10.5.1 Company Overview
10.5.2 Financial Analysis
10.5.3 Strategic Initiatives
10.5.4 Product Benchmarking
10.6 MarineFIND
10.6.1 Company Overview
10.6.2 Financial Analysis
10.6.3 Strategic Initiatives
10.6.4 Product Benchmarking
10.7 BigOceanData
10.7.1 Company Overview
10.7.2 Financial Analysis
10.7.3 Strategic Initiatives
10.7.4 Product Benchmarking
10.8 Avenca Limited
10.8.1 Company Overview
10.8.2 Financial Analysis
10.8.3 Strategic Initiatives
10.8.4 Product Benchmarking
10.9 BMT Group Ltd.
10.9.1 Company Overview
10.9.2 Financial Analysis
10.9.3 Strategic Initiatives
10.9.4 Product Benchmarking
10.10 Datameer Inc.
10.10.1 Company Overview
10.10.2 Financial Analysis
10.10.3 Strategic Initiatives
10.10.4 Product Benchmarking
10.11 Databricks Inc.
10.11.1 Company Overview
10.11.2 Financial Analysis
10.11.3 Strategic Initiatives
10.11.4 Product Benchmarking
10.12 Other Companies
10.12.1 Company Overview
10.12.2 Financial Analysis
10.12.3 Strategic Initiatives
10.12.4 Product Benchmarking
List of Tables
1 Technological Advancements In Marine Actuators and Valves Market
2 Global Marine Actuators and Valves Market: Key Market Drivers
3 Global Marine Actuators and Valves Market: Key Market Challenges
4 Global Marine Actuators and Valves Market: Key Market Opportunities
5 Global Marine Actuators and Valves Market: Key Market Restraints
6 Global Marine Actuators and Valves Market Estimates & Forecast Analysis, 2019-2027 (USD Billion)
7 Global Marine Actuators and Valves Market, By Product, 2019-2027 (USD Billion)
8 Data Analytics: Global Marine Actuators and Valves Market, By Region, 2019-2027 (USD Billion)
9 Data Collection: Global Marine Actuators and Valves Market, By Region, 2019-2027 (USD Billion)
10 Data Discovery & Visualization Data Management: Global Marine Actuators and Valves Market, By Region, 2019-2027 (USD Billion)
11 Global Marine Actuators and Valves Market, By Application, 2019-2027 (USD Billion)
12 Renewable Energy: Global Marine Actuators and Valves Market, By Region, 2019-2027 (USD Billion)
13 Oil & Gas: Global Marine Actuators and Valves Market, By Region, 2019-2027 (USD Billion)
14 Fishery: Global Marine Actuators and Valves Market, By Region, 2019-2027 (USD Billion)
15 Whale Watching: Global Marine Actuators and Valves Market, By Region, 2019-2027 (USD Billion)
16 Marine Protected Area: Global Marine Actuators and Valves Market, By Region, 2019-2027 (USD Billion)
17 Dredging: Global Marine Actuators and Valves Market, By Region, 2019-2027 (USD Billion)
18 Harbor: Global Marine Actuators and Valves Market, By Region, 2019-2027 (USD Billion)
19 Offshore Construction: Global Marine Actuators and Valves Market, By Region, 2019-2027 (USD Billion)
20 Global Marine Actuators and Valves Market, By Services, 2019-2027 (USD Billion)
21 Consulting: Global Marine Actuators and Valves Market, By Region, 2019-2027 (USD Billion)
22 System Integration and Operation Maintenance: Global Marine Actuators and Valves Market, By Region, 2019-2027 (USD Billion)
23 Global Marine Actuators and Valves Market, By Type of Data Source, 2019-2027 (USD Billion)
24 Environmental: Global Marine Actuators and Valves Market, By Region, 2019-2027 (USD Billion)
25 Oceanographic: Global Marine Actuators and Valves Market, By Region, 2019-2027 (USD Billion)
26 Geological Data: Global Marine Actuators and Valves Market, By Region, 2019-2027 (USD Billion)
27 Economic: Global Marine Actuators and Valves Market, By Region, 2019-2027 (USD Billion)
28 Regional Analysis: Global Marine Actuators and Valves Market, By Region, 2019-2027 (USD Billion)
29 North America: Marine Actuators and Valves Market, By Product, 2019-2027 (USD Billion)
30 North America: Marine Actuators and Valves Market, By Application, 2019-2027 (USD Billion)
31 North America: Marine Actuators and Valves Market, By Services , 2019-2027 (USD Billion)
32 North America: Marine Actuators and Valves Market, By Type of Data Source, 2019-2027 (USD Billion)
33 North America: Marine Actuators and Valves Market, By Country, 2019-2027 (USD Billion)
34 U.S: Marine Actuators and Valves Market, By Product, 2019-2027 (USD Billion)
35 U.S: Marine Actuators and Valves Market, By Application, 2019-2027 (USD Billion)
36 U.S: Marine Actuators and Valves Market, By Services, 2019-2027 (USD Billion)
37 U.S: Marine Actuators and Valves Market, By Type of Data Source, 2019-2027 (USD Billion)
38 Canada: Marine Actuators and Valves Market, By Product, 2019-2027 (USD Billion)
39 Canada: Marine Actuators and Valves Market, By Application, 2019-2027 (USD Billion)
40 Canada: Marine Actuators and Valves Market, By Services, 2019-2027 (USD Billion)
41 Canada: Marine Actuators and Valves Market, By Type of Data Source, 2019-2027 (USD Billion)
42 Mexico: Marine Actuators and Valves Market, By Product, 2019-2027 (USD Billion)
43 Mexico: Marine Actuators and Valves Market, By Application, 2019-2027 (USD Billion)
44 Mexico: Marine Actuators and Valves Market, By Services, 2019-2027 (USD Billion)
45 Mexico: Marine Actuators and Valves Market, By Type of Data Source, 2019-2027 (USD Billion)
46 Europe: Marine Actuators and Valves Market, By Product, 2019-2027 (USD Billion)
47 Europe: Marine Actuators and Valves Market, By Application, 2019-2027 (USD Billion)
48 Europe: Marine Actuators and Valves Market, By Services, 2019-2027 (USD Billion)
49 Europe: Marine Actuators and Valves Market, By Type of Data Source, 2019-2027 (USD Billion)
50 Germany: Marine Actuators and Valves Market, By Product, 2019-2027 (USD Billion)
51 Germany: Marine Actuators and Valves Market, By Application, 2019-2027 (USD Billion)
52 Germany: Marine Actuators and Valves Market, By Services, 2019-2027 (USD Billion)
53 Germany: Marine Actuators and Valves Market, By Type of Data Source, 2019-2027 (USD Billion)
54 UK: Marine Actuators and Valves Market, By Product, 2019-2027 (USD Billion)
55 UK: Marine Actuators and Valves Market, By Application, 2019-2027 (USD Billion)
56 UK: Marine Actuators and Valves Market, By Services, 2019-2027 (USD Billion)
57 UK: Marine Actuators and Valves Market, By Type of Data Source, 2019-2027 (USD Billion)
58 France: Marine Actuators and Valves Market, By Product, 2019-2027 (USD Billion)
59 France: Marine Actuators and Valves Market, By Application, 2019-2027 (USD Billion)
60 France: Marine Actuators and Valves Market, By Services, 2019-2027 (USD Billion)
61 France: Marine Actuators and Valves Market, By Type of Data Source, 2019-2027 (USD Billion)
62 Italy: Marine Actuators and Valves Market, By Product, 2019-2027 (USD Billion)
63 Italy: Marine Actuators and Valves Market, By T Application Ype, 2019-2027 (USD Billion)
64 Italy: Marine Actuators and Valves Market, By Services, 2019-2027 (USD Billion)
65 ltaly: Marine Actuators and Valves Market, By Type of Data Source, 2019-2027 (USD Billion)
66 Spain: Marine Actuators and Valves Market, By Product, 2019-2027 (USD Billion)
67 Spain: Marine Actuators and Valves Market, By Application, 2019-2027 (USD Billion)
68 Spain: Marine Actuators and Valves Market, By Services, 2019-2027 (USD Billion)
69 Spain: Marine Actuators and Valves Market, By Type of Data Source, 2019-2027 (USD Billion)
70 Rest Of Europe: Marine Actuators and Valves Market, By Product, 2019-2027 (USD Billion)
71 Rest Of Europe: Marine Actuators and Valves Market, By Application, 2019-2027 (USD Billion)
72 Rest Of Europe: Marine Actuators and Valves Market, By Services, 2019-2027 (USD Billion)
73 Rest of Europe: Marine Actuators and Valves Market, By Type of Data Source, 2019-2027 (USD Billion)
74 Asia Pacific: Marine Actuators and Valves Market, By Product, 2019-2027 (USD Billion)
75 Asia Pacific: Marine Actuators and Valves Market, By Application, 2019-2027 (USD Billion)
76 Asia Pacific: Marine Actuators and Valves Market, By Services, 2019-2027 (USD Billion)
77 Asia Pacific: Marine Actuators and Valves Market, By Type of Data Source, 2019-2027 (USD Billion)
78 Asia Pacific: Marine Actuators and Valves Market, By Country, 2019-2027 (USD Billion)
79 China: Marine Actuators and Valves Market, By Product, 2019-2027 (USD Billion)
80 China: Marine Actuators and Valves Market, By Application, 2019-2027 (USD Billion)
81 China: Marine Actuators and Valves Market, By Services, 2019-2027 (USD Billion)
82 China: Marine Actuators and Valves Market, By Type of Data Source, 2019-2027 (USD Billion)
83 India: Marine Actuators and Valves Market, By Product, 2019-2027 (USD Billion)
84 India: Marine Actuators and Valves Market, By Application, 2019-2027 (USD Billion)
85 India: Marine Actuators and Valves Market, By Services, 2019-2027 (USD Billion)
86 India: Marine Actuators and Valves Market, By Type of Data Source, 2019-2027 (USD Billion)
87 Japan: Marine Actuators and Valves Market, By Product, 2019-2027 (USD Billion)
88 Japan: Marine Actuators and Valves Market, By Application, 2019-2027 (USD Billion)
89 Japan: Marine Actuators and Valves Market, By Services, 2019-2027 (USD Billion)
90 Japan: Marine Actuators and Valves Market, By Type of Data Source, 2019-2027 (USD Billion)
91 South Korea: Marine Actuators and Valves Market, By Product, 2019-2027 (USD Billion)
92 South Korea: Marine Actuators and Valves Market, By Application, 2019-2027 (USD Billion)
93 South Korea: Marine Actuators and Valves Market, By Services, 2019-2027 (USD Billion)
94 South Korea: Marine Actuators and Valves Market, By Type of Data Source, 2019-2027 (USD Billion)
95 Middle East & Africa: Marine Actuators and Valves Market, By Product, 2019-2027 (USD Billion)
96 Middle East & Africa: Marine Actuators and Valves Market, By Application, 2019-2027 (USD Billion)
97 Middle East & Africa: Marine Actuators and Valves Market, By Services, 2019-2027 (USD Billion)
98 Middle East & Africa: Marine Actuators and Valves Market, By Type of Data Source, 2019-2027 (USD Billion)
99 Middle East & Africa: Marine Actuators and Valves Market, By Country, 2019-2027 (USD Billion)
100 Saudi Arabia: Marine Actuators and Valves Market, By Product, 2019-2027 (USD Billion)
101 Saudi Arabia: Marine Actuators and Valves Market, By Application, 2019-2027 (USD Billion)
102 Saudi Arabia: Marine Actuators and Valves Market, By Services, 2019-2027 (USD Billion)
103 Saudi Arabia: Marine Actuators and Valves Market, By Type of Data Source, 2019-2027 (USD Billion)
104 UAE: Marine Actuators and Valves Market, By Product, 2019-2027 (USD Billion)
105 UAE: Marine Actuators and Valves Market, By Application, 2019-2027 (USD Billion)
106 UAE: Marine Actuators and Valves Market, By Services, 2019-2027 (USD Billion)
107 UAE: Marine Actuators and Valves Market, By Type of Data Source, 2019-2027 (USD Billion)
108 Central & South America: Marine Actuators and Valves Market, By Product, 2019-2027 (USD Billion)
109 Central & South America: Marine Actuators and Valves Market, By Application, 2019-2027 (USD Billion)
110 Central & South America: Marine Actuators and Valves Market, By Services, 2019-2027 (USD Billion)
111 Central & South America: Marine Actuators and Valves Market, By Type of Data Source, 2019-2027 (USD Billion)
112 Central & South America: Marine Actuators and Valves Market, By Country, 2019-2027 (USD Billion)
113 Brazil: Marine Actuators and Valves Market, By Product, 2019-2027 (USD Billion)
114 Brazil: Marine Actuators and Valves Market, By Application, 2019-2027 (USD Billion)
115 Brazil: Marine Actuators and Valves Market, By Services, 2019-2027 (USD Billion)
116 Brazil: Marine Actuators and Valves Market, By Type of Data Source, 2019-2027 (USD Billion)
117 Teradata: Products Offered
118 Splunk, Inc.: Products Offered
119 AIMS Sinay: Products Offered
120 Oceanwise: Products Offered
121 Intertrust Technologies Corporation: Products Offered
122 MarineFIND: Products Offered
123 BigOceanData: Products Offered
124 Avenca Limited: Products Offered
125 BMT Group Ltd.: Products Offered
126 Datameer Inc.: Products Offered
127 Databricks Inc.: Products Offered
128 Other Companies: Products Offered
List of Figures
1. Global Marine Actuators and Valves Market Segmentation & Research Scope
2. Primary Research Partners and Local Informers
3. Primary Research Process
4. Primary Research Approaches
5. Primary Research Responses
6. Global Marine Actuators and Valves Market: Penetration & Growth Prospect Mapping
7. Global Marine Actuators and Valves Market: Value Chain Analysis
8. Global Marine Actuators and Valves Market Drivers
9. Global Marine Actuators and Valves Market Restraints
10. Global Marine Actuators and Valves Market Opportunities
11. Global Marine Actuators and Valves Market Challenges
12. Key Marine Actuators and Valves Market Manufacturer Analysis
13. Global Marine Actuators and Valves Market: Porter’s Five Forces Analysis
14. PESTLE Analysis & Impact Analysis
15. Teradata: Company Snapshot
16. Teradata: Swot Analysis
17. Splunk, Inc.: Company Snapshot
18. Splunk, Inc.: Swot Analysis
19. AIMS Sinay: Company Snapshot
20. AIMS Sinay: Swot Analysis
21. Oceanwise: Company Snapshot
22. Oceanwise: Swot Analysis
23. Intertrust Technologies Corporation: Company Snapshot
24. Intertrust Technologies Corporation: Swot Analysis
25. MarineFIND: Company Snapshot
26. MarineFIND: Swot Analysis
27. BigOceanData: Company Snapshot
28. BigOceanData: Swot Analysis
29. Avenca Limited: Company Snapshot
30. Avenca Limited: Swot Analysis
31. BMT Group Ltd.: Company Snapshot
32. BMT Group Ltd.: Swot Analysis
33. Datameer Inc.: Company Snapshot
34. Datameer Inc.: Swot Analysis
35. Databricks Inc.: Company Snapshot
36. Databricks Inc.: Swot Analysis
37. Other Companies: Company Snapshot
38. Other Companies: Swot Analysis
The Global Marine Big Data Market has been studied from the year 2019 till 2027. However, the CAGR provided in the report is from the year 2022 to 2027. The research methodology involved three stages: Desk research, Primary research, and Analysis & Output from the entire research process.

The desk research involved a robust background study which meant referring to paid and unpaid databases to understand the market dynamics; mapping contracts from press releases; identifying the key players in the market, studying their product portfolio, competition level, annual reports/SEC filings & investor presentations; and learning the demand and supply-side analysis for the Marine Big Data Market.

The primary research activity included telephonic conversations with more than 50 tier 1 industry consultants, distributors, and end-use product manufacturers.

Finally, based on the above thorough research process, an in-depth analysis was carried out considering the following aspects: market attractiveness, current & future market trends, market share analysis, SWOT analysis of the company and customer analytics.

Frequently Asked Questions

This FREE sample includes market data points, ranging from trend analyses to market estimates & forecasts. See for yourself.
Or view our licence options:
Tailor made solutions just for you
80% of our clients seek made-to-order reports. How do you want us to tailor yours?
OUR CLIENTS


