This report was recently updated on August 24 2025 with the latest and most recent
market numbers
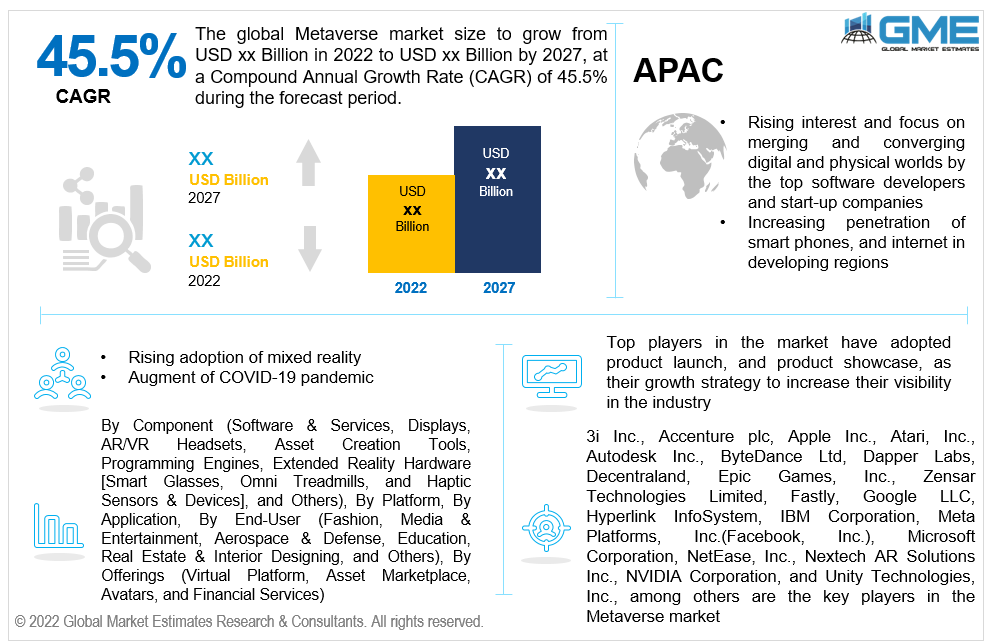
Global Metaverse Market Size, Trends & Analysis - Forecasts to 2027 By Component (Software & Services, Displays, AR/VR Headsets, Asset Creation Tools, Programming Engines, Extended Reality Hardware [Smart Glasses, Omni Treadmills, and Haptic Sensors & Devices], and Others), By Platform (Desktop/Laptops, Mobiles, and Wearables), By Application (Gaming, Online Shopping, Content Creation, Social Media, Conference, Virtual Runway Shows, Aircraft Maintenance, and Others), By End-User (Fashion, Media & Entertainment, Aerospace & Defense, Education, Real Estate & Interior Designing, and Others), By Offerings (Virtual Platform, Asset Marketplace, Avatars, and Financial Services), By Region (North America, Asia Pacific, Europe, Central & South America, Middle East & Africa), End-User Landscape, Company Market Share Analysis, and Competitor Analysis
The global metaverse market will grow at a CAGR value of 45.5% during the forecast period of 2022 to 2027.
Metaverse can be defined as a concept of online or 3D version of universe which can be combined with multiple virtual spaces. It can also be described as the future of iteration of the internet. This concept helps the consumers to meet, work, play and socialize but in a 3D space in the virtual world. Amongst all the applications, video games or online games have been capable of holding a large chunk of the share in the market. Moreover, with the rising alliance of two different industries namely crypto currencies and Metaverse, the market is predicted to grow at a faster rate. Crypto currencies allow for creating a digital economy with different types of utility tokens and virtual collectibles like NFTs. The Metaverse would also benefit from the use of crypto wallets, such as Trust Wallet and MetaMask. Also, blockchain technology can provide transparent and reliable governance systems.
The entry of NFTs in the Metaverse world is slowly changing the situation for fashion industry too. Brands like Oscar de la Renta, Gucci, Dolce & Gabbana, Balenciaga, and Casablanca, have already come on board to use Metaverse. Also, currently in 2021, Microsoft Teams is getting 3D virtual avatars and environments on the platform as a portion of the tech giant's push towards entering the Metaverse. These digital outfits, or NFTs, are JPEG files that are secured via blockchain technology to defend the brand value. Going ahead, with the increase in the popularity of Metaverse, there is giant potential for the demand of Metaverse fashion stylists to generate avatars and dress them up to match one’s personality.
Rising interest and focus on merging and converging digital and physical worlds by the top software developers and start-up companies, increasing penetration of smart phones, and internet in developing regions, rising adoption of mixed reality and the augment of COVID-19 pandemic are all the factors leading to the growth of the market. Moreover, increasing number of product launch strategies especially in the gaming sector, rising penetration of blockchain technology in the 3D world, and increasing trend of trading digitalized assets and tokens are some of the other factors supporting the growth of the market.
The outbreak of the COVID-19 pandemic has impacted the Metaverse market and it’s likely to be only increasing in terms of growth rate since 2020. Rising trend of remote working protocols, increasing online retail shopping, and a drastic shift from offline to online teaching methods are some of the factors that led to the high adoption of Metaverse in the market.
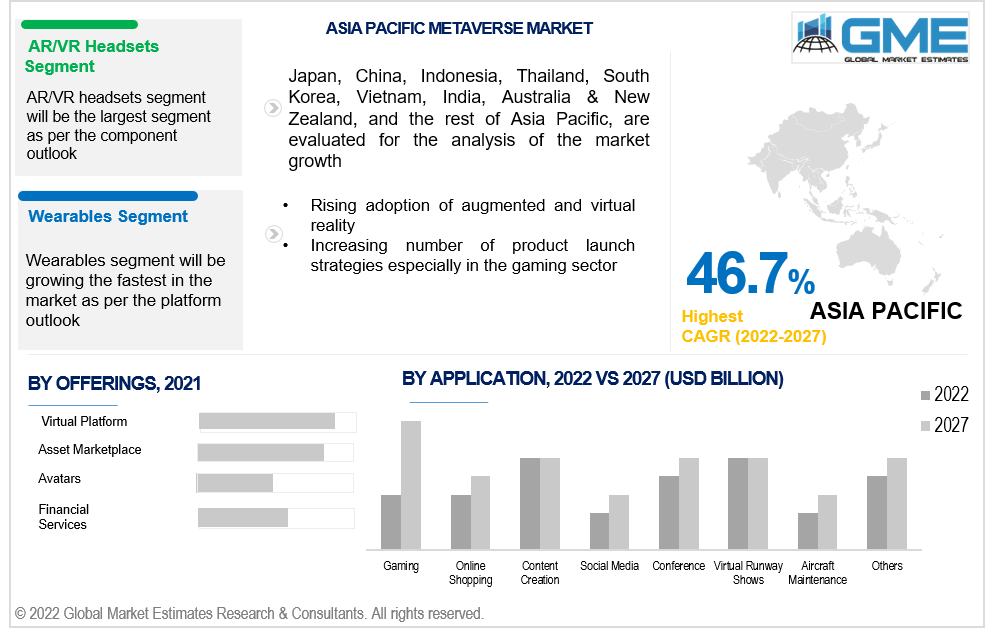
Based on the component segmentation, the Metaverse market is divided into software & services, displays, AR/VR headsets, asset creation tools, programming engines, extended reality hardware [smart glasses, Omni treadmills, and haptic sensors & devices], and others. The AR/VR headsets segment is expected to be the fastest growing segment in the Metaverse market from 2022 to 2027. Rising adoption of augmented and virtual reality by end-user industries such as healthcare/medical education, fashion & apparel segment, and aerospace and defense will support the growth of the segment during the forecast period.
Based on the platform segmentation, the Metaverse market is divided into desktop/laptops, mobiles, and wearables. The wearables segment is expected to be the fastest growing segment in the Metaverse market from 2022 to 2027. The segment of wearables is expected to be the fastest because of the fast growing AR/VR headset segment. As wearables hold a prime importance in the operating in Metaverse, it is ought to be true that this segment will foresee a faster growth rate than others.
Based on the application segmentation, the Metaverse market is divided into gaming, online shopping, content creation, social media, conference, virtual runway shows, aircraft maintenance, and others. The gaming segment is expected to be the largest segment in the Metaverse market from 2022 to 2027. The primary Metaverse revenue opportunity for video-game makers is based largely on the existing advanced gaming software and services. Moreover, in-game advertising is another key function because of which this segment is expected to be the growing the fastest in the market.
Based on the end-user segmentation, the Metaverse market is divided into fashion, media & entertainment, aerospace & defense, education, real estate & interior designing, and others. The fashion segment is expected to be the fastest growing segment in the Metaverse market from 2022 to 2027. The world’s top fashion and clothing brands are currently adopting and betting on adopting the trend of digital clothing as they are aware of micro indicators such as high buying capabilities for virtual outfits in the immersive digital world.
Based on the offerings segmentation, the Metaverse market is divided into virtual platform, asset marketplace, avatars, and financial services. The virtual platforms segment is expected to be the largest segment in the Metaverse market from 2022 to 2027. Virtual platforms are nothing but a platform or a place for managing immersive digital and 3D simulations, environment, and settings. Rising penetration of smart phones and rising number of app developers in the market will propel the growth of this segment during the forecast period.
As per the geographical analysis, the Metaverse market can be classified into North America (the United States, Canada, and Mexico), Asia Pacific (India, China, Japan, Malaysia, Singapore, and the Rest of Asia Pacific), Europe (Germany, United Kingdom, Italy, France, Spain, Netherlands, and Rest of Europe), Middle East & Africa (Saudi Arabia, United Arab Emirates, and Rest of the Middle East & Africa) and Central & South America (Brazil, Argentina, and Rest of Central and South America).
North America (the United States, Canada, and Mexico) will have a dominant share in the Metaverse market from 2022 to 2027. The major factor driving the growth of the market is the high presence of the top Metaverse companies in the U.S. and Canada. Moreover increasing awareness, adoption and acceptance of Metaverse and strong presence of game developers are some of the drivers of this region’s growth.
Moreover, the Asia Pacific (India, China, Japan, Malaysia, Singapore, and the Rest of Asia Pacific) region is expected to be the fastest-growing segment in the global Metaverse market during the forecast period. Asia Pacific being home to various Metaverse start-ups is one of the prime reasons for this region to grow the fastest. Moreover, rising penetration of smartphones and interest across the developing countries is also supporting the growth of the region.
3i Inc., Accenture plc, Apple Inc., Atari, Inc., Autodesk Inc., ByteDance Ltd, Dapper Labs, Decentraland, Epic Games, Inc., Zensar Technologies Limited, Fastly, Google LLC, Hyperlink InfoSystem, IBM Corporation, Infor, Infosys Limited, Lilith Games, Madeium, Magic Leap, Inc., Meta Platforms, Inc.(Facebook, Inc.), Microsoft Corporation, NetEase, Inc., Nextech AR Solutions Inc., NVIDIA Corporation, Oracle Corporation, PTC Inc., Roblox Corporation, SAP SE, Synthesis AI, Systems Engineering & Assessment Ltd., Tencent Holdings Ltd., and Unity Technologies, Inc., among others are the key players in the Metaverse market.
Please note: This is not an exhaustive list of companies profiled in the report.
Chapter 1 Methodology
1.1 Market Scope & Definitions
1.2 Estimates & Forecast Calculation
1.3 Historical Data Overview and Validation
1.4 Data Sources
1.4.1 Secondary
1.4.2 Primary
Chapter 2 Report Outlook
2.1 Metaverse Industry Overview, 2022-2027
2.1.1 Industry Overview
2.1.2 Component Overview
2.1.3 Platform Overview
2.1.4 End-User Overview
2.1.5 Application Overview
2.1.6 Offering Overview
2.1.7 Regional Overview
Chapter 3 Metaverse Market Trends
3.1 Market Segmentation
3.2 Industry Background, 2022-2027
3.3 Market Key Trends
3.3.1 Positive Trends
3.3.1.1 Rising interest and focus on merging and converging digital and physical worlds by the top software developers and start-up companies
3.3.2 Industry Challenges
3.3.2.1 Lack of awareness related to Metaverse in under-developed countries
3.4 Prospective Growth Scenario
3.4.1 Component Growth Scenario
3.4.2 Platform Growth Scenario
3.4.3 End-User Growth Scenario
3.4.4 Application Growth Scenario
3.4.5 Offering Scenario
3.4.6 Clinical Trial Phase Scenario
3.5 COVID-19 Influence over Industry Growth
3.6 Porter’s Analysis
3.7 PESTEL Analysis
3.8 Value Chain & Supply Chain Analysis
3.9 Regulatory Framework
3.9.1 North America
3.9.2 Europe
3.9.3 APAC
3.9.4 LATAM
3.9.5 MEA
3.10 Application Overview
3.11 Market Share Analysis, 2020
3.11.1 Company Positioning Overview, 2021
Chapter 4 Metaverse Market, By Component
4.1 Component Outlook
4.2 Software & Services
4.2.1 Market Size, By Region, 2022-2027 (USD Billion)
4.3 Displays
4.3.1 Market Size, By Region, 2022-2027 (USD Billion)
4.4 Asset Creation Tools
4.4.1 Market Size, By Region, 2022-2027 (USD Billion)
4.5 Programming Engines
4.5.1 Market Size, By Region, 2022-2027 (USD Billion)
4.6 Extended Reality Hardware [Smart Glasses, Omni Treadmills, and Haptic Sensors & Devices]
4.6.1 Market Size, By Region, 2022-2027 (USD Billion)
4.7 Others
4.7.1 Market Size, By Region, 2022-2027 (USD Billion)
Chapter 5 Metaverse Market, By Platform
5.1 Platform Outlook
5.2 Wearable
5.2.1 Market Size, By Region, 2022-2027 (USD Billion)
5.3 Desktop/Laptops
5.3.1 Market Size, By Region, 2022-2027 (USD Billion)
5.4 Mobiles
5.4.1 Market Size, By Region, 2022-2027 (USD Billion)
Chapter 6 Metaverse Market, By End-User
6.1 Fashion
6.1.1 Market Size, By Region, 2022-2027 (USD Billion)
6.2 Media & Entertainment
6.2.1 Market Size, By Region, 2022-2027 (USD Billion)
6.3 Aerospace & Defense
6.3.1 Market Size, By Region, 2022-2027 (USD Billion)
6.4 Education
6.4.1 Market Size, By Region, 2022-2027 (USD Billion)
6.5 Real Estate & Interior Designing
6.5.1 Market Size, By Region, 2022-2027 (USD Billion)
6.6 Others
6.6.1 Market Size, By Region, 2022-2027 (USD Billion)
Chapter 7 Metaverse Market, By Application
7.1 Gaming
7.1.1 Market Size, By Region, 2022-2027 (USD Billion)
7.2 Online Shopping
7.2.1 Market Size, By Region, 2022-2027 (USD Billion)
7.3 Content Creation
7.3.1 Market Size, By Region, 2022-2027 (USD Billion)
7.4 Social Media
7.4.1 Market Size, By Region, 2022-2027 (USD Billion)
7.5 Conference
7.5.1 Market Size, By Region, 2022-2027 (USD Billion)
7.6 Virtual Runway Shows
7.6.1 Market Size, By Region, 2022-2027 (USD Billion)
7.7 Aircraft Maintenance
7.7.1 Market Size, By Region, 2022-2027 (USD Billion)
7.8 Others
7.8.1 Market Size, By Region, 2022-2027 (USD Billion)
Chapter 8 Metaverse Market, By Offering
8.1 Virtual Platform
8.1.1 Market Size, By Region, 2022-2027 (USD Billion)
8.2 Asset Marketplace
8.2.1 Market Size, By Region, 2022-2027 (USD Billion)
8.3 Avatars
8.3.1 Market Size, By Region, 2022-2027 (USD Billion)
8.4 Financial Services
8.4.1 Market Size, By Region, 2022-2027 (USD Billion)
Chapter 9 Metaverse Market, By Region
9.1 Regional outlook
9.2 North America
9.2.1 Market Size, By Country 2022-2027 (USD Billion)
9.2.2 Market Size, By Component, 2022-2027 (USD Billion)
9.2.3 Market Size, By Platform, 2022-2027 (USD Billion)
9.2.4 Market Size, By End-User, 2022-2027 (USD Billion)
9.2.5 Market Size, By Application, 2022-2027 (USD Billion)
9.2.6 Market Size, By Offering, 2022-2027 (USD Billion)
9.2.7 U.S.
9.2.7.1 Market Size, By Component, 2022-2027 (USD Billion)
9.2.7.2 Market Size, By Platform, 2022-2027 (USD Billion)
9.2.7.3 Market Size, By End-User, 2022-2027 (USD Billion)
9.2.7.4 Market Size, By Application, 2022-2027 (USD Billion)
9.2.7.5 Market Size, By Offering, 2022-2027 (USD Billion)
9.2.8 Canada
9.2.8.1 Market Size, By Component, 2022-2027 (USD Billion)
9.2.8.2 Market Size, By Platform, 2022-2027 (USD Billion)
9.2.8.3 Market Size, By End-User, 2022-2027 (USD Billion)
9.2.8.4 Market Size, By Application, 2022-2027 (USD Billion)
9.2.8.5 Market Size, By Offering, 2022-2027 (USD Billion)
9.2.9 Mexico
9.2.9.1 Market Size, By Component, 2022-2027 (USD Billion)
9.2.9.2 Market Size, By Platform, 2022-2027 (USD Billion)
9.2.9.3 Market Size, By End-User, 2022-2027 (USD Billion)
9.2.9.4 Market Size, By Application, 2022-2027 (USD Billion)
9.2.9.5 Market Size, By Offering, 2022-2027 (USD Billion)
9.3 Europe
9.3.1 Market Size, By Country 2022-2027 (USD Billion)
9.3.2 Market Size, By Component, 2022-2027 (USD Billion)
9.3.3 Market Size, By Platform, 2022-2027 (USD Billion)
9.3.4 Market Size, By End-User, 2022-2027 (USD Billion)
9.3.5 Market Size, By Application, 2022-2027 (USD Billion)
9.3.6 Market Size, By Offering, 2022-2027 (USD Billion)
9.3.7 Germany
9.3.7.1 Market Size, By Component, 2022-2027 (USD Billion)
9.3.7.2 Market Size, By Platform, 2022-2027 (USD Billion)
9.3.7.3 Market Size, By End-User, 2022-2027 (USD Billion)
9.3.7.4 Market Size, By Application, 2022-2027 (USD Billion)
9.3.7.5 Market Size, By Offering, 2022-2027 (USD Billion)
9.3.8 UK
9.3.8.1 Market Size, By Component, 2022-2027 (USD Billion)
9.3.8.2 Market Size, By Platform, 2022-2027 (USD Billion)
9.3.8.3 Market Size, By End-User, 2022-2027 (USD Billion)
9.3.8.4 Market Size, By Application, 2022-2027 (USD Billion)
9.3.8.5 Market Size, By Offering, 2022-2027 (USD Billion)
9.3.9 France
9.3.9.1 Market Size, By Component, 2022-2027 (USD Billion)
9.3.9.2 Market Size, By Platform, 2022-2027 (USD Billion)
9.3.9.3 Market Size, By End-User, 2022-2027 (USD Billion)
9.3.9.4 Market Size, By Application, 2022-2027 (USD Billion)
9.3.9.5 Market Size, By Offering, 2022-2027 (USD Billion)
9.3.10 Italy
9.3.10.1 Market Size, By Component, 2022-2027 (USD Billion)
9.3.10.2 Market Size, By Platform, 2022-2027 (USD Billion)
9.3.10.3 Market Size, By End-User, 2022-2027 (USD Billion)
9.3.10.4 Market Size, By Application, 2022-2027 (USD Billion)
9.3.10.5 Market Size, By Offering, 2022-2027 (USD Billion)
9.4 Asia Pacific
9.4.1 Market Size, By Country 2022-2027 (USD Billion)
9.4.2 Market Size, By Component, 2022-2027 (USD Billion)
9.4.3 Market Size, By Platform, 2022-2027 (USD Billion)
9.4.4 Market Size, By End-User, 2022-2027 (USD Billion)
9.4.5 Market Size, By Application, 2022-2027 (USD Billion)
9.4.6 Market Size, By Offering, 2022-2027 (USD Billion)
9.4.7 China
9.4.7.1 Market Size, By Component, 2022-2027 (USD Billion)
9.4.7.2 Market Size, By Platform, 2022-2027 (USD Billion)
9.4.7.3 Market Size, By End-User, 2022-2027 (USD Billion)
9.4.7.4 Market Size, By Application, 2022-2027 (USD Billion)
9.4.7.5 Market Size, By Offering, 2022-2027 (USD Billion)
9.4.8 India
9.4.8.1 Market Size, By Component, 2022-2027 (USD Billion)
9.4.8.2 Market Size, By Platform, 2022-2027 (USD Billion)
9.4.8.3 Market Size, By End-User, 2022-2027 (USD Billion)
9.4.8.4 Market Size, By Application, 2022-2027 (USD Billion)
9.4.8.5 Market Size, By Offering, 2022-2027 (USD Billion)
9.4.9 Japan
9.4.9.1 Market Size, By Component, 2022-2027 (USD Billion)
9.4.9.2 Market Size, By Platform, 2022-2027 (USD Billion)
9.4.9.3 Market Size, By End-User, 2022-2027 (USD Billion)
9.4.9.4 Market Size, By Application, 2022-2027 (USD Billion)
9.4.9.5 Market Size, By Offering, 2022-2027 (USD Billion)
9.5 MEA
9.5.1 Market Size, By Country 2022-2027 (USD Billion)
9.5.2 Market Size, By Component, 2022-2027 (USD Billion)
9.5.3 Market Size, By Platform, 2022-2027 (USD Billion)
9.5.4 Market Size, By End-User, 2022-2027 (USD Billion)
9.5.5 Market Size, By Application, 2022-2027 (USD Billion)
9.5.6 Market Size, By Offering, 2022-2027 (USD Billion)
9.5.7 Saudi Arabia
9.5.7.1 Market Size, By Component, 2022-2027 (USD Billion)
9.5.7.2 Market Size, By Platform, 2022-2027 (USD Billion)
9.5.7.3 Market Size, By End-User, 2022-2027 (USD Billion)
9.5.7.4 Market Size, By Application, 2022-2027 (USD Billion)
9.5.7.5 Market Size, By Offering, 2022-2027 (USD Billion)
9.5.8 UAE
9.5.8.1 Market Size, By Component, 2022-2027 (USD Billion)
9.5.8.2 Market Size, By Platform, 2022-2027 (USD Billion)
9.5.8.3 Market Size, By End-User, 2022-2027 (USD Billion)
9.5.8.4 Market Size, By Application, 2022-2027 (USD Billion)
9.5.8.5 Market Size, By Offering, 2022-2027 (USD Billion)
9.5.9 South Africa
9.5.9.1 Market Size, By Component, 2022-2027 (USD Billion)
9.5.9.2 Market Size, By Platform, 2022-2027 (USD Billion)
9.5.9.3 Market Size, By End-User, 2022-2027 (USD Billion)
9.5.9.4 Market Size, By Application, 2022-2027 (USD Billion)
9.5.9.5 Market Size, By Offering, 2022-2027 (USD Billion)
Chapter 10 Company Landscape
10.1 Competitive Analysis, 2020
10.2 3i Inc.
10.2.1 Company Overview
10.2.2 Financial Analysis
10.2.3 Strategic Positioning
10.2.4 Info Graphic Analysis
10.3 Accenture plc
10.3.1 Company Overview
10.3.2 Financial Analysis
10.3.3 Strategic Positioning
10.3.4 Info Graphic Analysis
10.4 Apple Inc.
10.4.1 Company Overview
10.4.2 Financial Analysis
10.4.3 Strategic Positioning
10.4.4 Info Graphic Analysis
10.5 Atari, Inc.
10.5.1 Company Overview
10.5.2 Financial Analysis
10.5.3 Strategic Positioning
10.5.4 Info Graphic Analysis
10.6 Autodesk Inc.
10.6.1 Company Overview
10.6.2 Financial Analysis
10.6.3 Strategic Positioning
10.6.4 Info Graphic Analysis
10.7 ByteDance Ltd
10.7.1 Company Overview
10.7.2 Financial Analysis
10.7.3 Strategic Positioning
10.7.4 Info Graphic Analysis
10.8 Dapper Labs
10.8.1 Company Overview
10.8.2 Financial Analysis
10.8.3 Strategic Positioning
10.8.4 Info Graphic Analysis
10.9 Decentraland
10.9.1 Company Overview
10.9.2 Financial Analysis
10.9.3 Strategic Positioning
10.10.4 Info Graphic Analysis
10.10 Epic Games, Inc.
10.10.1 Company Overview
10.10.2 Financial Analysis
10.10.3 Strategic Positioning
10.10.4 Info Graphic Analysis
10.10 Zensar Technologies Limited
10.11.1 Company Overview
10.11.2 Financial Analysis
10.11.3 Strategic Positioning
10.11.4 Info Graphic Analysis
10.12 Zensar Technologies Limited
10.12.1 Company Overview
10.12.2 Financial Analysis
10.12.3 Strategic Positioning
10.12.4 Info Graphic Analysis
10.13 Fastly, Google LLC
10.13.1 Company Overview
10.13.2 Financial Analysis
10.13.3 Strategic Positioning
10.13.4 Info Graphic Analysis
10.14 Fastly, Google LLC
10.14.1 Company Overview
10.14.2 Financial Analysis
10.14.3 Strategic Positioning
10.14.4 Info Graphic Analysis
10.15 Google LLC
10.15.1 Company Overview
10.15.2 Financial Analysis
10.15.3 Strategic Positioning
10.15.4 Info Graphic Analysis
10.16 Hyperlink InfoSystem
10.16.1 Company Overview
10.16.2 Financial Analysis
10.16.3 Strategic Positioning
10.16.4 Info Graphic Analysis
10.11 IBM Corporation
10.11.1 Company Overview
10.11.2 Financial Analysis
10.11.3 Strategic Positioning
10.11.4 Info Graphic Analysis
10.12 Infor
10.12.1 Company Overview
10.12.2 Financial Analysis
10.12.3 Strategic Positioning
10.12.4 Info Graphic Analysis
10.13 Infosys Limited
10.13.1 Company Overview
10.13.2 Financial Analysis
10.13.3 Strategic Positioning
10.13.4 Info Graphic Analysis
10.14 Lilith Games
10.14.1 Company Overview
10.14.2 Financial Analysis
10.14.3 Strategic Positioning
10.14.4 Info Graphic Analysis
10.15 Lilith Games
10.15.1 Company Overview
10.15.2 Financial Analysis
10.15.3 Strategic Positioning
10.15.4 Info Graphic Analysis
10.16 Madeium
10.16.1 Company Overview
10.16.2 Financial Analysis
10.16.3 Strategic Positioning
10.16.4 Info Graphic Analysis
10.17 Magic Leap, Inc.
10.17.1 Company Overview
10.17.2 Financial Analysis
10.17.3 Strategic Positioning
10.17.4 Info Graphic Analysis
10.18 Meta Platforms, Inc. (Facebook, Inc.)
10.18.1 Company Overview
10.18.2 Financial Analysis
10.18.3 Strategic Positioning
10.18.4 Info Graphic Analysis
10.19 Microsoft Corporation
10.19.1 Company Overview
10.19.2 Financial Analysis
10.19.3 Strategic Positioning
10.19.4 Info Graphic Analysis
10.20 NetEase, Inc.
10.20.1 Company Overview
10.20.2 Financial Analysis
10.20.3 Strategic Positioning
10.20.4 Info Graphic Analysis
10.21 Nextech AR Solutions Inc.
10.21.1 Company Overview
10.21.2 Financial Analysis
10.21.3 Strategic Positioning
10.21.4 Info Graphic Analysis
10.22 NVIDIA Corporation
10.22.1 Company Overview
10.22.2 Financial Analysis
10.22.3 Strategic Positioning
10.22.4 Info Graphic Analysis
10.23 Oracle Corporation
10.23.1 Company Overview
10.23.2 Financial Analysis
10.23.3 Strategic Positioning
10.23.4 Info Graphic Analysis
10.24 PTC Inc.
10.24.1 Company Overview
10.24.2 Financial Analysis
10.24.3 Strategic Positioning
10.24.4 Info Graphic Analysis
10.25 Roblox Corporation
10.25.1 Company Overview
10.25.2 Financial Analysis
10.25.3 Strategic Positioning
10.25.4 Info Graphic Analysis
10.26 SAP SE
10.26.1 Company Overview
10.26.2 Financial Analysis
10.26.3 Strategic Positioning
10.26.4 Info Graphic Analysis
10.27 Synthesis AI
10.27.1 Company Overview
10.27.2 Financial Analysis
10.27.3 Strategic Positioning
10.27.4 Info Graphic Analysis
10.28 Systems Engineering & Assessment Ltd.
10. 28.1 Company Overview
10. 28.2 Financial Analysis
10. 28.3 Strategic Positioning
10. 28.4 Info Graphic Analysis
10.29 Tencent Holdings Ltd.
10.29.1 Company Overview
10.29.2 Financial Analysis
10.29.3 Strategic Positioning
10.29.4 Info Graphic Analysis
10.30 Unity Technologies, Inc
10.30.1 Company Overview
10.30.2 Financial Analysis
10.30.3 Strategic Positioning
10.30.4 Info Graphic Analysis
The Global Metaverse Market has been studied from the year 2019 till 2027. However, the CAGR provided in the report is from the year 2022 to 2027. The research methodology involved three stages: Desk research, Primary research, and Analysis & Output from the entire research process.

The desk research involved a robust background study which meant referring to paid and unpaid databases to understand the market dynamics; mapping contracts from press releases; identifying the key players in the market, studying their product portfolio, competition level, annual reports/SEC filings & investor presentations; and learning the demand and supply-side analysis for the Metaverse Market.

The primary research activity included telephonic conversations with more than 50 tier 1 industry consultants, distributors, and end-use product manufacturers.

Finally, based on the above thorough research process, an in-depth analysis was carried out considering the following aspects: market attractiveness, current & future market trends, market share analysis, SWOT analysis of the company and customer analytics.

Frequently Asked Questions
![Global Metaverse Market Size, Trends & Analysis - Forecasts to 2027 By Component (Software & Services, Displays, AR/VR Headsets, Asset Creation Tools, Programming Engines, Extended Reality Hardware [Smart Glasses, Omni Treadmills, and Haptic Sensors & Devices], and Others), By Platform (Desktop/Laptops, Mobiles, and Wearables), By Application (Gaming, Online Shopping, Content Creation, Social Media, Conference, Virtual Runway Shows, Aircraft Maintenance, and Others), By End-User (Fashion, Media & Entertainment, Aerospace & Defense, Education, Real Estate & Interior Designing, and Others), By Offerings (Virtual Platform, Asset Marketplace, Avatars, and Financial Services), By Region (North America, Asia Pacific, Europe, Central & South America, Middle East & Africa), End-User Landscape, Company Market Share Analysis, and Competitor Analysis](https://www.globalmarketestimates.com/images/cat/Electronics, Semiconductors and Information & Communication Technology.png)
This FREE sample includes market data points, ranging from trend analyses to market estimates & forecasts. See for yourself.
Or view our licence options:
Tailor made solutions just for you
80% of our clients seek made-to-order reports. How do you want us to tailor yours?
OUR CLIENTS


