This report was recently updated on August 19 2025 with the latest and most recent
market numbers
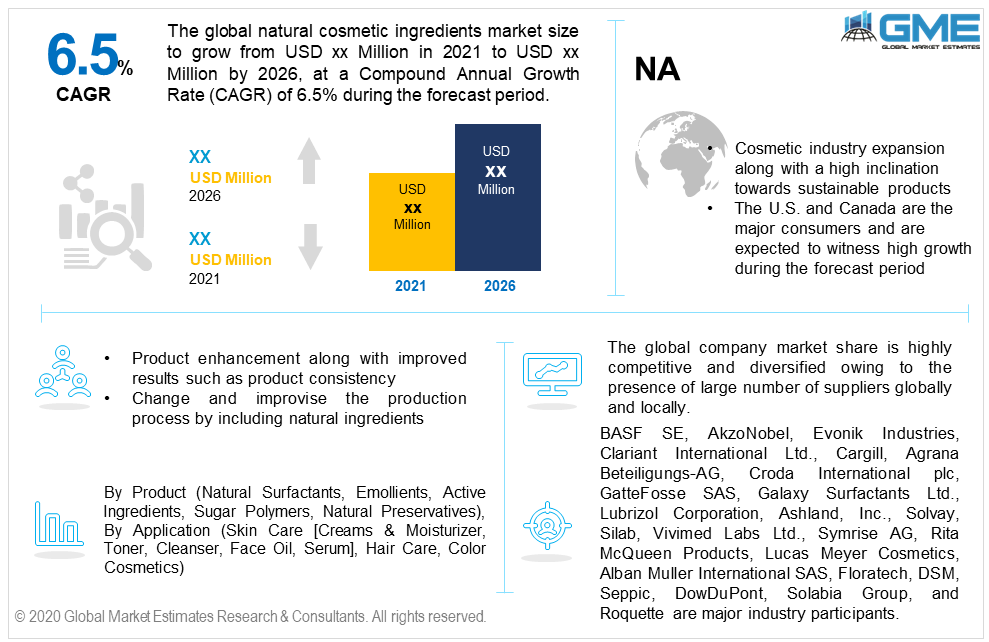
Global Natural Cosmetic Ingredients Market Size, Trends & Analysis - Forecasts to 2026 By Product (Natural Surfactants, Emollients, Active Ingredients, Sugar Polymers, Natural Preservatives), By Application (Skin Care [Creams & Moisturizer, Toner, Cleanser, Face Oil, Serum], Hair Care, Color Cosmetics), By Region (North America, Asia Pacific, Europe, Latin America, Middle East & Africa); End-User Landscape, Company Market Share Analysis, and Competitor Analysis
Rising demand for green labeled beauty products along with increasing consumer willingness to pay premium prices are major success factors to drive natural cosmetic ingredients demand. The presence of various raw materials and compounds and their successful blend with final product formulation have opened new opportunities in the industry.
The global natural cosmetic ingredients market size will witness more than 6.5% CAGR from 2021 to 2026, with North America leading the revenue share. Rising consumer consciousness to use organic personal care products along with increasing R&D investment to process & utilize biobased compounds have instigated the product penetration.
Advanced product development due to new product formulation along with the utilization of sustainable elements & compounds is the major factor to induce market expansion. However, shorter shelf life as compared to conventional products may pose a threat to industry manufacturers.
The product segment is segregated into surfactants, active ingredients, emollients, preservatives, and sugar polymers. Surfactants will account for the largest market share in the coming years owing to their high contribution to the making of beauty products. The majorly used natural surfactants type includes Coco glucoside, Decyl glucoside, Lauryl glucoside, Sucrose cocoate, and Caprylyl/Capryl glucoside. These are organic compounds that help in stabilizing the product quality and consistency.
The other prospective product which is gaining high demand is the active ingredients. Active ingredients are projected to foresee the fastest gains during the forecast period. Organic butter, oil, and gels are key identified active ingredients in the industry.
Aloe vera, fish oil, soybean, jojoba oil, and palm kernel oil are the highly used materials in organic personal care goods. These materials are proven to give extraordinary results when used in the manufacturing of skincare and hair care products.
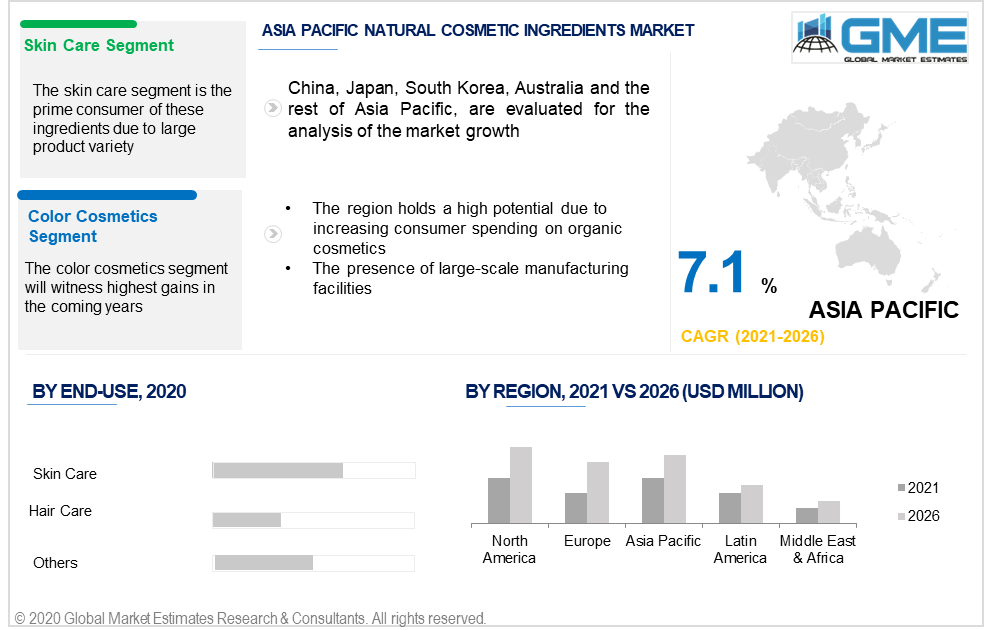
Skincare, haircare, and color cosmetics are among the major applications in the industry. Skincare dominated the overall application segment and accounted for more than 30% of the revenue share in 2019. Later, the skincare applications are sub-segmented into creams & moisturizers, cleanser, toner, serum, and face oil. Availability of diversified product variety to suit various purposes along with high demand for organic skincare products are key success factors to drive demand in this application.
The other potential segment is the hair care application, which will observe more than 6.1% CAGR in the coming years. Increasing consumer interest towards non-harmful chemical-based products for hair will induce growth in this segment. The color cosmetics are expected to foresee the highest gains up to 2026. Changing industry dynamics towards the blend of organic materials in makeup products will open new opportunities in the industry.
North America dominated regional demand in 2019 and is expected to hold more than 45% of the revenue share by 2026. Increasing consumer preference to use green-labeled products along with the willingness to pay for high priced organic products are major factors to drive regional demand. Another influencing factor is the wide product availability and government support for organic products which makes it easier to commercialize and sell the product within the region.
The European market will witness notable growth during the forecast period. Rising government intervention to support eco-friendly consumer goods along with increasing consumer spending on organic products will drive regional growth. The presence of large-scale producers offering diversified products will support the demand in this region.
The Asia Pacific will observe the fastest growth of more than 7.1% CAGR up to 2026. The region holds a high potential due to increasing consumer interest in organic products. Another major factor to influence regional sales is the presence of large-scale companies manufacturing products in China and India. China, South Korea, Japan, and India are major countries to contribute high sales owing to their high involvement and consumption related to beauty care products.
BASF SE, AkzoNobel, Evonik Industries, Clariant International Ltd., Cargill, Inc., Agrana Beteiligungs-AG, Croda International plc, GatteFosse SAS, Galaxy Surfactants Ltd., Lubrizol Corporation, Ashland, Inc., Solvay, Silab, Vivimed Labs Ltd., Symrise AG, Rita McQueen Products, Lucas Meyer Cosmetics, Alban Muller International SAS, Floratech, Koninklijke DSM N.V., Seppic S.A., DowDuPont, Solabia Group, and Roquette are major industry participants.
Please note: This is not an exhaustive list of companies profiled in the report.
The global company market share is fragmented and highly competitive due to the presence of a large number of suppliers globally and locally. Streamlined purchase agreements with the product manufacturers along with enhancing presence across the value chain are prime strategies observed in the industry.
Chapter 1 Methodology
1.1 Market scope & definitions
1.2 Estimates & forecast calculation
1.3 Historical data overview and validation
1.4 Data sources
1.4.1 Secondary
1.4.2 Primary
Chapter 2 Report Outlook
2.1 Natural Cosmetic Ingredient industry overview, 2019-2026
2.1.1 Industry overview
2.1.2 Product overview
2.1.3 Application overview
2.1.4 Regional overview
Chapter 3 Natural Cosmetic Ingredient Market Trends
3.1 Market segmentation
3.2 Industry background, 2019-2026
3.3 Market key trends
3.3.1 Positive trends
3.3.2 Industry challenges
3.4 Prospective growth scenario
3.4.1 Product growth scenario
3.5 Industry influence over product growth
3.6 Porter’s analysis
3.7 PESTEL analysis
3.8 Value chain & supply chain analysis
3.9 Regulatory framework
3.9.1 North America
3.9.2 Europe
3.9.3 APAC
3.9.4 LATAM
3.9.5 MEA
3.10 Technology overview
3.11 Market share analysis, 2020
3.11.1 Company positioning overview, 2020
Chapter 4 Natural Cosmetic Ingredient Market, By Product
4.1 Product Outlook
4.2 Natural surfactants
4.2.1 Market size, by region, 2019-2026 (USD Million)
4.3 Emollients
4.3.1 Market size, by region, 2019-2026 (USD Million)
4.4 Active ingredients
4.4.1 Market size, by region, 2019-2026 (USD Million)
4.5 Sugar polymers
4.5.1 Market size, by region, 2019-2026 (USD Million)
4.6 Natural Preservatives
4.6.1 Market size, by region, 2019-2026 (USD Million)
4.7 Others
4.7.1 Market size, by region, 2019-2026 (USD Million)
Chapter 5 Natural Cosmetic Ingredient Market, By Application
5.1 Application Outlook
5.2 Skin care
5.2.1 Market size, by region, 2019-2026 (USD Million)
5.2.2 Creams & moisturizers
5.2.2.1 Market size, by region, 2019-2026 (USD Million)
5.2.3 Toner
5.2.3.1 Market size, by region, 2019-2026 (USD Million)
5.2.4 Cleanser
5.2.4.1 Market size, by region, 2019-2026 (USD Million)
5.2.5 Face oil
5.2.5.1 Market size, by region, 2019-2026 (USD Million)
5.2.6 Serum
5.2.6.1 Market size, by region, 2019-2026 (USD Million)
5.2.7 Others
5.2.7.1 Market size, by region, 2019-2026 (USD Million)
5.3 Hair care
5.3.1 Market size, by region, 2019-2026 (USD Million)
5.4 Color cosmetics
5.4.1 Market size, by region, 2019-2026 (USD Million)
5.5 Others
5.5.1 Market size, by region, 2019-2026 (USD Million)
Chapter 6 Natural Cosmetic Ingredient Market, By Region
6.1 Regional outlook
6.2 North America
6.2.1 Market size, by country 2019-2026 (USD Million)
6.2.2 Market size, by product, 2019-2026 (USD Million)
6.2.3 Market size, by application, 2019-2026 (USD Million)
6.2.4 U.S.
6.2.4.1 Market size, by product, 2019-2026 (USD Million)
6.2.4.2 Market size, by application, 2019-2026 (USD Million)
6.2.5 Canada
6.2.5.1 Market size, by product, 2019-2026 (USD Million)
6.2.5.2 Market size, by application, 2019-2026 (USD Million)
6.3 Europe
6.3.1 Market size, by country 2019-2026 (USD Million)
6.3.2 Market size, by product, 2019-2026 (USD Million)
6.3.3 Market size, by application, 2019-2026 (USD Million)
6.3.4 Germany
6.2.4.1 Market size, by product, 2019-2026 (USD Million)
6.2.4.2 Market size, by application, 2019-2026 (USD Million)
6.3.5 UK
6.3.5.1 Market size, by product, 2019-2026 (USD Million)
6.3.5.2 Market size, by application, 2019-2026 (USD Million)
6.3.6 France
6.3.6.1 Market size, by product, 2019-2026 (USD Million)
6.3.6.2 Market size, by application, 2019-2026 (USD Million)
6.3.7 Italy
6.3.7.1 Market size, by product, 2019-2026 (USD Million)
6.3.7.2 Market size, by application, 2019-2026 (USD Million)
6.3.8 Spain
6.3.8.1 Market size, by product, 2019-2026 (USD Million)
6.3.8.2 Market size, by application, 2019-2026 (USD Million)
6.3.9 Russia
6.3.9.1 Market size, by product, 2019-2026 (USD Million)
6.3.9.2 Market size, by application, 2019-2026 (USD Million)
6.4 Asia Pacific
6.4.1 Market size, by country 2019-2026 (USD Million)
6.4.2 Market size, by product, 2019-2026 (USD Million)
6.4.3 Market size, by application, 2019-2026 (USD Million)
6.4.4 China
6.4.4.1 Market size, by product, 2019-2026 (USD Million)
6.4.4.2 Market size, by application, 2019-2026 (USD Million)
6.4.5 Japan
6.4.5.1 Market size, by product, 2019-2026 (USD Million)
6.4.5.2 Market size, by application, 2019-2026 (USD Million)
6.4.6 Australia
6.4.6.1 Market size, by product, 2019-2026 (USD Million)
6.4.6.2 Market size, by application, 2019-2026 (USD Million)
6.4.7 Singapore
6.4.7.1 Market size, by product, 2019-2026 (USD Million)
6.4.7.2 Market size, by application, 2019-2026 (USD Million)
6.4.8 South Korea
6.4.8.1 Market size, by product, 2019-2026 (USD Million)
6.4.8.2 Market size, by application, 2019-2026 (USD Million)
6.5 Latin America
6.5.1 Market size, by country 2019-2026 (USD Million)
6.5.2 Market size, by product, 2019-2026 (USD Million)
6.5.3 Market size, by application, 2019-2026 (USD Million)
6.5.4 Brazil
6.5.4.1 Market size, by product, 2019-2026 (USD Million)
6.5.4.2 Market size, by application, 2019-2026 (USD Million)
6.5.5 Mexico
6.5.5.1 Market size, by product, 2019-2026 (USD Million)
6.5.5.2 Market size, by application, 2019-2026 (USD Million)
6.6 MEA
6.6.1 Market size, by country 2019-2026 (USD Million)
6.6.2 Market size, by product, 2019-2026 (USD Million)
6.6.3 Market size, by application, 2019-2026 (USD Million)
6.6.4 Saudi Arabia
6.6.4.1 Market size, by product, 2019-2026 (USD Million)
6.6.4.2 Market size, by application, 2019-2026 (USD Million)
6.6.5 UAE
6.6.5.1 Market size, by product, 2019-2026 (USD Million)
6.6.5.2 Market size, by application, 2019-2026 (USD Million)
Chapter 7 Company Landscape
7.1 Competitive analysis, 2020
7.2 BASF SE
7.2.1 Company overview
7.2.2 Financial analysis
7.2.3 Strategic positioning
7.2.4 Info graphic analysis
7.3 AkzoNobel
7.3.1 Company overview
7.3.2 Financial analysis
7.3.3 Strategic positioning
7.3.4 Info graphic analysis
7.4 Clariant International Ltd.
7.4.1 Company overview
7.4.2 Financial analysis
7.4.3 Strategic positioning
7.4.4 Info graphic analysis
7.5 Evonik Industries
7.5.1 Company overview
7.5.2 Financial analysis
7.5.3 Strategic positioning
7.5.4 Info graphic analysis
7.6 Agrana Beteiligungs-AG
7.6.1 Company overview
7.6.2 Financial analysis
7.6.3 Strategic positioning
7.6.4 Info graphic analysis
7.7 Cargill, Inc.
7.7.1 Company overview
7.7.2 Financial analysis
7.7.3 Strategic positioning
7.7.4 Info graphic analysis
7.8 Croda International plc
7.8.1 Company overview
7.8.2 Financial analysis
7.8.3 Strategic positioning
7.8.4 Info graphic analysis
7.9 Galaxy Surfactants Ltd.
7.9.1 Company overview
7.9.2 Financial analysis
7.9.3 Strategic positioning
7.9.4 Info graphic analysis
7.10 GatteFosse SAS
7.10.1 Company overview
7.10.2 Financial analysis
7.10.3 Strategic positioning
7.10.4 Info graphic analysis
7.11 Lubrizol Corporation
7.11.1 Company overview
7.11.2 Financial analysis
7.11.3 Strategic positioning
7.11.4 Info graphic analysis
7.12 Ashland, Inc.
7.12.1 Company overview
7.12.2 Financial analysis
7.12.3 Strategic positioning
7.12.4 Info graphic analysis
7.13 Silab
7.13.1 Company overview
7.13.2 Financial analysis
7.13.3 Strategic positioning
7.13.4 Info graphic analysis
7.14 Solvay
7.14.1 Company overview
7.14.2 Financial analysis
7.14.3 Strategic positioning
7.14.4 Info graphic analysis
7.15 Symrise AG
7.15.1 Company overview
7.15.2 Financial analysis
7.15.3 Strategic positioning
7.15.4 Info graphic analysis
7.16 Vivimed Labs Ltd.
7.16.1 Company overview
7.16.2 Financial analysis
7.16.3 Strategic positioning
7.16.4 Info graphic analysis
7.17 Rita McQueen Products
7.17.1 Company overview
7.17.2 Financial analysis
7.17.3 Strategic positioning
7.17.4 Info graphic analysis
7.18 Alban Muller International SAS
7.18.1 Company overview
7.18.2 Financial analysis
7.18.3 Strategic positioning
7.18.4 Info graphic analysis
7.19 Lucas Meyer Cosmetics
7.19.1 Company overview
7.19.2 Financial analysis
7.19.3 Strategic positioning
7.19.4 Info graphic analysis
7.20 Floratech
7.20.1 Company overview
7.20.2 Financial analysis
7.20.3 Strategic positioning
7.20.4 Info graphic analysis
7.21 Seppic S.A.
7.21.1 Company overview
7.21.2 Financial analysis
7.21.3 Strategic positioning
7.21.4 Info graphic analysis
7.22 Koninklijke DSM N.V.
7.22.1 Company overview
7.22.2 Financial analysis
7.22.3 Strategic positioning
7.22.4 Info graphic analysis
7.23 DowDuPont
7.23.1 Company overview
7.23.2 Financial analysis
7.23.3 Strategic positioning
7.23.4 Info graphic analysis
7.24 Roquette
7.24.1 Company overview
7.24.2 Financial analysis
7.24.3 Strategic positioning
7.24.4 Info graphic analysis
7.25 Solabia Group
7.25.1 Company overview
7.25.2 Financial analysis
7.25.3 Strategic positioning
7.25.4 Info graphic analysis
The Global Natural Cosmetic ingredients Market has been studied from the year 2019 till 2026. However, the CAGR provided in the report is from the year 2021 to 2026. The research methodology involved three stages: Desk research, Primary research, and Analysis & Output from the entire research process.

The desk research involved a robust background study which meant referring to paid and unpaid databases to understand the market dynamics; mapping contracts from press releases; identifying the key players in the market, studying their product portfolio, competition level, annual reports/SEC filings & investor presentations; and learning the demand and supply-side analysis for the Natural Cosmetic ingredients Market.

The primary research activity included telephonic conversations with more than 50 tier 1 industry consultants, distributors, and end-use product manufacturers.

Finally, based on the above thorough research process, an in-depth analysis was carried out considering the following aspects: market attractiveness, current & future market trends, market share analysis, SWOT analysis of the company and customer analytics.

Frequently Asked Questions
![Global Natural Cosmetic Ingredients Market Size, Trends & Analysis - Forecasts to 2026 By Product (Natural Surfactants, Emollients, Active Ingredients, Sugar Polymers, Natural Preservatives), By Application (Skin Care [Creams & Moisturizer, Toner, Cleanser, Face Oil, Serum], Hair Care, Color Cosmetics), By Region (North America, Asia Pacific, Europe, Latin America, Middle East & Africa); End-User Landscape, Company Market Share Analysis, and Competitor Analysis](https://www.globalmarketestimates.com/images/cat/Chemicals & Advanced Material.png)
This FREE sample includes market data points, ranging from trend analyses to market estimates & forecasts. See for yourself.
Or view our licence options:
Tailor made solutions just for you
80% of our clients seek made-to-order reports. How do you want us to tailor yours?
OUR CLIENTS


