This report was recently updated on August 28 2025 with the latest and most recent
market numbers
Global Non-Fungible Tokens Market Size, Trends & Analysis - Forecasts to 2026 Type of Product (Digital Objects/ Online Product and Physical Objects), By Application (Art & Literature, Audio & Video, Game, Insurance, Real Estate, Automobile, and Others), By Usage (Personal Use and Commercial Use), By Region (North America, Asia Pacific, CSA, Europe, and the Middle East and Africa), Company Market Share Analysis, and Competitor Analysis
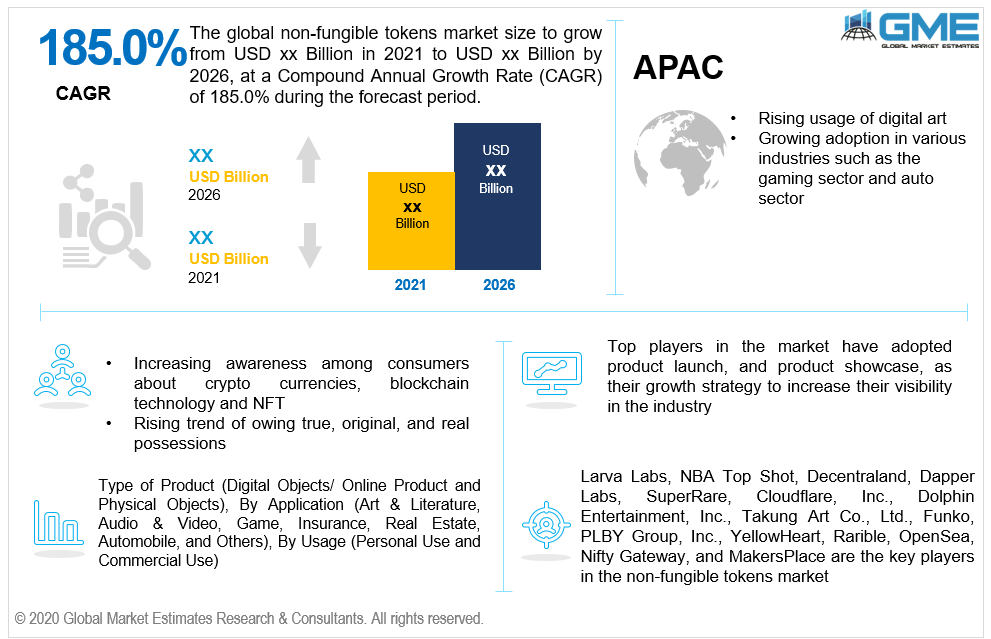
The global non-fungible tokens market is projected to grow at a CAGR value of 185.0% from 2021 to 2026.
A non-interchangeable and unique/specialized unit of data is called as non-fungible token. With extreme easiness and high individuality, this digital asset is based on the blockchain technology. Blockchain such as Ethereum, Flow, Matic, and Wax are used to build the NFTs. Along with its high applicability for digital transaction, NFT is also crucially available for physical asset. NFT offers exclusive ownership within the digital and physical market space.
The NFTs are blockchain-certified copies that are unique and cannot be duplicated or re-used. These are digital assets or units of data stored in a digital ledger which is called a blockchain. These assets are encoded with similar software, simplifying the transaction process, as these are bought and sold using crypto currency. Users can use these tokens to represent ownership of unique items.
The market for NFT is expected to grow rapidly owing to rapidly advancing digital economy, increasing awareness among consumers about crypto currencies, blockchain technology and NFT, rising trend of owing true, original, and real possessions such as music audio, movie, video, lyrics, pictures or portraits etc. The augmentation of NFT will definitely clear the hurdles between the digital and physical worlds. Other factors driving the growth of the market are rising usage of digital art, its growing adoption in various industries especially in the gaming sector and others, rising awareness about the benefits of NFT in developing nations. Moreover, the rising purchase of bitcoins, rising government support for legalization of crypto currencies across developed nations are other two major drivers of the market.
The type of product or data which can be owned through NFT is digital graphic art, real estate, identity management systems, music, films, virtual world, and others. NFTs are quite different from crypto currencies. Crypto currencies provide an identical and interchangeable value in each unit, which can be traded for the other. On the other hand, NFTs offer a unique value in each data unit, and are ideal for exchanges of rare collectibles. Some of the key players in this market are Larva Labs, NBA Top Shot, Decentraland, Dapper Labs, SuperRare, Cloudflare, Inc., Dolphin Entertainment, Inc., among others.
Owing to pro-longed and forced global lockdown rule, the market for NFT was impacted positively. Thus, the rising need for a substitute for social contact/ physical contact turned many users to online metaverses platforms in order to enrich their social interaction ability and adopt NFTs. In addition, the COVID-19 has positively impacted the gaming and music industry which has helped the non-fungible token market to grow up to some extent during pandemics.
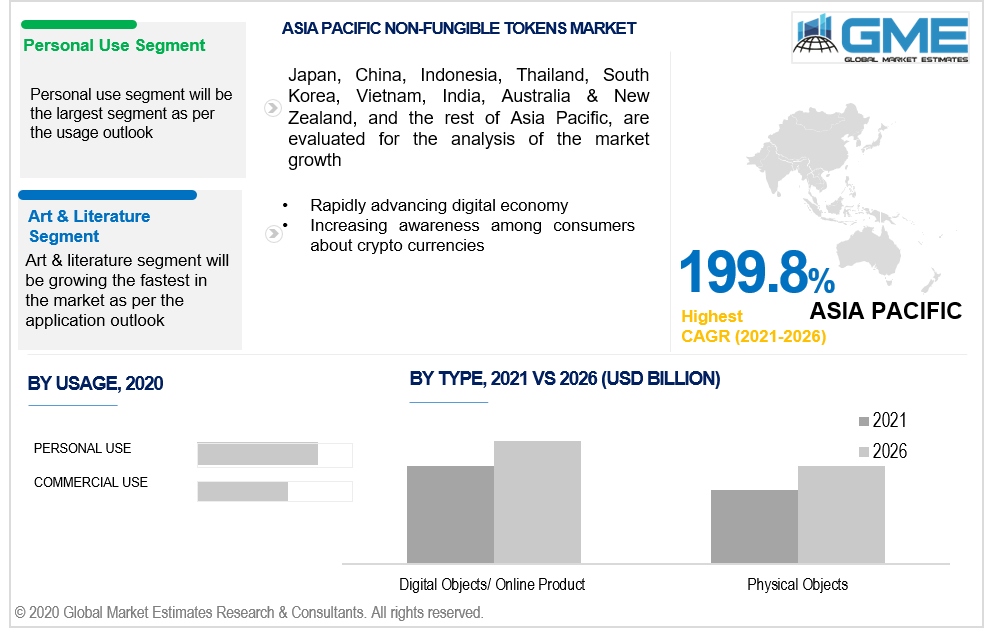
Based on the type, the non-fungible tokens market is divided into digital objects/ online product and physical objects. The digital objects/ online product segment is expected to be the largest shareholder in the market and this trend is expected to be constant during the forecast period of 2021 to 2026. NFTs were introduced with a unique value in each data of its unit, which were ideal for exchanges of rare collectibles displayed online. The augment of COVID-19 has also supported this trend. However, use of NFT for physical possession is expected to grow at a faster rate as compared to the online product/ digital object.
Based on usage, the non-fungible tokens market is divided into personal use and commercial use. The personal use segment is analyzed to be the fastest growing segment when compared to the commercial use of NFTs. However, with the government support throughout major nations, the market for commercial use is expected to achieve a considerable revenue during the forecast period.
Based on application, the market of non-fungible tokens is divided into art & literature, audio & video, game, insurance, real estate, automobile, and others. Art segment includes Fractal/Algorithmic Art, Pixel Art, 2D/3D Painting, Computer Generated Painting, 2D/3D Computer Graphics, GIFs, while game segment covers video games, trading card games, and strategy role playing games. The art segment is analyzed to be the largest shareholder in the market and this trend is expected to continue from 2021 to 2026. Rising use of digital art is one of the prime reasons for the segment’s dominance in the market.
As per the geographical analysis, the non-fungible tokens market can be classified into North America (the United States, Canada, and Mexico), Asia Pacific (India, China, Japan, Malaysia, Singapore, and the Rest of Asia Pacific), Europe (Germany, United Kingdom, Italy, France, Spain, Netherlands, and Rest of Europe), Middle East & Africa (Saudi Arabia, United Arab Emirates, and Rest of the Middle East & Africa) and Central & South America (Brazil, Argentina, and Rest of Central and South America).
North America (the United States, Canada, and Mexico) will have a dominant share in the non-fungible tokens market from 2021 to 2026. Factors such as increasing demand and awareness regarding digital art in the region, robust development in the world of blockchain technology, high adoption of crypto currency are some of the factors supporting the dominance of the region in the market. As of 2021, around 106 million people across the globe utilize crypto currencies, and nearly 46 million Americans own a share of Bitcoin. Moreover, the Asia-Pacific region is expected to be the fastest growing segment in the non-fungible tokens market during the forecast period.
Larva Labs, NBA Top Shot, Decentraland, Dapper Labs, SuperRare, Cloudflare, Inc., Dolphin Entertainment, Inc., Takung Art Co., Ltd., Funko, PLBY Group, Inc., YellowHeart, Rarible, OpenSea, Nifty Gateway, and MakersPlace are the key players in the non-fungible tokens market.
Please note: This is not an exhaustive list of companies profiled in the report.
Chapter 1 Methodology
1.1 Market Scope & Definitions
1.2 Estimates & Forecast Calculation
1.3 Historical Data Overview and Validation
1.4 Data Sources
1.4.1 Secondary
1.4.2 Primary
Chapter 2 Report Outlook
2.1 Non-Fungible Tokens Industry Overview, 2021-2026
2.1.1 Industry Overview
2.1.2 Type Overview
2.1.3 Application Overview
2.1.4 Usage Overview
2.1.6 Regional Overview
Chapter 3 Non-Fungible Tokens Market Trends
3.1 Market Segmentation
3.2 Industry Background, 2021-2026
3.3 Market Key Trends
3.3.1 Positive Trends
3.3.1.1 Rapidly advancing digital economy
3.3.2 Industry Challenges
3.3.2.1 Lack of blockchain technology awareness in third world nations
3.4 Prospective Growth Scenario
3.4.1 Type Growth Scenario
3.4.2 Application Growth Scenario
3.4.3 Usage Growth Scenario
3.5 COVID-19 Influence over Industry Growth
3.6 Porter’s Analysis
3.7 PESTEL Analysis
3.8 Value Chain & Supply Chain Analysis
3.9 Regulatory Framework
3.9.1 North America
3.9.2 Europe
3.9.3 APAC
3.9.4 LATAM
3.9.5 MEA
3.10 Usage Overview
3.11 Market Share Analysis, 2020
3.11.1 Company Positioning Overview, 2020
Chapter 4 Non-Fungible Tokens Market, By Type
4.1 Type Outlook
4.2 Digital Objects/ Online Product
4.2.1 Market Size, By Region, 2021-2026 (USD Billion)
4.3 Physical Objects
4.3.1 Market Size, By Region, 2021-2026 (USD Billion)
Chapter 5 Non-Fungible Tokens Market, By Application
5.1 Application Outlook
5.2 Art & Literature
5.2.1 Market Size, By Region, 2021-2026 (USD Billion)
5.3 Audio & Video
5.3.1 Market Size, By Region, 2021-2026 (USD Billion)
5.4 Game
5.4.1 Market Size, By Region, 2021-2026 (USD Billion)
5.5 Insurance
5.5.1 Market Size, By Region, 2021-2026 (USD Billion)
5.6 Real Estate
5.6.1 Market Size, By Region, 2021-2026 (USD Billion)
5.7 Automobile
5.7.1 Market Size, By Region, 2021-2026 (USD Billion)
5.8 Others
5.8.1 Market Size, By Region, 2021-2026 (USD Billion)
Chapter 6 Non-Fungible Tokens Market, By Usage
6.1 Personal Use
6.1.1 Market Size, By Region, 2021-2026 (USD Billion)
6.2 Commercial Use
6.2.1 Market Size, By Region, 2021-2026 (USD Billion)
Chapter 7 Non-Fungible Tokens Market, By Region
7.1 Regional outlook
7.2 North America
7.2.1 Market Size, By Country 2021-2026 (USD Billion)
7.2.2 Market Size, By Type, 2021-2026 (USD Billion)
7.2.3 Market Size, By Application, 2021-2026 (USD Billion)
7.2.4 Market Size, By Usage, 2021-2026 (USD Billion)
7.2.6 U.S.
7.2.6.1 Market Size, By Type, 2021-2026 (USD Billion)
7.2.4.2 Market Size, By Application, 2021-2026 (USD Billion)
7.2.4.3 Market Size, By Usage, 2021-2026 (USD Billion)
7.2.7 Canada
7.2.7.1 Market Size, By Type, 2021-2026 (USD Billion)
7.2.7.2 Market Size, By Application, 2021-2026 (USD Billion)
7.2.7.3 Market Size, By Usage, 2021-2026 (USD Billion)
7.3 Europe
7.3.1 Market Size, By Country 2021-2026 (USD Billion)
7.3.2 Market Size, By Type, 2021-2026 (USD Billion)
7.3.3 Market Size, By Application, 2021-2026 (USD Billion)
7.3.4 Market Size, By Usage, 2021-2026 (USD Billion)
7.3.6 Germany
7.3.6.1 Market Size, By Type, 2021-2026 (USD Billion)
7.3.6.2 Market Size, By Application, 2021-2026 (USD Billion)
7.3.6.3 Market Size, By Usage, 2021-2026 (USD Billion)
7.3.7 UK
7.3.7.1 Market Size, By Type, 2021-2026 (USD Billion)
7.3.7.2 Market Size, By Application, 2021-2026 (USD Billion)
7.3.7.3 Market Size, By Usage, 2021-2026 (USD Billion)
7.3.8 France
7.3.7.1 Market Size, By Type, 2021-2026 (USD Billion)
7.3.7.2 Market Size, By Application, 2021-2026 (USD Billion)
7.3.7.3 Market Size, By Usage, 2021-2026 (USD Billion)
7.3.9 Italy
7.3.9.1 Market Size, By Type, 2021-2026 (USD Billion)
7.3.9.2 Market Size, By Application, 2021-2026 (USD Billion)
7.3.9.3 Market Size, By Usage, 2021-2026 (USD Billion)
7.3.10 Spain
7.3.10.1 Market Size, By Type, 2021-2026 (USD Billion)
7.3.10.2 Market Size, By Application, 2021-2026 (USD Billion)
7.3.10.3 Market Size, By Usage, 2021-2026 (USD Billion)
7.3.11 Russia
7.3.11.1 Market Size, By Type, 2021-2026 (USD Billion)
7.3.11.2 Market Size, By Application, 2021-2026 (USD Billion)
7.3.11.3 Market Size, By Usage, 2021-2026 (USD Billion)
7.4 Asia Pacific
7.4.1 Market Size, By Country 2021-2026 (USD Billion)
7.4.2 Market Size, By Type, 2021-2026 (USD Billion)
7.4.3 Market Size, By Application, 2021-2026 (USD Billion)
7.4.4 Market Size, By Usage, 2021-2026 (USD Billion)
7.4.6 China
7.4.6.1 Market Size, By Type, 2021-2026 (USD Billion)
7.4.6.2 Market Size, By Application, 2021-2026 (USD Billion)
7.4.6.3 Market Size, By Usage, 2021-2026 (USD Billion)
7.4.7 India
7.4.7.1 Market Size, By Type, 2021-2026 (USD Billion)
7.4.7.2 Market Size, By Application, 2021-2026 (USD Billion)
7.4.7.3 Market Size, By Usage, 2021-2026 (USD Billion)
7.4.8 Japan
7.4.7.1 Market Size, By Type, 2021-2026 (USD Billion)
7.4.7.2 Market Size, By Application, 2021-2026 (USD Billion)
7.4.7.3 Market Size, By Usage, 2021-2026 (USD Billion)
7.4.9 Australia
7.4.9.1 Market Size, By Type, 2021-2026 (USD Billion)
7.4.9.2 Market size, By Application, 2021-2026 (USD Billion)
7.4.9.3 Market Size, By Usage, 2021-2026 (USD Billion)
7.4.10 South Korea
7.4.10.1 Market Size, By Type, 2021-2026 (USD Billion)
7.4.10.2 Market Size, By Application, 2021-2026 (USD Billion)
7.4.10.3 Market Size, By Usage, 2021-2026 (USD Billion)
7.5 Latin America
7.5.1 Market Size, By Country 2021-2026 (USD Billion)
7.5.2 Market Size, By Type, 2021-2026 (USD Billion)
7.5.3 Market Size, By Application, 2021-2026 (USD Billion)
7.5.4 Market Size, By Usage, 2021-2026 (USD Billion)
7.5.6 Brazil
7.5.6.1 Market Size, By Type, 2021-2026 (USD Billion)
7.5.6.2 Market Size, By Application, 2021-2026 (USD Billion)
7.5.6.3 Market Size, By Usage, 2021-2026 (USD Billion)
7.5.7 Mexico
7.5.7.1 Market Size, By Type, 2021-2026 (USD Billion)
7.5.7.2 Market Size, By Application, 2021-2026 (USD Billion)
7.5.7.3 Market Size, By Usage, 2021-2026 (USD Billion)
7.5.8 Argentina
7.5.7.1 Market Size, By Type, 2021-2026 (USD Billion)
7.5.7.2 Market Size, By Application, 2021-2026 (USD Billion)
7.5.7.3 Market Size, By Usage, 2021-2026 (USD Billion)
7.6 MEA
7.6.1 Market Size, By Country 2021-2026 (USD Billion)
7.6.2 Market Size, By Type, 2021-2026 (USD Billion)
7.6.3 Market Size, By Application, 2021-2026 (USD Billion)
7.6.4 Market Size, By Usage, 2021-2026 (USD Billion)
7.6.6 Saudi Arabia
7.6.6.1 Market Size, By Type, 2021-2026 (USD Billion)
7.6.6.2 Market Size, By Application, 2021-2026 (USD Billion)
7.6.6.3 Market Size, By Usage, 2021-2026 (USD Billion)
7.6.7 UAE
7.6.7.1 Market Size, By Type, 2021-2026 (USD Billion)
7.6.7.2 Market Size, By Application, 2021-2026 (USD Billion)
7.6.7.3 Market Size, By Usage, 2021-2026 (USD Billion)
7.6.8 South Africa
7.6.7.1 Market Size, By Type, 2021-2026 (USD Billion)
7.6.7.2 Market Size, By Application, 2021-2026 (USD Billion)
7.6.7.3 Market Size, By Usage, 2021-2026 (USD Billion)
Chapter 8 Company Landscape
8.1 Competitive Analysis, 2020
8.2 Larva Labs
8.2.1 Company Overview
8.2.2 Financial Analysis
8.2.3 Strategic Positioning
8.2.4 Info Graphic Analysis
8.3 NBA Top Shot
8.3.1 Company Overview
8.3.2 Financial Analysis
8.3.3 Strategic Positioning
8.3.4 Info Graphic Analysis
8.4 Decentraland
8.4.1 Company Overview
8.4.2 Financial Analysis
8.4.3 Strategic Positioning
8.4.4 Info Graphic Analysis
8.5 Dapper Labs
8.5.1 Company Overview
8.5.2 Financial Analysis
8.5.3 Strategic Positioning
8.5.4 Info Graphic Analysis
8.6 SuperRare
8.6.1 Company Overview
8.6.2 Financial Analysis
8.6.3 Strategic Positioning
8.6.4 Info Graphic Analysis
8.7 Cloudflare, Inc.
8.7.1 Company Overview
8.7.2 Financial Analysis
8.7.3 Strategic Positioning
8.7.4 Info Graphic Analysis
8.8 Dolphin Entertainment, Inc.
8.8.1 Company Overview
8.8.2 Financial Analysis
8.8.3 Strategic Positioning
8.8.4 Info Graphic Analysis
8.9 Takung Art Co., Ltd
8.8.1 Company Overview
8.8.2 Financial Analysis
8.8.3 Strategic Positioning
8.8.4 Info Graphic Analysis
8.10 Funko
8.10.1 Company Overview
8.10.2 Financial Analysis
8.10.3 Strategic Positioning
8.10.4 Info Graphic Analysis
8.11 Other Companies
8.11.1 Company Overview
8.11.2 Financial Analysis
8.11.3 Strategic Positioning
8.11.4 Info Graphic Analysis
The Global Non-Fungible Tokens Market has been studied from the year 2019 till 2026. However, the CAGR provided in the report is from the year 2021 to 2026. The research methodology involved three stages: Desk research, Primary research, and Analysis & Output from the entire research process.

The desk research involved a robust background study which meant referring to paid and unpaid databases to understand the market dynamics; mapping contracts from press releases; identifying the key players in the market, studying their product portfolio, competition level, annual reports/SEC filings & investor presentations; and learning the demand and supply-side analysis for the Non-Fungible Tokens Market.

The primary research activity included telephonic conversations with more than 50 tier 1 industry consultants, distributors, and end-use product manufacturers.

Finally, based on the above thorough research process, an in-depth analysis was carried out considering the following aspects: market attractiveness, current & future market trends, market share analysis, SWOT analysis of the company and customer analytics.

Frequently Asked Questions

This FREE sample includes market data points, ranging from trend analyses to market estimates & forecasts. See for yourself.
Or view our licence options:
Tailor made solutions just for you
80% of our clients seek made-to-order reports. How do you want us to tailor yours?
OUR CLIENTS


