This report was recently updated on August 20 2025 with the latest and most recent
market numbers
Global Nutraceutical Products Market Size, Trends & Analysis - Forecasts to 2030 By Type (Food [Snacks, Confectionery Products, Bakery Products, Dairy Products, and Infant Nutrition Products], Beverages [Health Drinks, Energy Drinks, and Juices], and Dietary Supplements [Tablets, Liquid, Powder, and Others]), By Distribution Channel (Conventional Stores, Specialty Stores, and Drugstores & Pharmacies), By Source (Proteins & Amino Acids, Probiotics, Phytochemicals & Plant Extracts, Fibers & Specialty Carbohydrates, Omega-3 Fatty Acids, Vitamins, Prebiotics, Carotenoids, Minerals, and Others), and By Region (North America, Asia Pacific, Central and South America, Europe, and Middle East and Africa), Competitive Landscape, Company Market Share Analysis, and End User Analysis
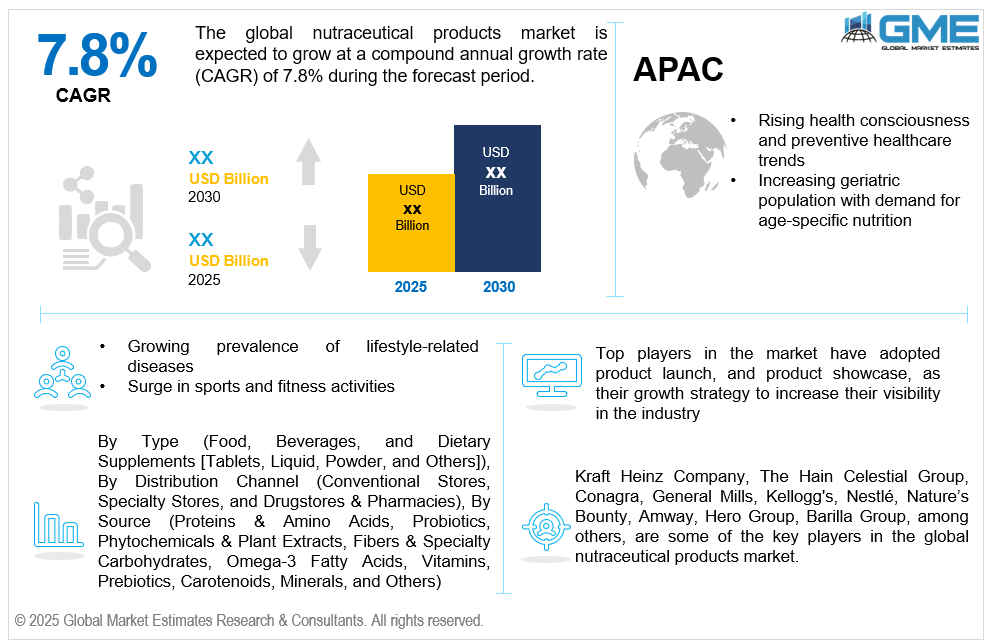
The global nutraceutical products market is estimated to exhibit a CAGR of 7.8% from 2025 to 2030.
The primary factors propelling the market's growth are rising health consciousness and preventive healthcare trends and the increasing geriatric population with demand for age-specific nutrition. Customers are becoming more conscious of the long-term advantages of preserving health via nutrition and food as opposed to depending exclusively on medications for therapy. The increasing prevalence of chronic lifestyle-related illnesses like diabetes, obesity, heart disease, and digestive issues is what is causing this change. As a result, individuals are proactively incorporating nutraceuticals—such as functional foods, dietary supplements, and fortified beverages—into their daily routines to boost immunity, enhance metabolism, and support overall well-being. This trend was further exacerbated by the COVID-19 pandemic, underscoring the significance of immunity and overall health. Additionally, growing access to health information via digital media and wellness influencers has fueled consumer demand for clean-label, organic, and scientifically backed products. This heightened awareness and preference for proactive health management continue to drive innovation and growth in the nutraceutical sector globally.
The growing prevalence of lifestyle-related diseases such as diabetes and obesity, along with the surge in sports and fitness activities, is expected to support the market growth. Chronic illnesses are on the rise globally as a result of poor eating habits, sedentary lifestyles, and elevated stress levels. Nutraceuticals are therefore becoming more and more popular among consumers as a supplemental and preventative method of managing their health. Health-conscious consumers are becoming more interested in products like sugar-free supplements, weight-loss beverages, heart-healthy functional foods, and diabetic-friendly snacks. Nutraceuticals offer targeted health benefits, including blood sugar regulation, cholesterol control, and weight loss support, making them an appealing option for those seeking non-pharmaceutical interventions. Furthermore, healthcare professionals are increasingly recommending nutraceuticals as part of integrated disease management plans. This shift toward proactive health solutions, combined with rising healthcare costs and the limitations of conventional medicine, is propelling demand for nutraceuticals, thereby driving market growth across both developed and emerging economies.
Expanding demand for plant-based and clean-label dietary supplements, coupled with the favorable regulatory support and government initiatives, propels market growth. Consumers are becoming more ingredient-conscious and seeking transparency in what they consume, prompting a shift toward supplements derived from natural, sustainable, and plant-based sources. Due to their perceived safety and health advantages, clean-label products—those devoid of artificial additives, preservatives, genetically modified organisms, and synthetic chemicals—are becoming more and more popular. This pattern is consistent with the growing acceptance of vegetarianism, veganism, and flexitarian diets, particularly among younger, ecologically conscious populations. Plant-based nutraceuticals, such as herbal extracts, superfoods, and botanical blends, are gaining traction for supporting immunity, digestion, and energy without the side effects associated with synthetic alternatives. Moreover, regulatory bodies and health organizations are encouraging the use of naturally sourced ingredients, further reinforcing consumer confidence.
The surge in online health product sales provides an opportunity to reach wider audiences through e-commerce platforms and digital health apps, offering personalized recommendations and subscription-based delivery models. Additionally, consumers are demanding clarity about ingredients and sourcing, creating an opportunity for nutraceutical companies to build trust by emphasizing clean-label formulations, sustainability, and third-party certifications. However, limited insurance or reimbursement coverage and competition from pharmaceutical alternatives impede market growth.
The food segment is expected to hold the largest share of the market over the forecast period. Nutraceutical food products such as fortified cereals, dairy, and snacks seamlessly integrate into daily diets, making them more acceptable to a wider population compared to capsules or powders. This everyday usability significantly drives volume and consistent consumption globally.
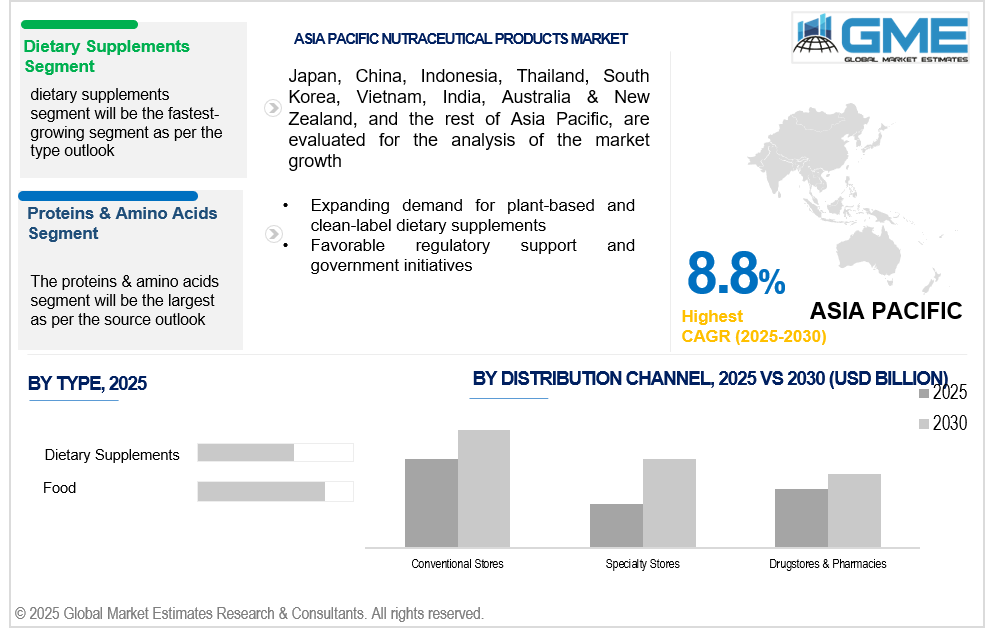
The dietary supplements segment is expected to be the fastest-growing segment in the market from 2025 to 2030. Supplements in pill, capsule, gummy, and powder form offer consistent dosages and easy tracking of nutrient intake. This precision appeals to individuals managing chronic conditions or fitness goals, contributing to growing demand and faster segmental growth.
The conventional stores segment is expected to hold the largest share of the market over the forecast period. Conventional stores frequently run promotional campaigns, discounts, and loyalty programs that attract price-sensitive buyers. These offers not only encourage higher foot traffic but also drive larger volumes of nutraceutical product sales compared to other distribution channels.
The specialty stores segment is anticipated to be the fastest-growing segment in the market from 2025 to 2030. Specialty stores typically carry high-quality, niche, and innovative nutraceutical brands not always found in supermarkets. Their carefully curated inventory caters to discerning consumers looking for clean-label, organic, or scientifically backed products, helping differentiate and grow this segment quickly.
The proteins & amino acids segment is expected to hold the largest share of the market over the forecast period. Proteins and amino acids are essential for all age groups, from children requiring protein for growth to seniors benefiting from its role in muscle mass preservation and healthy aging. Their widespread applicability ensures their dominance in the nutraceutical market.
The probiotics segment is anticipated to be the fastest-growing segment in the market from 2025 to 2030. Probiotics are no longer limited to supplements but are increasingly incorporated into food and beverages like yogurt, kefir, juices, and even snack bars. This product diversification broadens the appeal of probiotics, driving market expansion and accelerating growth.
North America is expected to be the largest region in the global market. North America is home to cutting-edge research and development in nutraceuticals. The innovation in supplement formulations, delivery methods, and health benefits, driven by high investment in R&D, ensures that the region maintains its leadership in the global nutraceutical market.
Asia Pacific is anticipated to witness rapid growth during the forecast period. Consumers in Asia Pacific are becoming more aware of the health benefits of plant-based and organic products. This growing preference for clean-label, sustainable, and natural solutions drives the demand for plant-based nutraceuticals, boosting the region's market growth.
Kraft Heinz Company, The Hain Celestial Group, Conagra, General Mills, Kellogg's, Nestlé, Nature’s Bounty, Amway, Hero Group, Barilla Group, among others, are some of the key players in the global nutraceutical products market.
Please note: This is not an exhaustive list of companies profiled in the report.
In November 2024, Danone introduced ST?K Cold Brew Energy as a calculated move to take advantage of the growing demand for functional beverages. This product line expansion capitalizes on the success of their current ST?K Cold Brew brand, positioning it to attract customers looking for both increased performance and caffeine.
In October 2024, TopGum Industries Ltd. introduced gummy dietary supplements based on liquid honey, which include a higher concentration of honey in liquid form than is typically found in powdered form. There are five functional gummies in the product range that are intended to address different health issues
REPORT CONTENT
1 STRATEGIC INSIGHTS ON NEW REVENUE POCKETS
1.1 Strategic Opportunity & Attractiveness Analysis
1.1.1 Hot Revenue Pockets
1.1.2 Market Attractiveness Score
1.1.3 Revenue Impacting Opportunity
1.1.4 High Growing Region/Country
1.1.5 Competitor Analysis
1.1.6 Consumer Analysis
1.2 Global Market Estimates' View
1.3 Strategic Insights across Business Functions
1.3.1 For Chief Executive Officers
1.3.2 For Chief Marketing Officers
1.3.3 For Chief Strategy Officers
1.4 Evaluate the Potential of your Existing Business Lines vs. New Lines to Enter Into
2.1 Technological Adoption Rate
2.2 Current Trend Impact Analysis
2.3 Future Trend Impact Analysis
3 GLOBAL OPTICAL COLLIMATOR MARKET OUTLOOK
3.1.2 Adjacent Market Opportunities
3.1.3 Ancillary Market Opportunities
3.2.1 Market Drivers: Impact Analysis
3.2.2 Market Restraints: Impact Analysis
3.2.3 Market Opportunities: Impact Analysis
3.2.4 Market Challenges: Impact Analysis
3.3.1 Porter’s Five Forces Analysis
3.3.1.1 Threat of New Entrants
3.3.1.2 Threat of New Substitutes
3.3.1.3 Bargaining Power of Suppliers
3.3.1.4 Bargaining Power of Buyers
3.3.1.5 Intensity of Competitive Rivalry
3.3.2 SWOT Analysis; By Factor (Political & Legal, Economic, and Technological)
4 GLOBAL OPTICAL COLLIMATOR MARKET, BY TYPE
4.2 Optical Collimator Market: Type Scope Key Takeaways
4.3 Revenue Growth Analysis, 2023 & 2029
4.5 Beverages [Health Drinks, Energy Drinks, and Juices]
4.6 Dietary Supplements [Tablets, Liquid, Powder, and Others]
5 GLOBAL OPTICAL COLLIMATOR MARKET, BY SOURCE
5.2 Optical Collimator Market: Source Scope Key Takeaways
5.3 Revenue Growth Analysis, 2023 & 2029
5.4.1 Proteins & Amino Acids Market Estimates and Forecast, 2021-2029 (USD Million)
5.5.1 Probiotics Market Estimates and Forecast, 2021-2029 (USD Million)
5.6 Phytochemicals & Plant Extracts
5.6.1 Phytochemicals & Plant Extracts Market Estimates and Forecast, 2021-2029 (USD Million)
5.7 Fibers & Specialty Carbohydrates
5.7.1 Fibers & Specialty Carbohydrates Market Estimates and Forecast, 2021-2029 (USD Million)
5.8.1 Omega-3 Fatty Acids Market Estimates and Forecast, 2021-2029 (USD Million)
5.9.1 Vitamins Market Estimates and Forecast, 2021-2029 (USD Million)
5.10.1 Prebiotics Market Estimates and Forecast, 2021-2029 (USD Million)
5.11.1 Carotenoids Market Estimates and Forecast, 2021-2029 (USD Million)
5.12.1 Minerals Market Estimates and Forecast, 2021-2029 (USD Million)
5.13.1 Others Market Estimates and Forecast, 2021-2029 (USD Million)
6 GLOBAL OPTICAL COLLIMATOR MARKET, BY DISTRIBUTION CHANNEL
6.2 Optical Collimator Market: Distribution Channel Scope Key Takeaways
6.3 Revenue Growth Analysis, 2023 & 2029
6.4.1 Conventional Stores Market Estimates and Forecast, 2021-2029 (USD Million)
6.5.1 Specialty Stores Market Estimates and Forecast, 2021-2029 (USD Million)
6.6.1 Drugstores & Pharmacies Market Estimates and Forecast, 2021-2029 (USD Million)
7 GLOBAL OPTICAL COLLIMATOR MARKET, BY REGION
7.2 North America Optical Collimator Market Estimates and Forecast, 2021-2029 (USD Million)
7.2.4.1 U.S. Optical Collimator Market Estimates and Forecast, 2021-2029 (USD Million)
7.2.4.1.3 By Distribution Channel
7.2.4.2 Canada Optical Collimator Market Estimates and Forecast, 2021-2029 (USD Million)
7.2.4.2.3 By Distribution Channel
7.2.4.3 Mexico Optical Collimator Market Estimates and Forecast, 2021-2029 (USD Million)
7.2.4.3.3 By Distribution Channel
7.3 Europe Optical Collimator Market Estimates and Forecast, 2021-2029 (USD Million)
7.3.4.1 Germany Optical Collimator Market Estimates and Forecast, 2021-2029 (USD Million)
7.3.4.1.3 By Distribution Channel
7.3.4.2 U.K. Optical Collimator Market Estimates and Forecast, 2021-2029 (USD Million)
7.3.4.2.3 By Distribution Channel
7.3.4.3 France Optical Collimator Market Estimates and Forecast, 2021-2029 (USD Million)
7.3.4.3.3 By Distribution Channel
7.3.4.4 Italy Optical Collimator Market Estimates and Forecast, 2021-2029 (USD Million)
7.2.4.4.3 By Distribution Channel
7.3.4.5 Spain Optical Collimator Market Estimates and Forecast, 2021-2029 (USD Million)
7.2.4.5.3 By Distribution Channel
7.3.4.6 Netherlands Optical Collimator Market Estimates and Forecast, 2021-2029 (USD Million)
7.2.4.6.3 By Distribution Channel
7.3.4.7 Rest of Europe Optical Collimator Market Estimates and Forecast, 2021-2029 (USD Million)
7.2.4.7.3 By Distribution Channel
7.4 Asia Pacific Optical Collimator Market Estimates and Forecast, 2021-2029 (USD Million)
7.4.4.1 China Optical Collimator Market Estimates and Forecast, 2021-2029 (USD Million)
7.4.4.1.3 By Distribution Channel
7.4.4.2 Japan Optical Collimator Market Estimates and Forecast, 2021-2029 (USD Million)
7.4.4.2.3 By Distribution Channel
7.4.4.3 India Optical Collimator Market Estimates and Forecast, 2021-2029 (USD Million)
7.4.4.3.3 By Distribution Channel
7.4.4.4 South Korea Optical Collimator Market Estimates and Forecast, 2021-2029 (USD Million)
7.4.4.4.3 By Distribution Channel
7.4.4.5 Singapore Optical Collimator Market Estimates and Forecast, 2021-2029 (USD Million)
7.4.4.5.3 By Distribution Channel
7.4.4.6 Malaysia Optical Collimator Market Estimates and Forecast, 2021-2029 (USD Million)
7.4.4.6.3 By Distribution Channel
7.4.4.7 Thailand Optical Collimator Market Estimates and Forecast, 2021-2029 (USD Million)
7.4.4.7.3 By Distribution Channel
7.4.4.8 Indonesia Optical Collimator Market Estimates and Forecast, 2021-2029 (USD Million)
7.4.4.8.3 By Distribution Channel
7.4.4.9 Vietnam Optical Collimator Market Estimates and Forecast, 2021-2029 (USD Million)
7.4.4.9.3 By Distribution Channel
7.4.4.10 Taiwan Optical Collimator Market Estimates and Forecast, 2021-2029 (USD Million)
7.4.4.10.3 By Distribution Channel
7.4.4.11.3 By Distribution Channel
7.5 Middle East and Africa Optical Collimator Market Estimates and Forecast, 2021-2029 (USD Million)
7.5.4.1 Saudi Arabia Optical Collimator Market Estimates and Forecast, 2021-2029 (USD Million)
7.5.4.1.3 By Distribution Channel
7.5.4.2 U.A.E. Optical Collimator Market Estimates and Forecast, 2021-2029 (USD Million)
7.5.4.2.3 By Distribution Channel
7.5.4.3 Israel Optical Collimator Market Estimates and Forecast, 2021-2029 (USD Million)
7.5.4.3.3 By Distribution Channel
7.5.4.4 South Africa Optical Collimator Market Estimates and Forecast, 2021-2029 (USD Million)
7.5.4.4.3 By Distribution Channel
7.5.4.5.2 By Distribution Channel
7.6.4.1 Brazil Optical Collimator Market Estimates and Forecast, 2021-2029 (USD Million)
7.6.4.1.3 By Distribution Channel
7.6.4.2 Argentina Optical Collimator Market Estimates and Forecast, 2021-2029 (USD Million)
7.6.4.2.3 By Distribution Channel
7.6.4.3 Chile Optical Collimator Market Estimates and Forecast, 2021-2029 (USD Million)
7.6.4.3.3 By Distribution Channel
7.6.4.4.3 By Distribution Channel
8.1 Company Market Share Analysis
8.2 Four Quadrant Positioning Matrix
8.4.1.1 Business Description & Financial Analysis
8.4.1.3 Products & Services Offered
8.4.1.4 Strategic Alliances between Business Partners
8.4.2 The Hain Celestial Group
8.4.2.1 Business Description & Financial Analysis
8.4.2.3 Products & Services Offered
8.4.2.4 Strategic Alliances between Business Partners
8.4.3.1 Business Description & Financial Analysis
8.4.3.3 Products & Services Offered
8.4.3.4 Strategic Alliances between Business Partners
8.4.4.1 Business Description & Financial Analysis
8.4.4.3 Products & Services Offered
8.4.4.4 Strategic Alliances between Business Partners
8.4.5.1 Business Description & Financial Analysis
8.4.5.3 Products & Services Offered
8.4.5.4 Strategic Alliances between Business Partners
8.4.6.1 Business Description & Financial Analysis
8.4.6.3 Products & Services Offered
8.4.6.4 Strategic Alliances between Business Partners
8.4.7.1 Business Description & Financial Analysis
8.4.7.3 Products & Services Offered
8.4.8.4 Strategic Alliances between Business Partners
8.4.8.1 Business Description & Financial Analysis
8.4.8.3 Products & Services Offered
8.4.8.4 Strategic Alliances between Business Partners
8.4.9.1 Business Description & Financial Analysis
8.4.9.3 Products & Services Offered
8.4.9.4 Strategic Alliances between Business Partners
8.4.10.1 Business Description & Financial Analysis
8.4.10.3 Products & Services Offered
8.4.10.4 Strategic Alliances between Business Partners
8.4.11.1 Business Description & Financial Analysis
8.4.11.3 Products & Services Offered
8.4.11.4 Strategic Alliances between Business Partners
9.1.2 Market Scope & Segmentation
9.2.1.2 GMEs Internal Data Repository
9.2.1.3 Secondary Resources & Third Party Perspectives
9.2.1.4 Company Information Sources
9.2.2.1 Various Types of Respondents for Primary Interviews
9.2.2.2 Number of Interviews Conducted throughout the Research Process
9.2.2.4 Discussion Guide for Primary Participants
9.2.3.1 Expert Panels Across 30+ Industry
9.2.4.1 Paid Local Experts Across 30+ Industry Across each Region
9.3.1.1 Macro-Economic Indicators Considered
9.3.1.2 Micro-Economic Indicators Considered
9.3.2.1 Company Share Analysis Approach
9.3.2.2 Estimation of Potential Type Sales
9.4.2 Time Series, Cross Sectional & Panel Data Analysis
9.5.1 Inhouse AI Based Real Time Analytics Tool
9.5.2 Output From Desk & Primary Research
9.6 Research Assumptions & Limitations
LIST OF TABLES
LIST OF FIGURES
1 Global Optical Collimator Market Overview
2 Global Optical Collimator Market Value From 2021-2029 (USD Million)
3 Global Optical Collimator Market Share, By Type (2023)
4 Global Optical Collimator Market Share, By Source (2023)
5 Global Optical Collimator Market Share, By Distribution Channel (2023)
6 Global Optical Collimator Market, By Region (Asia Pacific Market)
7 Technological Trends In Global Optical Collimator Market
8 Four Quadrant Competitor Positioning Matrix
9 Impact Of Macro & Micro Indicators On The Market
10 Impact Of Key Drivers On The Global Optical Collimator Market
11 Impact Of Challenges On The Global Optical Collimator Market
12 Porter’s Five Forces Analysis
13 Global Optical Collimator Market: By Type Scope Key Takeaways
14 Global Optical Collimator Market, By Type Segment: Revenue Growth Analysis
15 Food [Snacks, Confectionery Products, Bakery Products, Dairy Products, and Infant Nutrition Products] Market, By Region, 2021-2029 (USD Million)
16 Beverages [Health Drinks, Energy Drinks, and Juices] Market, By Region, 2021-2029 (USD Million)
17 Dietary Supplements [Tablets, Liquid, Powder, and Others] Market, By Region, 2021-2029 (USD Million)
18 Global Optical Collimator Market: By Source Scope Key Takeaways
19 Global Optical Collimator Market, By Source Segment: Revenue Growth Analysis
20 Proteins & Amino Acids Market, By Region, 2021-2029 (USD Million)
21 Probiotics Market, By Region, 2021-2029 (USD Million)
22 Phytochemicals & Plant Extracts Market, By Region, 2021-2029 (USD Million)
23 Fibers & Specialty Carbohydrates Market, By Region, 2021-2029 (USD Million)
24 Omega-3 Fatty Acids Market, By Region, 2021-2029 (USD Million)
25 Vitamins Market, By Region, 2021-2029 (USD Million)
26 Prebiotics Market, By Region, 2021-2029 (USD Million)
27 Carotenoids Market, By Region, 2021-2029 (USD Million)
28 Minerals Market, By Region, 2021-2029 (USD Million)
29 Others Market, By Region, 2021-2029 (USD Million)
30 Global Optical Collimator Market: By Distribution Channel Scope Key Takeaways
31 Global Optical Collimator Market, By Distribution Channel Segment: Revenue Growth Analysis
32 Conventional Stores Market, By Region, 2021-2029 (USD Million)
33 Specialty Stores Market, By Region, 2021-2029 (USD Million)
34 Drugstores & Pharmacies Market, By Region, 2021-2029 (USD Million)
35 Spectroscopy Market, By Region, 2021-2029 (USD Million)
36 Regional Segment: Revenue Growth Analysis
37 Global Optical Collimator Market: Regional Analysis
38 North America Optical Collimator Market Overview
39 North America Optical Collimator Market, By Type
40 North America Optical Collimator Market, By Source
41 North America Optical Collimator Market, By Distribution Channel
42 North America Optical Collimator Market, By Country
43 U.S. Optical Collimator Market, By Type
44 U.S. Optical Collimator Market, By Source
45 U.S. Optical Collimator Market, By Distribution Channel
46 Canada Optical Collimator Market, By Type
47 Canada Optical Collimator Market, By Source
48 Canada Optical Collimator Market, By Distribution Channel
49 Mexico Optical Collimator Market, By Type
50 Mexico Optical Collimator Market, By Source
51 Mexico Optical Collimator Market, By Distribution Channel
52 Four Quadrant Positioning Matrix
53 Company Market Share Analysis
54 Kraft Heinz Company: Company Snapshot
55 Kraft Heinz Company: SWOT Analysis
56 Kraft Heinz Company: Geographic Presence
57 The Hain Celestial Group: Company Snapshot
58 The Hain Celestial Group: SWOT Analysis
59 The Hain Celestial Group: Geographic Presence
60 Conagra: Company Snapshot
61 Conagra: SWOT Analysis
62 Conagra: Geographic Presence
63 General Mills: Company Snapshot
64 General Mills: Swot Analysis
65 General Mills: Geographic Presence
66 Kellogg’s: Company Snapshot
67 Kellogg’s: SWOT Analysis
68 Kellogg’s: Geographic Presence
69 NESTLÉ: Company Snapshot
70 NESTLÉ: SWOT Analysis
71 NESTLÉ: Geographic Presence
72 Nature’s Bounty : Company Snapshot
73 Nature’s Bounty : SWOT Analysis
74 Nature’s Bounty : Geographic Presence
75 Amway: Company Snapshot
76 Amway: SWOT Analysis
77 Amway: Geographic Presence
78 Hero Group, Inc.: Company Snapshot
79 Hero Group, Inc.: SWOT Analysis
80 Hero Group, Inc.: Geographic Presence
81 Barilla Group: Company Snapshot
82 Barilla Group: SWOT Analysis
83 Barilla Group: Geographic Presence
84 Other Companies: Company Snapshot
85 Other Companies: SWOT Analysis
86 Other Companies: Geographic Presence
The Global Nutraceutical Products Market has been studied from the year 2019 till 2030. However, the CAGR provided in the report is from the year 2025 to 2030. The research methodology involved three stages: Desk research, Primary research, and Analysis & Output from the entire research process.

The desk research involved a robust background study which meant referring to paid and unpaid databases to understand the market dynamics; mapping contracts from press releases; identifying the key players in the market, studying their product portfolio, competition level, annual reports/SEC filings & investor presentations; and learning the demand and supply-side analysis for the Nutraceutical Products Market.

The primary research activity included telephonic conversations with more than 50 tier 1 industry consultants, distributors, and end-use product manufacturers.

Finally, based on the above thorough research process, an in-depth analysis was carried out considering the following aspects: market attractiveness, current & future market trends, market share analysis, SWOT analysis of the company and customer analytics.

Frequently Asked Questions
![Global Nutraceutical Products Market Size, Trends & Analysis - Forecasts to 2030 By Type (Food [Snacks, Confectionery Products, Bakery Products, Dairy Products, and Infant Nutrition Products], Beverages [Health Drinks, Energy Drinks, and Juices], and Dietary Supplements [Tablets, Liquid, Powder, and Others]), By Distribution Channel (Conventional Stores, Specialty Stores, and Drugstores & Pharmacies), By Source (Proteins & Amino Acids, Probiotics, Phytochemicals & Plant Extracts, Fibers & Specialty Carbohydrates, Omega-3 Fatty Acids, Vitamins, Prebiotics, Carotenoids, Minerals, and Others), and By Region (North America, Asia Pacific, Central and South America, Europe, and Middle East and Africa), Competitive Landscape, Company Market Share Analysis, and End User Analysis](https://www.globalmarketestimates.com/images/cat/Food & Beverages.png)
This FREE sample includes market data points, ranging from trend analyses to market estimates & forecasts. See for yourself.
Or view our licence options:
Tailor made solutions just for you
80% of our clients seek made-to-order reports. How do you want us to tailor yours?
OUR CLIENTS


