This report was recently updated on August 11 2025 with the latest and most recent
market numbers
Global Oxygenated Solvents Market Size, Trends, and Analysis - Forecasts to 2026 By Source (Conventional Solvent, Bio & Green Solvent), By Type (Alcohols, Esters, Glycols, Glycol Ethers, Ketones, Bio & Green Solvents, Others), By Application (Paints & Coatings, Pharmaceuticals, Personal Care, Crop Protection, Lubricants, Others), Region (North America, Asia Pacific, CSA, Europe, and the Middle East and Africa), Company Market Share Analysis, and Competitor Analysis
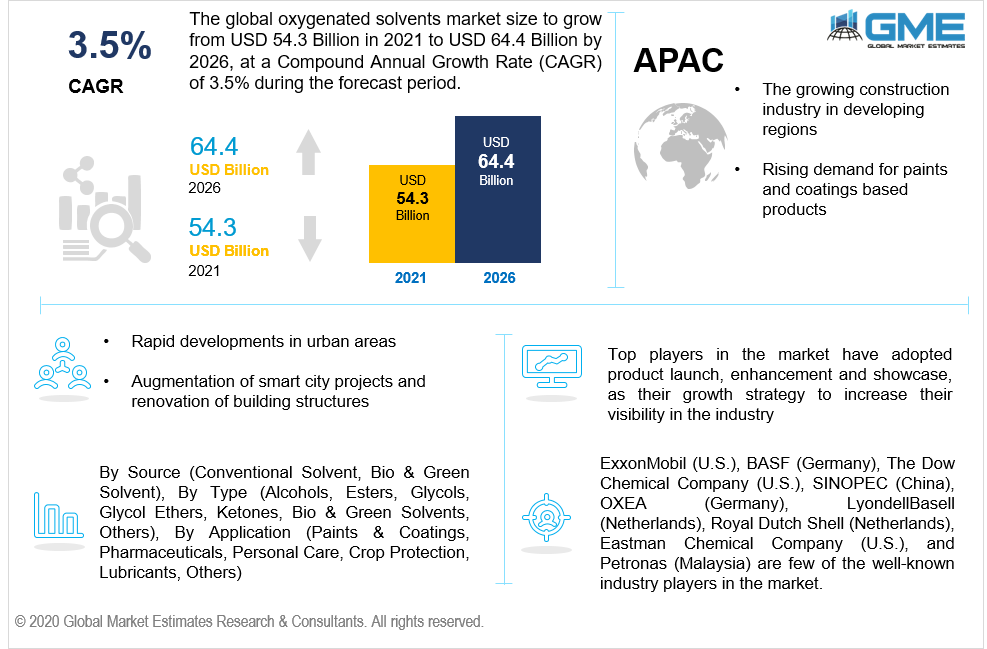
The global oxygenated solvents market will grow from USD 54.3 billion in 2021 to USD 64.4 billion by 2026 at a CAGR value of 3.5% from 2021 to 2026.
The growing construction industry in developing regions, rising demand for paints and coatings based products, rapid developments in urban areas, augmentation of smart city projects and renovation of building structures are some of the factors responsible for the growth of the oxygenated solvents market from 2021 to 2026.
Manufacturers of oxygenated solvents are working on the development of eco-friendly solvents which are also cost effective. These oxygenated solvents are non-flammable, non-VOC and also have low toxicity. Eco-friendly oxygenated solvents are an excellent alternative to the traditional solvents, such as N-Methylpyrrolidone. These green alternative solvents can be utilized in various applications, which include paint stripping, cleaning, degreasing, etc.
The COVID-19 pandemic has had a negative effect on the chemical industry owing to disruption in raw material supply, shutting down of manufacturing units, low consumption rate for products and reduced production volume of ready-goods. However, with the ease in lockdown norms, the market is expected to pick up the pace and grow exponentially from 2021 to 2026.
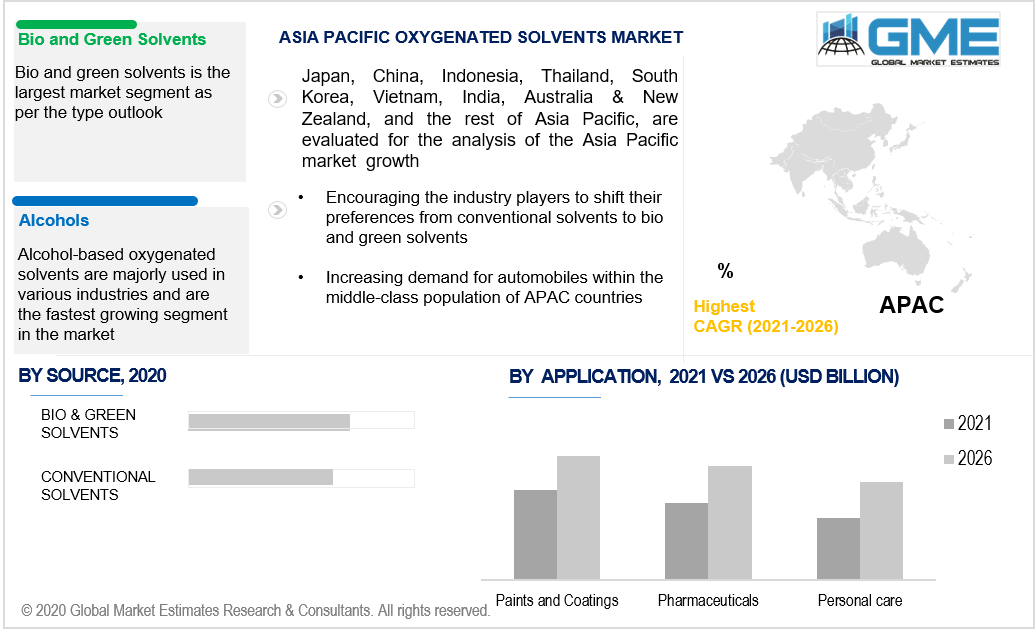
Based on the source, the market is segmented into conventional solvent, and bio & green solvent. Globally, Bio and green solvents have substituted the usage of conventional solvents in the market and hence are analyzed to be the fastest growing segment.
The responsiveness of the consumers towards using eco-friendly and safe products has replaced the demand for conventional solvents in the manufacturing industries. These conventional solvents comparatively have more VOC levels, which can be eliminated by using bio and green solvents. The purity level of bio and green solvents is higher than the conventional solvents as they are derived from renewable raw materials.
Based on the type, the market is segmented into alcohols, esters, glycols, glycol ethers, ketones, bio & green solvents, and others. Oxygenated solvents are available for industry use in various types as per the product requirement and hence alcohol based segment is the fastest growing segment in the market.
Alcohol-based oxygenated solvents are majorly used in various industries. These type of solvents are highly versatile with great purity levels and solvency rates. They are majorly used in paint, ink, and cosmetics. These are also considerably used in cleaning products and pharmaceuticals to some extent.
Based on the application, the market is segmented into paints & coatings, pharmaceuticals, personal care, crop protection, lubricants, and others. Considering the favorable properties of oxygenated solvents, many industry players use oxygenated solvents for various applicational purposes. Oxygenated solvents are highly utilized in the paint and coating industry and hence, this segment is the fastest growing segment in the market.
Alcohols, Esters, Glycols, Glycol Ethers are the four majorly used types of oxygenated solvents in the paint and coating industry owing to their properties of providing appropriate viscosity to the paint, high solvency, and easy varnish application.
Based on region, the market can be segmented into various regions such as North America, Europe, Central and South America, Middle East and Africa, and Asia Pacific regions.
The maximum demand for oxygenated solvents is from the Asia Pacific region and hence, this segment is analyzed to be the largest and fastest growing segment in the market. This region accounts to have the majority of oxygenated solvent manufacturers. Countries like China, Japan, and India have the largest manufacturers of oxygenated solvents compared to the rest of the world. Japan being one of the biggest markets for the cosmetics industry has tremendous use of oxygenated solvents as well.
ExxonMobil (U.S.), BASF (Germany), The Dow Chemical Company (U.S.), SINOPEC (China), OXEA (Germany), LyondellBasell (Netherlands), Royal Dutch Shell (Netherlands), Eastman Chemical Company (U.S.), and Petronas (Malaysia) are few of the well-known industry players in the market.
Please note: This is not an exhaustive list of companies profiled in the report.
Chapter 1 Methodology
1.1 Market Scope & Definitions
1.2 Estimates & Forecast Calculation
1.3 Historical Data Overview and Validation
1.4 Data Sources
1.4.1 Secondary
1.4.2 Primary
Chapter 2 Report Outlook
2.1 Oxygenated Solvents Industry Overview, 2019-2026
2.1.1 Industry Overview
2.1.2 Source Overview
2.1.3 Type Overview
2.1.4 Application Overview
2.1.6 Regional Overview
Chapter 3 Oxygenated Solvents Market Trends
3.1 Market Segmentation
3.2 Industry Background, 2019-2026
3.3 Market Key Trends
3.3.1 Positive Trends
3.3.1.1 The growing construction industry in developing regions
3.3.2 Industry Challenges
3.3.2.1 High cost associated with raw material
3.4 Prospective Growth Scenario
3.4.1 Source Growth Scenario
3.4.2 Type Growth Scenario
3.4.3 Application Growth Scenario
3.5 COVID-19 Influence over Industry Growth
3.6 Porter’s Analysis
3.7 PESTEL Analysis
3.8 Value Chain & Supply Chain Analysis
3.9 Regulatory Framework
3.9.1 North America
3.9.2 Europe
3.9.3 APAC
3.9.4 LATAM
3.9.5 MEA
3.10 Application Overview
3.11 Market Share Analysis, 2020
3.11.1 Company Positioning Overview, 2020
Chapter 4 Oxygenated Solvents Market, By Source
4.1 Source Outlook
4.2 Conventional Solvent
4.2.1 Market Size, By Region, 2019-2026 (USD Billion)
4.3 Bio & Green Solvent
4.3.1 Market Size, By Region, 2019-2026 (USD Billion)
Chapter 5 Oxygenated Solvents Market, By Type
5.1 Type Outlook
5.2 Alcohols
5.2.1 Market Size, By Region, 2019-2026 (USD Billion)
5.3 Esters
5.3.1 Market Size, By Region, 2019-2026 (USD Billion)
5.4 Glycols
5.4.1 Market Size, By Region, 2019-2026 (USD Billion)
5.5 Glycol Ethers
5.5.1 Market Size, By Region, 2019-2026 (USD Billion)
5.6 Ketones
5.6.1 Market Size, By Region, 2019-2026 (USD Billion)
5.7 Bio & Green Solvents
5.7.1 Market Size, By Region, 2019-2026 (USD Billion)
5.8 Others
5.8.1 Market Size, By Region, 2019-2026 (USD Billion)
Chapter 6 Oxygenated Solvents Market, By Application
6.1 Paints & Coatings
6.1.1 Market Size, By Region, 2019-2026 (USD Billion)
6.2 Pharmaceuticals
6.2.1 Market Size, By Region, 2019-2026 (USD Billion)
6.2 Personal Care
6.2.1 Market Size, By Region, 2019-2026 (USD Billion)
6.2 Crop Protection
6.2.1 Market Size, By Region, 2019-2026 (USD Billion)
6.2 Lubricants
6.2.1 Market Size, By Region, 2019-2026 (USD Billion)
6.2 Others
6.2.1 Market Size, By Region, 2019-2026 (USD Billion)
Chapter 7 Oxygenated Solvents Market, By Region
7.1 Regional outlook
7.2 North America
7.2.1 Market Size, By Country 2019-2026 (USD Billion)
7.2.2 Market Size, By Source, 2019-2026 (USD Billion)
7.2.3 Market Size, By Type, 2019-2026 (USD Billion)
7.2.4 Market Size, By Application, 2019-2026 (USD Billion)
7.2.6 U.S.
7.2.6.1 Market Size, By Source, 2019-2026 (USD Billion)
7.2.4.2 Market Size, By Type, 2019-2026 (USD Billion)
7.2.4.3 Market Size, By Application, 2019-2026 (USD Billion)
7.2.7 Canada
7.2.7.1 Market Size, By Source, 2019-2026 (USD Billion)
7.2.7.2 Market Size, By Type, 2019-2026 (USD Billion)
7.2.7.3 Market Size, By Application, 2019-2026 (USD Billion)
7.3 Europe
7.3.1 Market Size, By Country 2019-2026 (USD Billion)
7.3.2 Market Size, By Source, 2019-2026 (USD Billion)
7.3.3 Market Size, By Type, 2019-2026 (USD Billion)
7.3.4 Market Size, By Application, 2019-2026 (USD Billion)
7.3.6 Germany
7.3.6.1 Market Size, By Source, 2019-2026 (USD Billion)
7.3.6.2 Market Size, By Type, 2019-2026 (USD Billion)
7.3.6.3 Market Size, By Application, 2019-2026 (USD Billion)
7.3.7 UK
7.3.7.1 Market Size, By Source, 2019-2026 (USD Billion)
7.3.7.2 Market Size, By Type, 2019-2026 (USD Billion)
7.3.7.3 Market Size, By Application, 2019-2026 (USD Billion)
7.3.8 France
7.3.7.1 Market Size, By Source, 2019-2026 (USD Billion)
7.3.7.2 Market Size, By Type, 2019-2026 (USD Billion)
7.3.7.3 Market Size, By Application, 2019-2026 (USD Billion)
7.3.9 Italy
7.3.9.1 Market Size, By Source, 2019-2026 (USD Billion)
7.3.9.2 Market Size, By Type, 2019-2026 (USD Billion)
7.3.9.3 Market Size, By Application, 2019-2026 (USD Billion)
7.3.10 Spain
7.3.10.1 Market Size, By Source, 2019-2026 (USD Billion)
7.3.10.2 Market Size, By Type, 2019-2026 (USD Billion)
7.3.10.3 Market Size, By Application, 2019-2026 (USD Billion)
7.3.11 Russia
7.3.11.1 Market Size, By Source, 2019-2026 (USD Billion)
7.3.11.2 Market Size, By Type, 2019-2026 (USD Billion)
7.3.11.3 Market Size, By Application, 2019-2026 (USD Billion)
7.4 Asia Pacific
7.4.1 Market Size, By Country 2019-2026 (USD Billion)
7.4.2 Market Size, By Source, 2019-2026 (USD Billion)
7.4.3 Market Size, By Type, 2019-2026 (USD Billion)
7.4.4 Market Size, By Application, 2019-2026 (USD Billion)
7.4.6 China
7.4.6.1 Market Size, By Source, 2019-2026 (USD Billion)
7.4.6.2 Market Size, By Type, 2019-2026 (USD Billion)
7.4.6.3 Market Size, By Application, 2019-2026 (USD Billion)
7.4.7 India
7.4.7.1 Market Size, By Source, 2019-2026 (USD Billion)
7.4.7.2 Market Size, By Type, 2019-2026 (USD Billion)
7.4.7.3 Market Size, By Application, 2019-2026 (USD Billion)
7.4.8 Japan
7.4.7.1 Market Size, By Source, 2019-2026 (USD Billion)
7.4.7.2 Market Size, By Type, 2019-2026 (USD Billion)
7.4.7.3 Market Size, By Application, 2019-2026 (USD Billion)
7.4.9 Australia
7.4.9.1 Market Size, By Source, 2019-2026 (USD Billion)
7.4.9.2 Market size, By Type, 2019-2026 (USD Billion)
7.4.9.3 Market Size, By Application, 2019-2026 (USD Billion)
7.4.10 South Korea
7.4.10.1 Market Size, By Source, 2019-2026 (USD Billion)
7.4.10.2 Market Size, By Type, 2019-2026 (USD Billion)
7.4.10.3 Market Size, By Application, 2019-2026 (USD Billion)
7.5 Latin America
7.5.1 Market Size, By Country 2019-2026 (USD Billion)
7.5.2 Market Size, By Source, 2019-2026 (USD Billion)
7.5.3 Market Size, By Type, 2019-2026 (USD Billion)
7.5.4 Market Size, By Application, 2019-2026 (USD Billion)
7.5.6 Brazil
7.5.6.1 Market Size, By Source, 2019-2026 (USD Billion)
7.5.6.2 Market Size, By Type, 2019-2026 (USD Billion)
7.5.6.3 Market Size, By Application, 2019-2026 (USD Billion)
7.5.7 Mexico
7.5.7.1 Market Size, By Source, 2019-2026 (USD Billion)
7.5.7.2 Market Size, By Type, 2019-2026 (USD Billion)
7.5.7.3 Market Size, By Application, 2019-2026 (USD Billion)
7.5.8 Argentina
7.5.7.1 Market Size, By Source, 2019-2026 (USD Billion)
7.5.7.2 Market Size, By Type, 2019-2026 (USD Billion)
7.5.7.3 Market Size, By Application, 2019-2026 (USD Billion)
7.6 MEA
7.6.1 Market Size, By Country 2019-2026 (USD Billion)
7.6.2 Market Size, By Source, 2019-2026 (USD Billion)
7.6.3 Market Size, By Type, 2019-2026 (USD Billion)
7.6.4 Market Size, By Application, 2019-2026 (USD Billion)
7.6.6 Saudi Arabia
7.6.6.1 Market Size, By Source, 2019-2026 (USD Billion)
7.6.6.2 Market Size, By Type, 2019-2026 (USD Billion)
7.6.6.3 Market Size, By Application, 2019-2026 (USD Billion)
7.6.7 UAE
7.6.7.1 Market Size, By Source, 2019-2026 (USD Billion)
7.6.7.2 Market Size, By Type, 2019-2026 (USD Billion)
7.6.7.3 Market Size, By Application, 2019-2026 (USD Billion)
7.6.8 South Africa
7.6.7.1 Market Size, By Source, 2019-2026 (USD Billion)
7.6.7.2 Market Size, By Type, 2019-2026 (USD Billion)
7.6.7.3 Market Size, By Application, 2019-2026 (USD Billion)
Chapter 8 Company Landscape
8.1 Competitive Analysis, 2020
8.2 ExxonMobil (U.S.)
8.2.1 Company Overview
8.2.2 Financial Analysis
8.2.3 Strategic Positioning
8.2.4 Info Graphic Analysis
8.3 BASF (Germany)
8.3.1 Company Overview
8.3.2 Financial Analysis
8.3.3 Strategic Positioning
8.3.4 Info Graphic Analysis
8.4 The Dow Chemical Company (U.S.)
8.4.1 Company Overview
8.4.2 Financial Analysis
8.4.3 Strategic Positioning
8.4.4 Info Graphic Analysis
8.5 SINOPEC (China)
8.5.1 Company Overview
8.5.2 Financial Analysis
8.5.3 Strategic Positioning
8.5.4 Info Graphic Analysis
8.6 OXEA (Germany)
8.6.1 Company Overview
8.6.2 Financial Analysis
8.6.3 Strategic Positioning
8.6.4 Info Graphic Analysis
8.7 LyondellBasell (Netherlands)
8.7.1 Company Overview
8.7.2 Financial Analysis
8.7.3 Strategic Positioning
8.7.4 Info Graphic Analysis
8.8 Royal Dutch Shell (Netherlands)
8.8.1 Company Overview
8.8.2 Financial Analysis
8.8.3 Strategic Positioning
8.8.4 Info Graphic Analysis
8.9 Eastman Chemical Company (U.S.)
8.8.1 Company Overview
8.8.2 Financial Analysis
8.8.3 Strategic Positioning
8.8.4 Info Graphic Analysis
8.10 Petronas (Malaysia)
8.10.1 Company Overview
8.10.2 Financial Analysis
8.10.3 Strategic Positioning
8.10.4 Info Graphic Analysis
8.11 Other Companies
8.11.1 Company Overview
8.11.2 Financial Analysis
8.11.3 Strategic Positioning
8.11.4 Info Graphic Analysis
The Global Oxygenated Solvents Market has been studied from the year 2019 till 2026. However, the CAGR provided in the report is from the year 2021 to 2026. The research methodology involved three stages: Desk research, Primary research, and Analysis & Output from the entire research process.

The desk research involved a robust background study which meant referring to paid and unpaid databases to understand the market dynamics; mapping contracts from press releases; identifying the key players in the market, studying their product portfolio, competition level, annual reports/SEC filings & investor presentations; and learning the demand and supply-side analysis for the Oxygenated Solvents Market.

The primary research activity included telephonic conversations with more than 50 tier 1 industry consultants, distributors, and end-use product manufacturers.

Finally, based on the above thorough research process, an in-depth analysis was carried out considering the following aspects: market attractiveness, current & future market trends, market share analysis, SWOT analysis of the company and customer analytics.

Frequently Asked Questions

This FREE sample includes market data points, ranging from trend analyses to market estimates & forecasts. See for yourself.
Or view our licence options:
Tailor made solutions just for you
80% of our clients seek made-to-order reports. How do you want us to tailor yours?
OUR CLIENTS


