This report was recently updated on August 27 2025 with the latest and most recent
market numbers
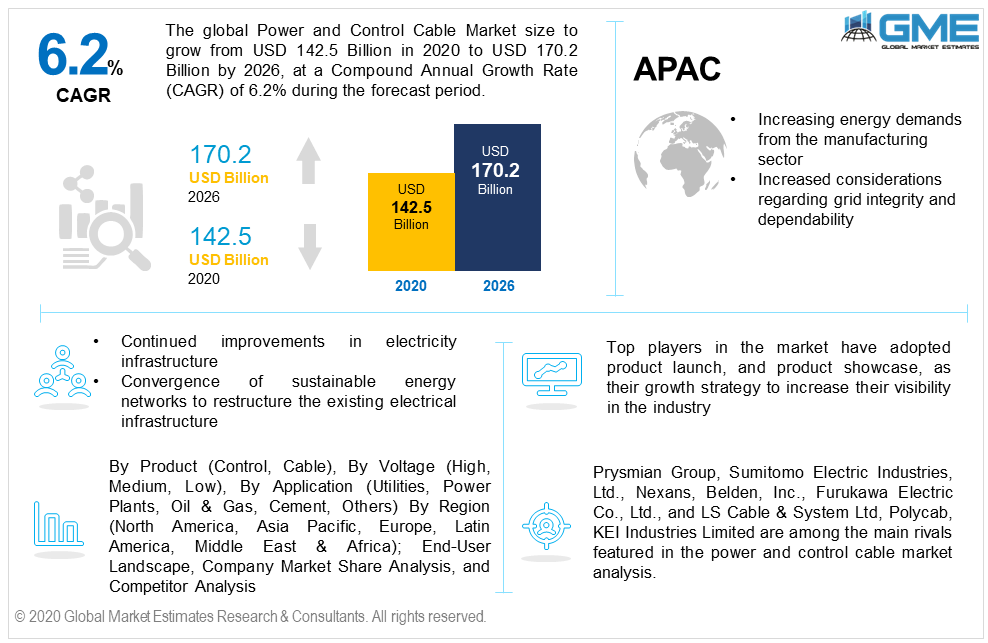
Global Power and Control Cable Market Size, Trends & Analysis - Forecasts to 2026 By Product (Control, Cable), By Voltage (High, Medium, Low), By Application (Utilities, Power Plants, Oil & Gas, Cement, Others) By Region (North America, Asia Pacific, Europe, Latin America, Middle East & Africa); End-User Landscape, Company Market Share Analysis, and Competitor Analysis
The global power and control cable market will rise from USD 142.5 billion in 2020 to surpass USD 170.2 billion by 2026 at a CAGR of 6.2% in the subsequent forecast period.
The power and control cables are employed in the electric utility in both buildings and infrastructure locations. They come in a multitude of voltages for people's convenience. Control cables are used to monitor or gauge in the well-known field of automation, just as power cables are used to transfer electrical energy.
Buildings, construction, and the railway sector are among the major end-users in the industry. The continued improvements in electricity infrastructure are the principal cause driving up power and control cable demand. The convergence of sustainable energy networks has drawn even more attention to the need to restructure the existing electrical infrastructure. Increasing demand for alternative fuels and advancements in IoT power condition monitoring, as well as a rising adoption for smart grid infrastructure, are expected to support the market growth.
Power and control cables are two identified product categories in the market. Power cables, which include various insulating power cables with voltage levels ranging from 1-500KV and beyond, are used to convey and transmit electrical high-electricity electric power in overhead wires of the transmission network.
Control cables, on the other hand, are specifically intended for the unified operation of electrical equipment and a diversity of computerized and wiring control commands. Its function, according to its description, is to deliver control signals over a specialized non-load cable. It is appropriate for use in PVC shielded PVC sheathed control cables in mining and processing businesses, the energy automotive sector, for the exchange of rated voltage 450/750 volts below the regulation, security lines, and other operations.
By 2026, the power cable segment of the market is expected to rise at a pace of over 5.8%. Power cables will gain widespread adoption in the electrical industry for a wide range of applications, resulting in higher penetration. Massive infrastructure developments have seen a considerable transition in recent years, leading to a huge increase in market share. Also, the government's priority on increasing electricity generation and transmission capacities will strengthen the analysis of the market during the projected timeline.
The market is categorized depending on voltage as high, medium, and low. Due to a spike in the volume of renewable energy technologies and grid connection linkages, the necessity for power and control cables in the high voltage segment is anticipated to expand exponentially.
The market is classified into two types based on application: Industrial and Utilities. An exponential rise in energy demand, aided by a thriving industrial sector, will have a positive impact on the market dynamics. Furthermore, growing reliance on manufactured goods, as well as growing urbanization in developing economies, will boost the global demand for power and control cables.
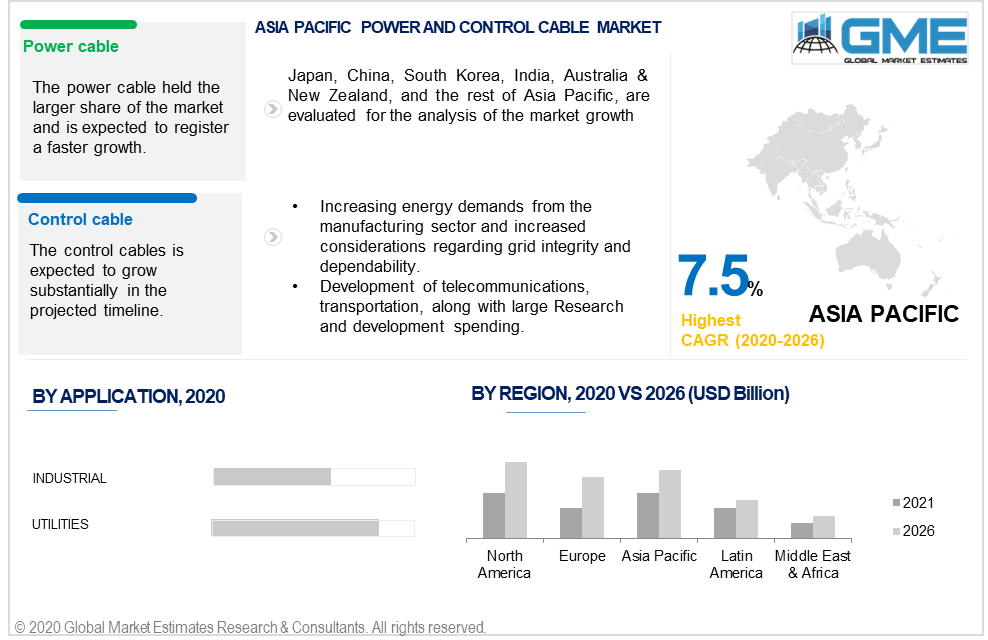
Asia-Pacific is among the major revenue generator growing at a CAGR of 7.5%, with China, Japan, and India being the prominent countries with substantial growth prospects.
Owing to increasing energy demands from the manufacturing sector and increased considerations regarding grid integrity and dependability, the APAC market is estimated to grow significantly in the future. The extension of UHV and EHV networks, the development of telecommunications, transportation, and energy industries, along with large research and development spending, all are aiding the region's market expansion.
North America market will foresee significant growth due to continued investments in grid infrastructure extension and enhancement, as well as the replacement of old T&D networks. Furthermore, the implementation of smart grid networks to fulfil rising electricity demands in the commercial and industrial sectors will boost regional growth.
To increase their market share, prominent market participants are focusing on new product launches with novel features. Long-term agreements are also among the prime strategies used by market giants to gain a competitive advantage in the global market. Furthermore, backward and forward integration are also noticed in the industry.
Prysmian Group, Sumitomo Electric Industries, Ltd., Nexans, Belden, Inc., Furukawa Electric Co., Ltd., and LS Cable & System Ltd, Polycab, KEI Industries Limited are among the major players in the market.
Please note: This is not an exhaustive list of companies profiled in the report.
Chapter 1 Methodology
1.1 Market scope & definitions
1.2 Estimates & forecast calculation
1.3 Historical data overview and validation
1.4 Data sources
1.4.1 Secondary
1.4.2 Primary
Chapter 2 Report Outlook
2.1 Power and Control Cable Industry overview, 2020-2026
2.1.1 Industry overview
2.1.2 Product overview
2.1.3 Voltage overview
2.1.4 Application overview
2.1.5 Regional overview
Chapter 3 Power and Control Cable Industry Trends
3.1 Market segmentation
3.2 Industry background, 2020-2026
3.3 Market key trends
3.3.1 Positive trends
3.3.2 Industry challenges
3.4 Prospective growth scenario
3.5 COVID-19 influence over industry growth
3.6 Porter’s analysis
3.7 PESTEL analysis
3.8 Value chain & supply chain analysis
3.9 Regulatory framework
3.9.1 North America
3.9.2 Europe
3.9.3 APAC
3.9.4 LATAM
3.9.5 MEA
3.10 Technology overview
3.11 Market share analysis, 2020
3.11.1 Company positioning overview, 2020
Chapter 4 Power and Control Cable Market, By Product
4.1 Product Outlook
4.2 Power Cable
4.2.1 Market size, by region, 2020-2026 (USD Million)
4.3 Control Cable
4.3.1 Market size, by region, 2020-2026 (USD Million)
Chapter 5 Power and Control Cable Market, By voltage
5.1 Voltage Outlook
5.2 High
5.2.1 Market size, by region, 2020-2026 (USD Million)
5.3 Medium
5.3.1 Market size, by region, 2020-2026 (USD Million)
5.4 Low
5.4.1 Market size, by region, 2020-2026 (USD Million)
Chapter 6 Power and Control Cable Market, By Application
6.1 Application Outlook
6.2 Utilities
6.2.1 Market size, by region, 2020-2026 (USD Million)
6.3 Power Plants
6.3.1 Market size, by region, 2020-2026 (USD Million)
6.4 Oil & Gas
6.4.1 Market size, by region, 2020-2026 (USD Million)
6.5 Cement
6.5.1 Market size, by region, 2020-2026 (USD Million)
6.6 Others
6.6.1 Market size, by region, 2020-2026 (USD Million)
Chapter 7 Power and Control Cable Market, By Region
7.1 Regional outlook
7.2 North America
7.2.1 Market size, by country 2020-2026 (USD Million)
7.2.2 Market size, by product, 2020-2026 (USD Million)
7.2.3 Market size, by voltage, 2020-2026 (USD Million)
7.2.4 Market size, by application, 2020-2026 (USD Million)
7.2.5 U.S.
7.2.5.1 Market size, by product, 2020-2026 (USD Million)
7.2.5.2 Market size, by voltage, 2020-2026 (USD Million)
7.2.5.3 Market size, by application, 2020-2026 (USD Million)
7.2.6 Canada
7.2.6.1 Market size, by product, 2020-2026 (USD Million)
7.2.6.2 Market size, by voltage, 2020-2026 (USD Million)
7.2.6.3 Market size, by application, 2020-2026 (USD Million)
7.2.7 Mexico
7.2.7.1 Market size, by product, 2020-2026 (USD Million)
7.2.7.2 Market size, by voltage, 2020-2026 (USD Million)
7.2.7.3 Market size, by application, 2020-2026 (USD Million)
7.3 Europe
7.3.1 Market size, by country 2020-2026 (USD Million)
7.3.2 Market size, by product, 2020-2026 (USD Million)
7.3.3 Market size, by voltage, 2020-2026 (USD Million)
7.3.4 Market size, by application, 2020-2026 (USD Million)
7.3.5 Germany
7.2.5.1 Market size, by product, 2020-2026 (USD Million)
7.2.5.2 Market size, by voltage, 2020-2026 (USD Million)
7.2.5.3 Market size, by application, 2020-2026 (USD Million)
7.3.6 Spain
7.3.6.1 Market size, by product, 2020-2026 (USD Million)
7.3.6.2 Market size, by voltage, 2020-2026 (USD Million)
7.3.6.3 Market size, by application, 2020-2026 (USD Million)
7.3.7 France
7.3.7.1 Market size, by product, 2020-2026 (USD Million)
7.3.7.2 Market size, by voltage, 2020-2026 (USD Million)
7.3.7.3 Market size, by application, 2020-2026 (USD Million)
7.3.8 Italy
7.3.8.1 Market size, by product, 2020-2026 (USD Million)
7.3.8.2 Market size, by voltage, 2020-2026 (USD Million)
7.3.8.3 Market size, by application, 2020-2026 (USD Million)
7.4 Asia Pacific
7.4.1 Market size, by country 2020-2026 (USD Million)
7.4.2 Market size, by product, 2020-2026 (USD Million)
7.4.3 Market size, by voltage, 2020-2026 (USD Million)
7.4.4 Market size, by application, 2020-2026 (USD Million)
7.4.5 China
7.4.5.1 Market size, by product, 2020-2026 (USD Million)
7.4.5.2 Market size, by voltage, 2020-2026 (USD Million)
7.4.5.3 Market size, by application, 2020-2026 (USD Million)
7.4.6 India
7.4.6.1 Market size, by product, 2020-2026 (USD Million)
7.4.6.2 Market size, by voltage, 2020-2026 (USD Million)
7.4.6.3 Market size, by application, 2020-2026 (USD Million)
7.4.7 Malaysia
7.4.7.1 Market size, by product, 2020-2026 (USD Million)
7.4.7.2 Market size, by voltage, 2020-2026 (USD Million)
7.4.7.3 Market size, by application, 2020-2026 (USD Million)
7.4.8 Australia
7.4.8.1 Market size, by product, 2020-2026 (USD Million)
7.4.8.2 Market size, by voltage, 2020-2026 (USD Million)
7.4.8.3 Market size, by application, 2020-2026 (USD Million)
7.4.9 South Korea
7.4.9.1 Market size, by product, 2020-2026 (USD Million)
7.4.9.2 Market size, by voltage, 2020-2026 (USD Million)
7.4.9.3 Market size, by application, 2020-2026 (USD Million)
7.5 Central & South America
7.5.1 Market size, by country 2020-2026 (USD Million)
7.5.2 Market size, by product, 2020-2026 (USD Million)
7.5.3 Market size, by voltage, 2020-2026 (USD Million)
7.5.4 Market size, by application, 2020-2026 (USD Million)
7.5.5 Brazil
7.5.5.1 Market size, by product, 2020-2026 (USD Million)
7.5.5.2 Market size, by voltage, 2020-2026 (USD Million)
7.5.5.3 Market size, by application, 2020-2026 (USD Million)
7.5.6 Argentina
7.5.6.1 Market size, by product, 2020-2026 (USD Million)
7.5.6.2 Market size, by voltage, 2020-2026 (USD Million)
7.5.6.3 Market size, by application, 2020-2026 (USD Million)
7.6 MEA
7.6.1 Market size, by country 2020-2026 (USD Million)
7.6.2 Market size, by product, 2020-2026 (USD Million)
7.6.3 Market size, by voltage, 2020-2026 (USD Million)
7.6.4 Market size, by application, 2020-2026 (USD Million)
7.6.5 Saudi Arabia
7.6.5.1 Market size, by product, 2020-2026 (USD Million)
7.6.5.2 Market size, by voltage, 2020-2026 (USD Million)
7.6.5.3 Market size, by application, 2020-2026 (USD Million)
7.6.6 UAE
7.6.6.1 Market size, by product, 2020-2026 (USD Million)
7.6.6.2 Market size, by voltage, 2020-2026 (USD Million)
7.6.6.3 Market size, by application, 2020-2026 (USD Million)
7.6.7 South Africa
7.6.7.1 Market size, by product, 2020-2026 (USD Million)
7.6.7.2 Market size, by voltage, 2020-2026 (USD Million)
7.6.7.3 Market size, by application, 2020-2026 (USD Million)
Chapter 8 Company Landscape
8.1 Competitive analysis, 2020
8.2 Prysmian
8.2.1 Company overview
8.2.2 Financial analysis
8.2.3 Strategic positioning
8.2.4 Infographic analysis
8.3 Nexans
8.3.1 Company overview
8.3.2 Financial analysis
8.3.3 Strategic positioning
8.3.4 Infographic analysis
8.4 Sumitomo Electric Industries
8.4.1 Company overview
8.4.2 Financial analysis
8.4.3 Strategic positioning
8.4.4 Infographic analysis
8.5 LS Cable & System
8.5.1 Company overview
8.5.2 Financial analysis
8.5.3 Strategic positioning
8.5.4 Infographic analysis
8.6 General Cable
8.6.1 Company overview
8.6.2 Financial analysis
8.6.3 Strategic positioning
8.6.4 Infographic analysis
8.7 Furukawa Electric
8.7.1 Company overview
8.7.2 Financial analysis
8.7.3 Strategic positioning
8.7.4 Infographic analysis
8.8 Southwire
8.8.1 Company overview
8.8.2 Financial analysis
8.8.3 Strategic positioning
8.8.4 Infographic analysis
8.9 Polycab
8.9.1 Company overview
8.9.2 Financial analysis
8.9.3 Strategic positioning
8.9.4 Infographic analysis
8.10 CMI
8.10.1 Company overview
8.10.2 Financial analysis
8.10.3 Strategic positioning
8.10.4 Infographic analysis
8.11 Havells
8.11.1 Company overview
8.11.2 Financial analysis
8.11.3 Strategic positioning
8.11.4 Infographic analysis
8.12 Bosch
8.12.1 Company overview
8.12.2 Financial analysis
8.12.3 Strategic positioning
8.12.4 Infographic analysis
8.13 Nynas AB
8.13.1 Company overview
8.13.2 Financial analysis
8.13.3 Strategic positioning
8.13.4 Infographic analysis
8.14 Ergon Inc.
8.14.1 Company overview
8.14.2 Financial analysis
8.14.3 Strategic positioning
8.14.4 Infographic analysis
8.15 NKT
8.15.1 Company overview
8.15.2 Financial analysis
8.15.3 Strategic positioning
8.15.4 Infographic analysis
8.16 Hangzhou Cable Company
8.16.1 Company overview
8.16.2 Financial analysis
8.16.3 Strategic positioning
8.16.4 Infographic analysis
8.17 TPC Wire & Cable
8.17.1 Company overview
8.17.2 Financial analysis
8.17.3 Strategic positioning
8.17.4 Infographic analysis
8.18 HENGTONG GROUP
8.18.1 Company overview
8.18.2 Financial analysis
8.18.3 Strategic positioning
8.18.4 Infographic analysis
8.19 Belden
8.19.1 Company overview
8.19.2 Financial analysis
8.19.3 Strategic positioning
8.19.4 Infographic analysis
8.20 Encore Wire
8.20.1 Company overview
8.20.2 Financial analysis
8.20.3 Strategic positioning
8.20.4 Infographic analysis
The Global Power and Control Cable Market has been studied from the year 2019 till 2026. However, the CAGR provided in the report is from the year 2021 to 2026. The research methodology involved three stages: Desk research, Primary research, and Analysis & Output from the entire research process.

The desk research involved a robust background study which meant referring to paid and unpaid databases to understand the market dynamics; mapping contracts from press releases; identifying the key players in the market, studying their product portfolio, competition level, annual reports/SEC filings & investor presentations; and learning the demand and supply-side analysis for the Power and Control Cable Market.

The primary research activity included telephonic conversations with more than 50 tier 1 industry consultants, distributors, and end-use product manufacturers.

Finally, based on the above thorough research process, an in-depth analysis was carried out considering the following aspects: market attractiveness, current & future market trends, market share analysis, SWOT analysis of the company and customer analytics.

Frequently Asked Questions

This FREE sample includes market data points, ranging from trend analyses to market estimates & forecasts. See for yourself.
Or view our licence options:
Tailor made solutions just for you
80% of our clients seek made-to-order reports. How do you want us to tailor yours?
OUR CLIENTS


