This report was recently updated on August 23 2025 with the latest and most recent
market numbers
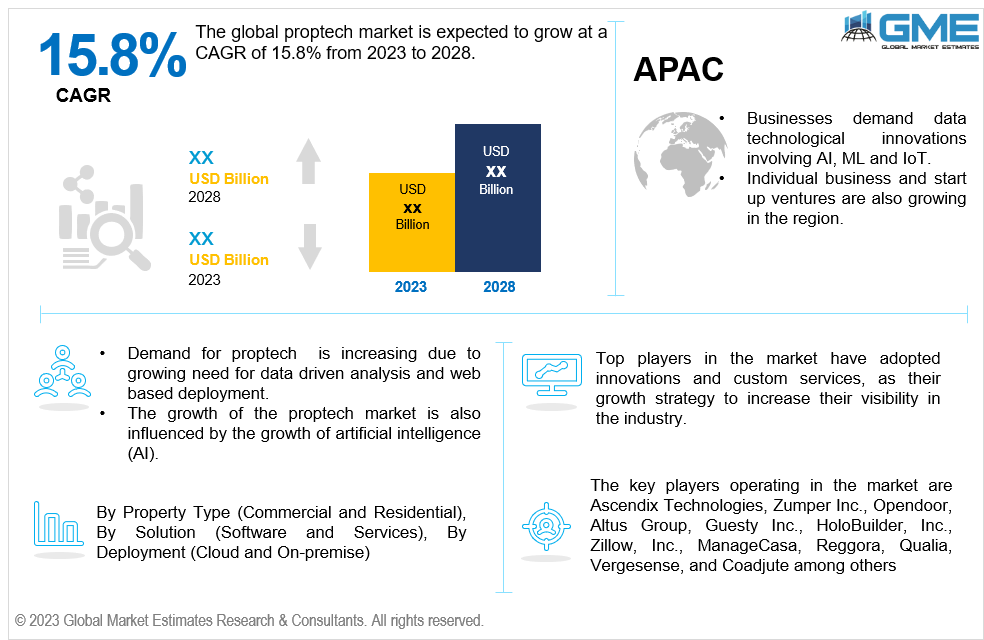
Global PropTech Market Size, Trends & Analysis - Forecasts to 2028 By Property Type (Commercial & Industrial and Residential), By Solution (Software and Services), By Deployment (Cloud-based and On-premise), By End User (Housing Associations, Property Managers/ Agents, Property Investors and Others) and By Region (North America, Asia Pacific, Central & South America, Europe, and Middle East and Africa), Competitive Landscape, Company Market Share Analysis, and End User Analysis
The global proptech market is expected to grow at a CAGR of 15.8% from 2023 to 2028. PropTech refers to the use of digital technology to innovate and improve various aspects of the real estate industry. Some of the major driving factors for the global proptech market growth include rising demand for data driven analysis and web based deployment. The global proptech market growth is also influenced by the growth of artificial intelligence (AI).
Moreover, with the Internet of Things, homeowners and property managers can remotely control various aspects of a property, such as lighting, security systems, thermostats, and appliances. As for visual and augmented reality, the industry can enhance customer experience by providing immersive and 3D experiences for virtual property tours and design ideas. Building information modelling (BIM) involves generating digital representations of physical and functional characteristics expected in the final outcome of the property. It helps business and government agencies, architects, and designers plan, design, and construct buildings with several properties such as water, electricity, communication lines, roads, etc.
Using machine learning and property management software, one can predict and analyze market trends, which helps to make informed decisions. That, in turn, helps provide insights to the clients regarding real estate. Moreover, with such software and technology, manual work is reduced manifolds while increasing precision reduces the possibilities of errors. Monitoring and maintaining data payments from owners and tenants also become convenient for tracking.
But one of the main restraint of the global proptech market is the cost incurred on the software and equipment. The initial high cost of investment can deter the market players from investing in the proptech market
Based on property type, the market is segmented into residential and commercial & industrial. The residential segment held the highest share in 2021 and is expected to retain its dominance over the forecast period. This is attributed to the technological dependence of the residential sector in the real estate market. There is a high reliance on digital security services and virtual tours. Due to virtual tours, the real estate market can easily tap into more clients than before, with no other way than physical presence at the location. The feature of virtual tours enables potential clients to explore the option of customizing specific variable options in designs, which attracts more clients remotely from any place on a geographical level.
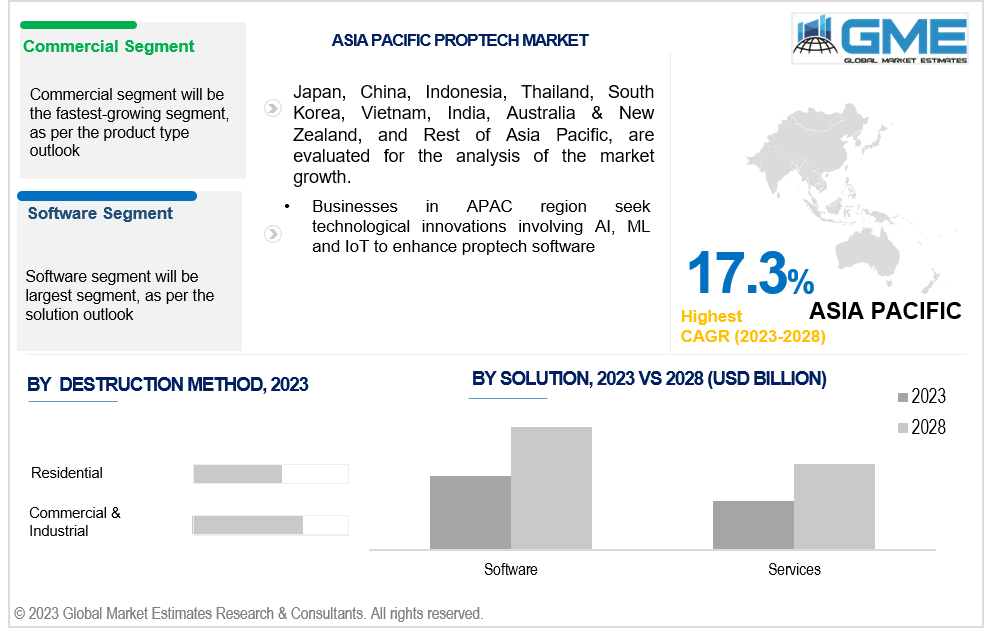
Moreover, commercial & industrial sector is expected to grow with the highest CAGR in the forecast period from 2023 to 2028. The growth rising due to the demand for office spaces. Individuals are starting their own business and coming up with start-ups. Integration of smart devices with Internet of Things and artificial intelligence is enabling workspaces to turn into smart offices, which have constant and good quality network and internet connection for global networking.
Based on solution, the market is segmented software and services. Software segment accounted for holding highest share in the market until 2021 and is projected to continue its dominance over the forecast period. The major drivers for the growth of the software segment include growing demand for software such as property management software, building information modelling, and others. Such software aid the real estate agents and firms manage and compile information in a more efficient manner, while helping clients choose and track their preferences. It is cost effective and enhances communication between different selling and buying parties.
The service segment is expected to witness highest rate of growth in the forecast period. This growth can be attributed to factors such as rising demand for alternatives to old fashioned brokers and landlords, while introducing new renting and buying practices. Clients prefer to consult industry experts before finalising a space to manage the budget with the best possible resources depending on the requirement of the client.
Based on deployment, the market is segmented cloud and on-premise. On-premise accounted for highest share in the market in 2021. This is due to on-premise deployment that provide the clients a greater control over their resources and hardware. It also protects the clients from any malware in the cloud-based security software. Moreover, easy customization in comparison to cloud, leads to more demand for the on-premise segment.
The cloud segment is anticipated to exhibit a high CAGR in the forecast period. Several purchasing groups involve, investors, housing societies etc. They choose cloud based services because of its affordable costs, simple user interface, and convenient tracking options. One can easily back up data and access it from the cloud in the absence of main devices or parent servers, while preventing the loss of essential data.
Based on end users, the market is segmented into housing associations, property managers/ agents, property investors and others. housing associations held the highest share in the market until 2021 and is expected to retain its dominance in the forecast period. Residential complexes and association often face problems in tracking payments, maintenance, as well as keeping a track of tenants. Using proptech softwares remove the hassle of manual accounting of payments and tenancy and offer a seamless platform to the users.
Property managers/ agents will exhibit highest CAGR in the forecast period. This is due to the growing demand for office and commercial spaces in the market. Integrating smart devices and AI, reduces human interference in the system of payments and security and arranges data in a very simple and accessible manner. Furthermore, by using softwares, one can present property data in a well-organized manner that can attract more clients.
North America is expected to be the largest region in the global proptech market during the forecast period. The real estate market in the United States has very stable growth and is very advanced in technology. The rise in technology usage can be attributed to millennials and Gen Z's tech-savvy nature, wherein they incorporate it into their daily lives. Firms such as Ascendix Technologies and Zumper Inc, cater to the market and are prominent players in the region.
Asia Pacific is analyzed to be the fastest growing region across the global proptech market. The market in China and India are largest in the APAC region. Technological innovations involving AI, ML, and IoT make the softwares more advanced with better features for the proptech softwares. Furthermore, people are opting to start their own business and innovating ideas for start-ups. These factors are responsible for driving the market growth in the Asia Pacific region.
The key players operating in the market are Ascendix Technologies, Zumper Inc., Opendoor, Altus Group, Guesty Inc., HoloBuilder, Inc., Zillow, Inc., ManageCasa, Reggora, Qualia, Vergesense, and Coadjute among others. These firms innovate and provide custom services, as growth strategies. For instance, Ascendix Technologies develops proptech apps and launches them in the market based on the needs of the customer.
Please note: This is not an exhaustive list of companies profiled in the report.
1 STRATEGIC INSIGHTS ON NEW REVENUE POCKETS
1.1 Strategic Opportunity & Attractiveness Analysis
1.1.1 Hot Revenue Pockets
1.1.2 Market Attractiveness Score
1.1.3 Revenue Impacting Opportunity
1.1.4 High Growing Region/Country
1.1.5 Competitor Analysis
1.1.6 Consumer Analysis
1.2 Global Market Estimates' View
1.3 Strategic Insights across Business Functions
1.3.1 For Chief Executive Officers
1.3.2 For Chief Marketing Officers
1.3.3 For Chief Strategy Officers
1.4 Evaluate the Potential of your Existing Business Lines vs. New Lines to Enter Into
2.1 Technological Adoption Rate
2.2 Current Trend Impact Analysis
2.3 Future Trend Impact Analysis
2.4 Data Metrics on Feed Stocks
3.1.2 Adjacent Market Opportunities
3.1.3 Ancillary Market Opportunities
3.2.1 Market Drivers: Impact Analysis
3.2.2 Market Restraints: Impact Analysis
3.2.3 Market Opportunities: Impact Analysis
3.2.4 Market Challenges: Impact Analysis
3.3.1 Porter’s Five Forces Analysis
3.3.1.1 Threat of New Entrants
3.3.1.2 Threat of New Substitutes
3.3.1.3 Bargaining Power of Suppliers
3.3.1.4 Bargaining Power of Buyers
3.3.1.5 Intensity of Competitive Rivalry
3.3.2 SWOT Analysis; By Factor (Political & Legal, Economic, and Technological)
4 GLOBAL PROPTECH MARKET, BY PROPERTY TYPE
4.2 PropTech Market: Property Type Scope Key Takeaways
4.3 Revenue Growth Analysis, 2022 & 2028
4.4.1 Residential Market Estimates and Forecast, 2020-2028 (USD Billion)
4.5.1 Commercial & Industrial Market Estimates and Forecast, 2020-2028 (USD Billion)
5 GLOBAL PROPTECH MARKET, BY SOLUTIONS
5.2 PropTech Market: Solution Scope Key Takeaways
5.3 Revenue Growth Analysis, 2022 & 2028
5.4.1 Software Market Estimates and Forecast, 2020-2028 (USD Billion)
5.5.1 Services Market Estimates and Forecast, 2020-2028 (USD Billion)
6 GLOBAL PROPTECH MARKET, BY DEPLOYMENT
6.2 PropTech Market: Deployment Scope Key Takeaways
6.3 Revenue Growth Analysis, 2022 & 2028
6.4.1 Cloud-based Market Estimates and Forecast, 2020-2028 (USD Billion)
6.5.1 On-premise Market Estimates and Forecast, 2020-2028 (USD Billion)
7 GLOBAL PROPTECH MARKET, BY END USER
7.2 PropTech Market: End User Scope Key Takeaways
7.3 Revenue Growth Analysis, 2022 & 2028
7.4.1 Housing Associations Market Estimates and Forecast, 2020-2028 (USD Billion)
7.5.1 Property Managers/ Agents Market Estimates and Forecast, 2020-2028 (USD Billion)
7.6.1 Property Investors Market Estimates and Forecast, 2020-2028 (USD Billion)
7.7.1 Others Market Estimates and Forecast, 2020-2028 (USD Billion)
8 GLOBAL PROPTECH MARKET, BY REGION
8.2 North America PropTech Market Estimates and Forecast, 2020-2028 (USD Billion)
8.2.5.1 U.S. PropTech Market Estimates and Forecast, 2020-2028 (USD Billion)
8.2.5.2 Canada PropTech Market Estimates and Forecast, 2020-2028 (USD Billion)
8.2.5.3 Mexico PropTech Market Estimates and Forecast, 2020-2028 (USD Billion)
8.3 Europe PropTech Market Estimates and Forecast, 2020-2028 (USD Billion)
8.3.5.1 Germany PropTech Market Estimates and Forecast, 2020-2028 (USD Billion)
8.3.5.2 U.K. Presered Flowers Market Estimates and Forecast, 2020-2028 (USD Billion)
8.3.5.3 France PropTech Market Estimates and Forecast, 2020-2028 (USD Billion)
8.3.5.4 Italy PropTech Market Estimates and Forecast, 2020-2028 (USD Billion)
8.3.5.5 Spain PropTech Market Estimates and Forecast, 2020-2028 (USD Billion)
8.3.5.6 Netherlands PropTech Market Estimates and Forecast, 2020-2028 (USD Billion)
8.3.5.7 Rest of Europe PropTech Market Estimates and Forecast, 2020-2028 (USD Billion)
8.4 Asia Pacific PropTech Market Estimates and Forecast, 2020-2028 (USD Billion)
8.4.5.1 China PropTech Market Estimates and Forecast, 2020-2028 (USD Billion)
8.4.5.2 Japan PropTech Market Estimates and Forecast, 2020-2028 (USD Billion)
8.4.5.3 India PropTech Market Estimates and Forecast, 2020-2028 (USD Billion)
8.4.5.4 South Korea PropTech Market Estimates and Forecast, 2020-2028 (USD Billion)
8.4.5.5 Singapore PropTech Market Estimates and Forecast, 2020-2028 (USD Billion)
8.4.5.6 Malaysia PropTech Market Estimates and Forecast, 2020-2028 (USD Billion)
8.4.5.7 Thailand PropTech Market Estimates and Forecast, 2020-2028 (USD Billion)
8.4.5.8 Indonesia PropTech Market Estimates and Forecast, 2020-2028 (USD Billion)
8.4.5.9 Vietnam PropTech Market Estimates and Forecast, 2020-2028 (USD Billion)
8.4.5.10 Taiwan PropTech Market Estimates and Forecast, 2020-2028 (USD Billion)
8.4.5.11 Rest of Asia Pacific PropTech Market Estimates and Forecast, 2020-2028 (USD Billion)
8.5 Middle East and Africa PropTech Market Estimates and Forecast, 2020-2028 (USD Billion)
8.5.5.1 Saudi Arabia PropTech Market Estimates and Forecast, 2020-2028 (USD Billion)
8.5.5.2 U.A.E. PropTech Market Estimates and Forecast, 2020-2028 (USD Billion)
8.5.5.3 Israel PropTech Market Estimates and Forecast, 2020-2028 (USD Billion)
8.5.5.4 South Africa PropTech Market Estimates and Forecast, 2020-2028 (USD Billion)
8.6 Central & South America PropTech Market Estimates and Forecast, 2020-2028 (USD Billion)
8.6.5.1 Brazil PropTech Market Estimates and Forecast, 2020-2028 (USD Billion)
8.6.5.2 Argentina PropTech Market Estimates and Forecast, 2020-2028 (USD Billion)
8.6.5.3 Chile PropTech Market Estimates and Forecast, 2020-2028 (USD Billion)
9.1 Company Market Share Analysis
9.2 Four Quadrant Positioning Matrix
9.4.1.1 Business Description & Financial Analysis
9.4.1.3 Products & Services Offered
9.4.1.4 Strategic Alliances between Business Partners
9.4.2.1 Business Description & Financial Analysis
9.4.2.3 Products & Services Offered
9.4.2.4 Strategic Alliances between Business Partners
9.4.3.1 Business Description & Financial Analysis
9.4.3.3 Products & Services Offered
9.4.3.4 Strategic Alliances between Business Partners
9.4.4.1 Business Description & Financial Analysis
9.4.4.3 Products & Services Offered
9.4.4.4 Strategic Alliances between Business Partners
9.4.5.1 Business Description & Financial Analysis
9.4.5.3 Products & Services Offered
9.4.5.4 Strategic Alliances between Business Partners
9.4.6.1 Business Description & Financial Analysis
9.4.6.3 Products & Services Offered
9.4.6.4 Strategic Alliances between Business Partners
9.4.7.1 Business Description & Financial Analysis
9.4.7.3 Products & Services Offered
9.4.8.4 Strategic Alliances between Business Partners
9.4.8.1 Business Description & Financial Analysis
9.4.8.3 Products & Services Offered
9.4.8.4 Strategic Alliances between Business Partners
9.4.9.1 Business Description & Financial Analysis
9.4.9.3 Products & Services Offered
9.4.9.4 Strategic Alliances between Business Partners
9.4.10.1 Business Description & Financial Analysis
9.4.10.3 Products & Services Offered
9.4.10.4 Strategic Alliances between Business Partners
9.4.11.1 Business Description & Financial Analysis
9.4.11.3 Products & Services Offered
9.4.11.4 Strategic Alliances between Business Partners
10.1.2 Market Scope & Segmentation
10.2.1.2 GMEs Internal Data Repository
10.2.1.3 Secondary Resources & Third Party Perspectives
10.2.1.4 Company Information Sources
10.2.2.1 Various Types of Respondents for Primary Interviews
10.2.2.2 Number of Interviews Conducted throughout the Research Process
10.2.2.4 Discussion Guide for Primary Participants
10.2.3.1 Expert Panels Across 30+ Industry
10.2.4.1 Paid Local Experts Across 30+ Industry Across each Region
10.3.1.1 Macro-Economic Indicators Considered
10.3.1.2 Micro-Economic Indicators Considered
10.3.2.1 Company Share Analysis Approach
10.3.2.2 Estimation of Potential Product Sales
10.4.2 Time Series, Cross Sectional & Panel Data Analysis
10.5.1 Inhouse AI Based Real Time Analytics Tool
10.5.2 Output From Desk & Primary Research
10.6 Research Assumptions & Limitations
LIST OF TABLES
1 Global PropTech Market, By Property Type, 2020-2028 (USD Billion)
2 Residential Market, By Region, 2020-2028 (USD Billion)
3 Commercial & Industrial Market, By Region, 2020-2028 (USD Billion)
4 Global PropTech Market, By Solutions, 2020-2028 (USD Billion)
5 Software Market, By Region, 2020-2028 (USD Billion)
6 Services Market, By Region, 2020-2028 (USD Billion)
7 Global PropTech Market, By Deployment, 2020-2028 (USD Billion)
8 Cloud-based Market, By Region, 2020-2028 (USD Billion)
9 On-premise Market, By Region, 2020-2028 (USD Billion)
10 Global PropTech Market, By End User, 2020-2028 (USD Billion)
11 Housing Associations Market, By Region, 2020-2028 (USD Billion)
12 Property Managers/ Agents Market, By Region, 2020-2028 (USD Billion)
13 Property Investors Market, By Region, 2020-2028 (USD Billion)
14 Others Market, By Region, 2020-2028 (USD Billion)
15 Regional Analysis, 2020-2028 (USD Billion)
16 North America PropTech Market, By Property Type, 2020-2028 (USD Billion)
17 North America PropTech Market, By Solutions, 2020-2028 (USD Billion)
18 North America PropTech Market, By Deployment, 2020-2028 (USD Billion)
19 North America PropTech Market, By End User, 2020-2028 (USD Billion)
20 North America PropTech Market, By Country, 2020-2028 (USD Billion)
21 U.S PropTech Market, By Property Type, 2020-2028 (USD Billion)
22 U.S PropTech Market, By Solutions, 2020-2028 (USD Billion)
23 U.S PropTech Market, By Deployment, 2020-2028 (USD Billion)
24 U.S PropTech Market, By End User, 2020-2028 (USD Billion)
25 Canada PropTech Market, By Property Type, 2020-2028 (USD Billion)
26 Canada PropTech Market, By Solutions, 2020-2028 (USD Billion)
27 Canada PropTech Market, By Deployment, 2020-2028 (USD Billion)
28 CANADA PropTech Market, By End User, 2020-2028 (USD Billion)
29 Mexico PropTech Market, By Property Type, 2020-2028 (USD Billion)
30 Mexico PropTech Market, By Solutions, 2020-2028 (USD Billion)
31 Mexico PropTech Market, By Deployment, 2020-2028 (USD Billion)
32 mexico PropTech Market, By End User, 2020-2028 (USD Billion)
33 Europe PropTech Market, By Property Type, 2020-2028 (USD Billion)
34 Europe PropTech Market, By Solutions, 2020-2028 (USD Billion)
35 Europe PropTech Market, By Deployment, 2020-2028 (USD Billion)
36 europe PropTech Market, By End User, 2020-2028 (USD Billion)
37 Germany PropTech Market, By Property Type, 2020-2028 (USD Billion)
38 Germany PropTech Market, By Solutions, 2020-2028 (USD Billion)
39 Germany PropTech Market, By Deployment, 2020-2028 (USD Billion)
40 germany PropTech Market, By End User, 2020-2028 (USD Billion)
41 UK PropTech Market, By Property Type, 2020-2028 (USD Billion)
42 UK PropTech Market, By Solutions, 2020-2028 (USD Billion)
43 UK PropTech Market, By Deployment, 2020-2028 (USD Billion)
44 U.kPropTech Market, By End User, 2020-2028 (USD Billion)
45 France PropTech Market, By Property Type, 2020-2028 (USD Billion)
46 France PropTech Market, By Solutions, 2020-2028 (USD Billion)
47 France PropTech Market, By Deployment, 2020-2028 (USD Billion)
48 france PropTech Market, By End User, 2020-2028 (USD Billion)
49 Italy PropTech Market, By Property Type, 2020-2028 (USD Billion)
50 Italy PropTech Market, By T Preservation Technique Type, 2020-2028 (USD Billion)
51 Italy PropTech Market, By Deployment, 2020-2028 (USD Billion)
52 italy PropTech Market, By End User, 2020-2028 (USD Billion)
53 Spain PropTech Market, By Property Type, 2020-2028 (USD Billion)
54 Spain PropTech Market, By Solutions, 2020-2028 (USD Billion)
55 Spain PropTech Market, By Deployment, 2020-2028 (USD Billion)
56 spain PropTech Market, By End User, 2020-2028 (USD Billion)
57 Rest Of Europe PropTech Market, By Property Type, 2020-2028 (USD Billion)
58 Rest Of Europe PropTech Market, By Solutions, 2020-2028 (USD Billion)
59 Rest of Europe PropTech Market, By Deployment, 2020-2028 (USD Billion)
60 REST OF EUROPE PropTech Market, By End User, 2020-2028 (USD Billion)
61 Asia Pacific PropTech Market, By Property Type, 2020-2028 (USD Billion)
62 Asia Pacific PropTech Market, By Solutions, 2020-2028 (USD Billion)
63 Asia Pacific PropTech Market, By Deployment, 2020-2028 (USD Billion)
64 asia PropTech Market, By End User, 2020-2028 (USD Billion)
65 Asia Pacific PropTech Market, By Country, 2020-2028 (USD Billion)
66 China PropTech Market, By Property Type, 2020-2028 (USD Billion)
67 China PropTech Market, By Solutions, 2020-2028 (USD Billion)
68 China PropTech Market, By Deployment, 2020-2028 (USD Billion)
69 china PropTech Market, By End User, 2020-2028 (USD Billion)
70 India PropTech Market, By Property Type, 2020-2028 (USD Billion)
71 India PropTech Market, By Solutions, 2020-2028 (USD Billion)
72 India PropTech Market, By Deployment, 2020-2028 (USD Billion)
73 india PropTech Market, By End User, 2020-2028 (USD Billion)
74 Japan PropTech Market, By Property Type, 2020-2028 (USD Billion)
75 Japan PropTech Market, By Solutions, 2020-2028 (USD Billion)
76 Japan PropTech Market, By Deployment, 2020-2028 (USD Billion)
77 japan PropTech Market, By End User, 2020-2028 (USD Billion)
78 South Korea PropTech Market, By Property Type, 2020-2028 (USD Billion)
79 South Korea PropTech Market, By Solutions, 2020-2028 (USD Billion)
80 South Korea PropTech Market, By Deployment, 2020-2028 (USD Billion)
81 south korea PropTech Market, By End User, 2020-2028 (USD Billion)
82 Middle East and Africa PropTech Market, By Property Type, 2020-2028 (USD Billion)
83 Middle East and Africa PropTech Market, By Solutions, 2020-2028 (USD Billion)
84 Middle East and Africa PropTech Market, By Deployment, 2020-2028 (USD Billion)
85 MIDDLE EAST AND AFRICA PropTech Market, By End User, 2020-2028 (USD Billion)
86 Middle East and Africa PropTech Market, By Country, 2020-2028 (USD Billion)
87 Saudi Arabia PropTech Market, By Property Type, 2020-2028 (USD Billion)
88 Saudi Arabia PropTech Market, By Solutions, 2020-2028 (USD Billion)
89 Saudi Arabia PropTech Market, By Deployment, 2020-2028 (USD Billion)
90 saudi arabia PropTech Market, By End User, 2020-2028 (USD Billion)
91 UAE PropTech Market, By Property Type, 2020-2028 (USD Billion)
92 UAE PropTech Market, By Solutions, 2020-2028 (USD Billion)
93 UAE PropTech Market, By Deployment, 2020-2028 (USD Billion)
94 uae PropTech Market, By End User, 2020-2028 (USD Billion)
95 Central & South America PropTech Market, By Property Type, 2020-2028 (USD Billion)
96 Central & South America PropTech Market, By Solutions, 2020-2028 (USD Billion)
97 Central & South America PropTech Market, By Deployment, 2020-2028 (USD Billion)
98 CENTRAL & SOUTH AMERICA PropTech Market, By End User, 2020-2028 (USD Billion)
99 Central & South America PropTech Market, By Country, 2020-2028 (USD Billion)
100 Brazil PropTech Market, By Property Type, 2020-2028 (USD Billion)
101 Brazil PropTech Market, By Solutions, 2020-2028 (USD Billion)
102 Brazil PropTech Market, By Deployment, 2020-2028 (USD Billion)
103 brazil PropTech Market, By End User, 2020-2028 (USD Billion)
104 Ascendix Technologies: Products & Services Offering
105 Zumper Inc.: Products & Services Offering
106 Opendoor: Products & Services Offering
107 Altus Group: Products & Services Offering
108 Guesty Inc.: Products & Services Offering
109 HOLOBUILDER, INC.: Products & Services Offering
110 Zillow, Inc. : Products & Services Offering
111 ManageCasa: Products & Services Offering
112 Coadjute: Products & Services Offering
113 Vergesense: Products & Services Offering
114 Other Companies: Products & Services Offering
LIST OF FIGURES
1 Global PropTech Market Overview
2 Global PropTech Market Value From 2020-2028 (USD Billion)
3 Global PropTech Market Share, By Property Type (2022)
4 Global PropTech Market Share, By Solutions (2022)
5 Global PropTech Market Share, By Deployment (2022)
6 Global PropTech Market Share, By End User (2022)
7 Global PropTech Market, By Region (Asia Pacific Market)
8 Technological Trends In Global PropTech Market
9 Four Quadrant Competitor Positioning Matrix
10 Impact Of Macro & Micro Indicators On The Market
11 Impact Of Key Drivers On The Global PropTech Market
12 Impact Of Challenges On The Global PropTech Market
13 Porter’s Five Forces Analysis
14 Global PropTech Market: By Property Type Scope Key Takeaways
15 Global PropTech Market, By Property Type Segment: Revenue Growth Analysis
16 Rose Market, By Region, 2020-2028 (USD Billion)
17 Commercial & Industrial Market, By Region, 2020-2028 (USD Billion)
18 Global PropTech Market: By Solutions Scope Key Takeaways
19 Global PropTech Market, By Solutions Segment: Revenue Growth Analysis
20 Software Market, By Region, 2020-2028 (USD Billion)
21 Services Market, By Region, 2020-2028 (USD Billion)
22 Global PropTech Market: By Deployment Scope Key Takeaways
23 Global PropTech Market, By Deployment Segment: Revenue Growth Analysis
24 Cloud-based Market, By Region, 2020-2028 (USD Billion)
25 On-premise Market, By Region, 2020-2028 (USD Billion)
26 Global PropTech Market: By End User Scope Key Takeaways
27 Global PropTech Market, By End User Segment: Revenue Growth Analysis
28 Housing Associations Market, By Region, 2020-2028 (USD Billion)
29 Property Managers/ Agents Market, By Region, 2020-2028 (USD Billion)
30 Property Investors Market, By Region, 2020-2028 (USD Billion)
31 Others Market, By Region, 2020-2028 (USD Billion)
32 Regional Segment: Revenue Growth Analysis
33 Global PropTech Market: Regional Analysis
34 North America PropTech Market Overview
35 North America PropTech Market, By Property Type
36 North America PropTech Market, By Solutions
37 North America PropTech Market, By Deployment
38 North America PropTech Market, By End User
39 North America PropTech Market, By Country
40 U.S. PropTech Market, By Property Type
41 U.S. PropTech Market, By Solutions
42 U.S. PropTech Market, By Deployment
43 U.S. PropTech Market, By End User
44 Canada PropTech Market, By Property Type
45 Canada PropTech Market, By Solutions
46 Canada PropTech Market, By Deployment
47 Canada PropTech Market, By End User
48 Mexico PropTech Market, By Property Type
49 Mexico PropTech Market, By Solutions
50 Mexico PropTech Market, By Deployment
51 Mexico PropTech Market, By End User
52 Four Quadrant Positioning Matrix
53 Company Market Share Analysis
54 Ascendix Technologies: Company Snapshot
55 Ascendix Technologies: SWOT Analysis
56 Ascendix Technologies: Geographic Presence
57 Zumper Inc.: Company Snapshot
58 Zumper Inc.: SWOT Analysis
59 Zumper Inc.: Geographic Presence
60 Opendoor: Company Snapshot
61 Opendoor: SWOT Analysis
62 Opendoor: Geographic Presence
63 Altus Group: Company Snapshot
64 Altus Group: Swot Analysis
65 Altus Group: Geographic Presence
66 Guesty Inc.: Company Snapshot
67 Guesty Inc.: SWOT Analysis
68 Guesty Inc.: Geographic Presence
69 Holobuilder, Inc.: Company Snapshot
70 Holobuilder, Inc.: SWOT Analysis
71 Holobuilder, Inc.: Geographic Presence
72 Zillow, Inc. : Company Snapshot
73 Zillow, Inc. : SWOT Analysis
74 Zillow, Inc. : Geographic Presence
75 ManageCasa: Company Snapshot
76 ManageCasa: SWOT Analysis
77 ManageCasa: Geographic Presence
78 Coadjute.: Company Snapshot
79 Coadjute.: SWOT Analysis
80 Coadjute.: Geographic Presence
81 Vergesense: Company Snapshot
82 Vergesense: SWOT Analysis
83 Vergesense: Geographic Presence
84 Other Companies: Company Snapshot
85 Other Companies: SWOT Analysis
86 Other Companies: Geographic Presence
The Global PropTech Market has been studied from the year 2019 till 2028. However, the CAGR provided in the report is from the year 2023 to 2028. The research methodology involved three stages: Desk research, Primary research, and Analysis & Output from the entire research process.

The desk research involved a robust background study which meant referring to paid and unpaid databases to understand the market dynamics; mapping contracts from press releases; identifying the key players in the market, studying their product portfolio, competition level, annual reports/SEC filings & investor presentations; and learning the demand and supply-side analysis for the PropTech Market.

The primary research activity included telephonic conversations with more than 50 tier 1 industry consultants, distributors, and end-use product manufacturers.

Finally, based on the above thorough research process, an in-depth analysis was carried out considering the following aspects: market attractiveness, current & future market trends, market share analysis, SWOT analysis of the company and customer analytics.

Frequently Asked Questions

This FREE sample includes market data points, ranging from trend analyses to market estimates & forecasts. See for yourself.
Or view our licence options:
Tailor made solutions just for you
80% of our clients seek made-to-order reports. How do you want us to tailor yours?
OUR CLIENTS


