This report was recently updated on August 14 2025 with the latest and most recent
market numbers
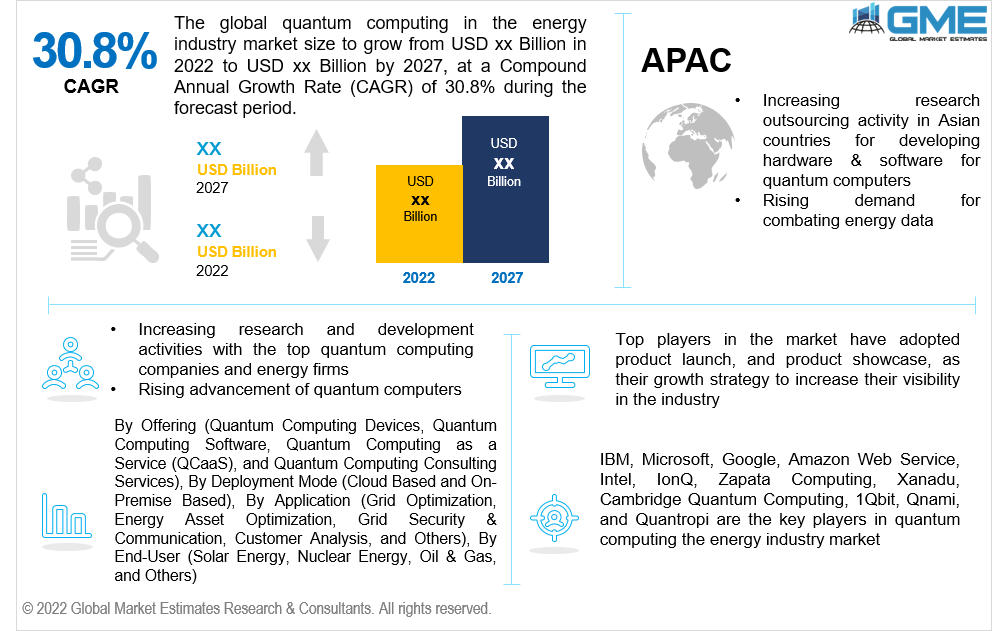
Global Quantum Computing In Energy Industry Market Size, Trends & Analysis - Forecasts to 2027 By Offering (Quantum Computing Devices, Quantum Computing Software, Quantum Computing as a Service (QCaaS), and Quantum Computing Consulting Services), By Deployment Mode (Cloud Based and On-Premise Based), By Application (Grid Optimization, Energy Asset Optimization, Grid Security & Communication, Customer Analysis, and Others), By End-User (Solar Energy, Nuclear Energy, Oil & Gas, and Others), By Region (North America, Asia Pacific, Central & South America, Europe, and the Middle East and Africa), Company Market Share Analysis, and Competitor Analysis
The Global Quantum Computing in Energy Industry Market is projected to grow at a CAGR value of 30.8% from 2022 to 2027.
Quantum computing is the phenomenon of using quantum physics to make new ways of computing using qubits like 0 or 1 in a superposition format. This way of computing is mainly used to conduct calculations and resolve any complex computer-related problems by applying the phenomena of quantum mechanics.
Quantum computing in the energy industry is expected to boom in the coming few years, especially post COVID-19 onset. The concept of using quantum computing in the energy industry flourished mainly because of the capability of simulating and modeling complex energy data, advancements in device optimization and increasing need for efficiency of procedures or systems, and ultimately analyzing problems with potential outcomes.
The advancement of quantum computers, rising demand for managing complex energy data, and the increasing investment programs by prominent technological associations for this technology's research are the major factors driving the market's growth.
As the globe's energy network is expanding due to growing population and demand, the complexity of the energy systems needed to support these networks also increases parallelly. The expansion of distributed energy resources and the emerging new load of classes, such as electric vehicles, exponential increase of the volumes of data needed to uphold, process and optimize grids. Hence, quantum technology is gaining keen attention from researchers to combat or address the growing energy demand and energy management.
To solve sizeable complex grid data, optimize the data, offer high-fidelity sensing, and offer fail-proof and safe communication and security system are some of the applications of quantum computing in the energy industry.
Furthermore, another prime reason the quantum computing market is expected to propel is the increasing number of funding programs by public and private firms, governments' research agencies and energy companies across the globe to conduct research activities related to quantum computing technology for managing energy data.
Based on offering, quantum computing in the energy industry market is segmented into quantum computing devices, a quantum computing software, quantum computing as a service (QCaaS), and quantum computing consulting services.
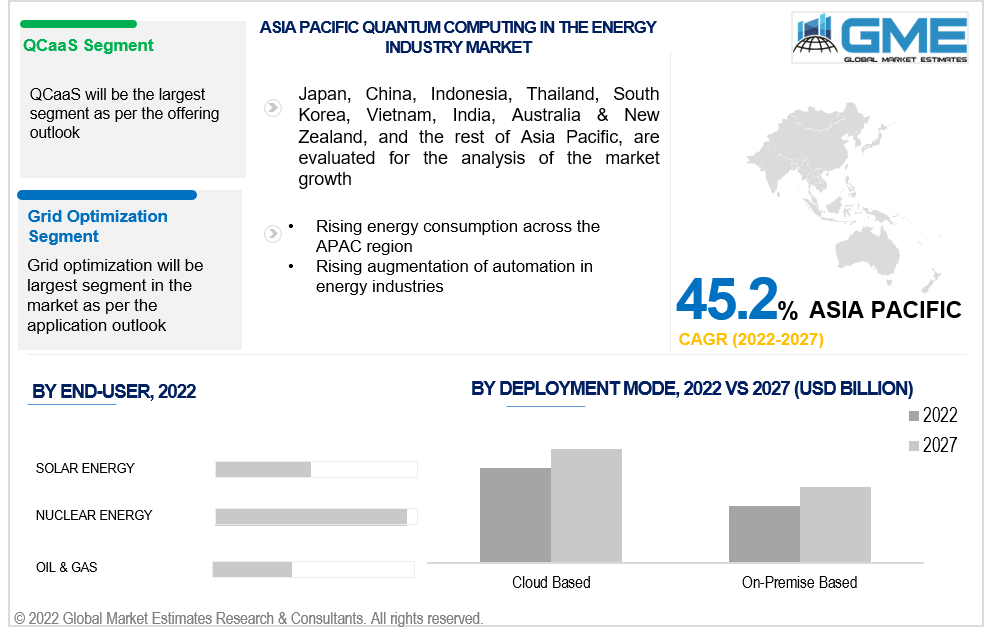
The quantum computing as a service (QCaaS) segment is expected to hold the largest share of the market during the forecast period. QCaaS is a cloud service that offers consumers or companies’ access to quantum computing platforms through the use of the internet is booming especially post the onset of COVID-19.
Based on the application, quantum computing in the energy industry market is segmented into grid optimization, energy asset optimization, grid security & communication, customer analysis, and others.
Grid optimization will be the fastest-growing segment in the market during the forecast period. The rising need to improve the energy system's performance and efficiency for electricity distribution using grid operators is essential for adopting quantum computing technology in the energy industry.
Based on the deployment model, quantum computing in the energy industry market is segmented into on-premise and cloud-based.
The cloud-based segment is expected to hold the largest share of the market during the forecast period. With the rising demand for energy across the globe and the increasing need to manage and calculate complex data using cloud-based platforms, the segment of the cloud platform ought to be proliferating.
Based on the end-user, quantum computing in the energy industry market is segmented into solar energy, nuclear energy, oil & gas, and others.
The nuclear energy segment is expected to hold the largest share of the market during the forecast period. The rising number of funding projects and increasing support from governments across the globe to support the development of quantum computers is one of the major factors driving the market's growth.
Based on region, quantum computing in the energy industry market can be segmented into North America (the United States, Canada, and Mexico), Asia Pacific (India, China, Japan, Malaysia, Singapore, and the Rest of Asia Pacific), Europe (Germany, United Kingdom, Italy, France, Spain, Netherlands, and Rest of Europe), Middle East & Africa (Saudi Arabia, United Arab Emirates, and Rest of the Middle East & Africa) and Central & South America (Brazil, Argentina, and Rest of Central and South America).
The North America (the United States, Canada, and Mexico) region is expected to be the dominant force in the market during the forecast period. Increasing research and development activities with the top quantum computing companies and energy firms and the rising need to manage the complex data generated are the prime reasons for the market in North America to grow.
The Asia Pacific (India, China, Japan, Malaysia, Singapore, and the Rest of Asia Pacific) region is expected to become the fastest-growing segment during the forecast period. Increasing research outsourcing activity in Asian countries for developing hardware & software for quantum computers, and rising demand for combating energy data, are the reasons for the Asia Pacific region to proliferate in the market from 2022 to 2027.
IBM, Microsoft, Google, Amazon Web Service, Intel, IonQ, Zapata Computing, Xanadu, Cambridge Quantum Computing, 1Qbit, Qnami, and Quantropi are the key players in quantum computing the energy industry market.
Please note: This is not an exhaustive list of companies profiled in the report.
Chapter 1 Methodology
1.1 Market Scope & Definitions
1.2 Estimates & Forecast Calculation
1.3 Historical Data Overview and Validation
1.4 Data Sources
1.4.1 Secondary
1.4.2 Primary
Chapter 2 Report Outlook
2.1 Global Quantum Computing in Energy Industry Overview, 2021-2026
2.1.1 Industry Overview
2.1.2 Deployment Mode Overview
2.1.3 Offering Overview
2.1.4 End-User Overview
2.1.5 Application Overview
2.1.6 Regional Overview
Chapter 3 Global Quantum Computing in Energy Industry Market Trends
3.1 Market Segmentation
3.2 Industry Background, 2016-2026
3.3 Market Key Trends
3.3.1 Positive Trends
3.3.1.1 Increasing demand for managing complex energy data
3.3.2 Industry Challenges
3.3.2.1 Lack of adequate infrastructure and automated industrial systems in developing nations
3.4 Prospective Growth Scenario
3.4.1 Deployment Mode Growth Scenario
3.4.2 Offering Growth Scenario
3.4.3 End-User Growth Scenario
3.4.4 Application Growth Scenario
3.5 COVID-19 Influence over Industry Growth
3.6 Porter’s Analysis
3.7 PESTEL Analysis
3.8 Value Chain & Supply Chain Analysis
3.9 Regulatory Framework
3.9.1 North America
3.9.2 Europe
3.9.3 APAC
3.9.4 LATAM
3.9.5 MEA
3.10 Application Overview
3.11 Market Share Analysis, 2021
3.11.1 Company Positioning Overview, 2021
Chapter 4 Global Quantum Computing in Energy Industry Market, By Deployment Mode
4.1 Deployment Mode Outlook
4.2 Cloud Based
4.2.1 Market Size, By Region, 2020-2027 (USD Billion)
4.3 On-Premise
4.3.1 Market Size, By Region, 2020-2027 (USD Billion)
Chapter 5 Global Quantum Computing in Energy Industry Market, By End-User
5.1 End-User Outlook
5.2 Solar Energy
5.2.1 Market Size, By Region, 2020-2027 (USD Billion)
5.3 Nuclear Energy
5.3.1 Market Size, By Region, 2020-2027 (USD Billion)
5.4 Oil & Gas
5.4.1 Market Size, By Region, 2020-2027 (USD Billion)
5.5 Others
5.5.1 Market Size, By Region, 2020-2027 (USD Billion)
Chapter 6 Global Quantum Computing in Energy Industry Market, By Application
6.1 Grid Optimization
6.1.1 Market Size, By Region, 2020-2027 (USD Billion)
6.2 Energy Asset Optimization
6.2.1 Market Size, By Region, 2020-2027 (USD Billion)
6.2 Grid Security & Communication
6.2.1 Market Size, By Region, 2020-2027 (USD Billion)
6.2 Customer Analysis
6.2.1 Market Size, By Region, 2020-2027 (USD Billion)
6.2 Others
6.2.1 Market Size, By Region, 2020-2027 (USD Billion)
Chapter 7 Global Quantum Computing in Energy Industry Market, By Offering
7.1 Quantum Computing Devices
7.1.1 Market Size, By Region, 2020-2027 (USD Billion)
7.2 Quantum Computing Software
7.2.1 Market Size, By Region, 2020-2027 (USD Billion)
7.3 Quantum Computing as a Service (QCaaS)
7.3.1 Market Size, By Region, 2020-2027 (USD Billion)
7.4 Quantum Computing Consulting Services
7.4.1 Market Size, By Region, 2020-2027 (USD Billion)
Chapter 8 Global Quantum Computing in Energy Industry Market, By Region
8.1 Regional outlook
8.2 North America
8.2.1 Market Size, By Country 2020-2027 (USD Billion)
8.2.2 Market Size, By Deployment Mode, 2020-2027 (USD Billion)
8.2.3 Market Size, By Offering, 2020-2027 (USD Billion)
8.2.4 Market Size, By End-User, 2020-2027 (USD Billion)
8.2.5 Market Size, By Application, 2020-2027 (USD Billion)
8.2.6 U.S.
8.2.6.1 Market Size, By Deployment Mode, 2020-2027 (USD Billion)
8.2.4.2 Market Size, By Offering, 2020-2027 (USD Billion)
8.2.4.3 Market Size, By End-User, 2020-2027 (USD Billion)
Market Size, By Application, 2020-2027 (USD Billion)
8.2.7 Canada
8.2.7.1 Market Size, By Deployment Mode, 2020-2027 (USD Billion)
8.2.7.2 Market Size, By Offering, 2020-2027 (USD Billion)
8.2.7.3 Market Size, By End-User, 2020-2027 (USD Billion)
8.2.7.4 Market Size, By Application, 2020-2027 (USD Billion)
8.3 Europe
8.3.1 Market Size, By Country 2020-2027 (USD Billion)
8.3.2 Market Size, By Deployment Mode, 2020-2027 (USD Billion)
8.3.3 Market Size, By Offering, 2020-2027 (USD Billion)
8.3.4 Market Size, By End-User, 2020-2027 (USD Billion)
8.3.5 Market Size, By Application, 2020-2027 (USD Billion)
8.3.6 Germany
8.3.6.1 Market Size, By Deployment Mode, 2020-2027 (USD Billion)
8.3.6.2 Market Size, By Offering, 2020-2027 (USD Billion)
8.3.6.3 Market Size, By End-User, 2020-2027 (USD Billion)
8.3.6.4 Market Size, By Application, 2020-2027 (USD Billion)
8.3.7 UK
8.3.7.1 Market Size, By Deployment Mode, 2020-2027 (USD Billion)
8.3.7.2 Market Size, By Offering, 2020-2027 (USD Billion)
8.3.7.3 Market Size, By End-User, 2020-2027 (USD Billion)
8.3.7.4 Market Size, By Application, 2020-2027 (USD Billion)
8.3.8 France
8.3.8.1 Market Size, By Deployment Mode, 2020-2027 (USD Billion)
8.3.8.2 Market Size, By Offering, 2020-2027 (USD Billion)
8.3.8.3 Market Size, By End-User, 2020-2027 (USD Billion)
8.3.8.4 Market Size, By Application, 2020-2027 (USD Billion)
8.3.9 Italy
8.3.9.1 Market Size, By Deployment Mode, 2020-2027 (USD Billion)
8.3.9.2 Market Size, By Offering, 2020-2027 (USD Billion)
8.3.9.3 Market Size, By End-User, 2020-2027 (USD Billion)
8.3.9.4 Market Size, By Application, 2020-2027 (USD Billion)
8.3.10 Spain
8.3.10.1 Market Size, By Deployment Mode, 2020-2027 (USD Billion)
8.3.10.2 Market Size, By Offering, 2020-2027 (USD Billion)
8.3.10.3 Market Size, By End-User, 2020-2027 (USD Billion)
8.3.10.4 Market Size, By Application, 2020-2027 (USD Billion)
8.3.11 Russia
8.3.11.1 Market Size, By Deployment Mode, 2020-2027 (USD Billion)
8.3.11.2 Market Size, By Offering, 2020-2027 (USD Billion)
8.3.11.3 Market Size, By End-User, 2020-2027 (USD Billion)
8.3.11.4 Market Size, By Application, 2020-2027 (USD Billion)
8.4 Asia Pacific
8.4.1 Market Size, By Country 2020-2027 (USD Billion)
8.4.2 Market Size, By Deployment Mode, 2020-2027 (USD Billion)
8.4.3 Market Size, By Offering, 2020-2027 (USD Billion)
8.4.4 Market Size, By End-User, 2020-2027 (USD Billion)
8.4.5 Market Size, By Application, 2020-2027 (USD Billion)
8.4.6 China
8.4.6.1 Market Size, By Deployment Mode, 2020-2027 (USD Billion)
8.4.6.2 Market Size, By Offering, 2020-2027 (USD Billion)
8.4.6.3 Market Size, By End-User, 2020-2027 (USD Billion)
8.4.6.4 Market Size, By Application, 2020-2027 (USD Billion)
8.4.7 India
8.4.7.1 Market Size, By Deployment Mode, 2020-2027 (USD Billion)
8.4.7.2 Market Size, By Offering, 2020-2027 (USD Billion)
8.4.7.3 Market Size, By End-User, 2020-2027 (USD Billion)
8.4.7.4 Market Size, By Application, 2020-2027 (USD Billion)
8.4.8 Japan
8.4.8.1 Market Size, By Deployment Mode, 2020-2027 (USD Billion)
8.4.8.2 Market Size, By Offering, 2020-2027 (USD Billion)
8.4.8.3 Market Size, By End-User, 2020-2027 (USD Billion)
8.4.8.4 Market Size, By Application, 2020-2027 (USD Billion)
8.4.9 Australia
8.4.9.1 Market Size, By Deployment Mode, 2020-2027 (USD Billion)
8.4.9.2 Market size, By Offering, 2020-2027 (USD Billion)
8.4.9.3 Market Size, By End-User, 2020-2027 (USD Billion)
8.4.9.4 Market Size, By Application, 2020-2027 (USD Billion)
8.4.10 South Korea
8.4.10.1 Market Size, By Deployment Mode, 2020-2027 (USD Billion)
8.4.10.2 Market Size, By Offering, 2020-2027 (USD Billion)
8.4.10.3 Market Size, By End-User, 2020-2027 (USD Billion)
8.4.10.4 Market Size, By Application, 2020-2027 (USD Billion)
8.5 Latin America
8.5.1 Market Size, By Country 2020-2027 (USD Billion)
8.5.2 Market Size, By Deployment Mode, 2020-2027 (USD Billion)
8.5.3 Market Size, By Offering, 2020-2027 (USD Billion)
8.5.4 Market Size, By End-User, 2020-2027 (USD Billion)
8.5.5 Market Size, By Application, 2020-2027 (USD Billion)
8.5.6 Brazil
8.5.6.1 Market Size, By Deployment Mode, 2020-2027 (USD Billion)
8.5.6.2 Market Size, By Offering, 2020-2027 (USD Billion)
8.5.6.3 Market Size, By End-User, 2020-2027 (USD Billion)
8.5.6.4 Market Size, By Application, 2020-2027 (USD Billion)
8.5.7 Mexico
8.5.7.1 Market Size, By Deployment Mode, 2020-2027 (USD Billion)
8.5.7.2 Market Size, By Offering, 2020-2027 (USD Billion)
8.5.7.3 Market Size, By End-User, 2020-2027 (USD Billion)
8.5.7.4 Market Size, By Application, 2020-2027 (USD Billion)
8.5.8 Argentina
8.5.8.1 Market Size, By Deployment Mode, 2020-2027 (USD Billion)
8.5.8.2 Market Size, By Offering, 2020-2027 (USD Billion)
8.5.8.3 Market Size, By End-User, 2020-2027 (USD Billion)
8.5.8.4 Market Size, By Application, 2020-2027 (USD Billion)
8.6 MEA
8.6.1 Market Size, By Country 2020-2027 (USD Billion)
8.6.2 Market Size, By Deployment Mode, 2020-2027 (USD Billion)
8.6.3 Market Size, By Offering, 2020-2027 (USD Billion)
8.6.4 Market Size, By End-User, 2020-2027 (USD Billion)
8.6.5 Market Size, By Application, 2020-2027 (USD Billion)
8.6.6 Saudi Arabia
8.6.6.1 Market Size, By Deployment Mode, 2020-2027 (USD Billion)
8.6.6.2 Market Size, By Offering, 2020-2027 (USD Billion)
8.6.6.3 Market Size, By End-User, 2020-2027 (USD Billion)
8.6.6.4 Market Size, By Application, 2020-2027 (USD Billion)
8.6.7 UAE
8.6.7.1 Market Size, By Deployment Mode, 2020-2027 (USD Billion)
8.6.7.2 Market Size, By Offering, 2020-2027 (USD Billion)
8.6.7.3 Market Size, By End-User, 2020-2027 (USD Billion)
8.6.7.4 Market Size, By Application, 2020-2027 (USD Billion)
8.6.8 South Africa
8.6.8.1 Market Size, By Deployment Mode, 2020-2027 (USD Billion)
8.6.8.2 Market Size, By Offering, 2020-2027 (USD Billion)
8.6.8.3 Market Size, By End-User, 2020-2027 (USD Billion)
8.6.8.4 Market Size, By Application, 2020-2027 (USD Billion)
Chapter 9 Company Landscape
9.1 Competitive Analysis, 2020
9.2 IBM
9.2.1 Company Overview
9.2.2 Financial Analysis
9.2.3 Strategic Positioning
9.2.4 Info Graphic Analysis
9.3 Microsoft
9.3.1 Company Overview
9.3.2 Financial Analysis
9.3.3 Strategic Positioning
9.3.4 Info Graphic Analysis
9.4 Google
9.4.1 Company Overview
9.4.2 Financial Analysis
9.4.3 Strategic Positioning
9.4.4 Info Graphic Analysis
9.5 Amazon Web Service
9.5.1 Company Overview
9.5.2 Financial Analysis
9.5.3 Strategic Positioning
9.5.4 Info Graphic Analysis
9.6 Intel
9.6.1 Company Overview
9.6.2 Financial Analysis
9.6.3 Strategic Positioning
9.6.4 Info Graphic Analysis
9.7 IonQ
9.7.1 Company Overview
9.7.2 Financial Analysis
9.7.3 Strategic Positioning
9.7.4 Info Graphic Analysis
9.8 Zapata Computing
9.8.1 Company Overview
9.8.2 Financial Analysis
9.8.3 Strategic Positioning
9.8.4 Info Graphic Analysis
9.9 Xanadu
9.9.1 Company Overview
9.9.2 Financial Analysis
9.9.3 Strategic Positioning
9.9.4 Info Graphic Analysis
9.10 Cambridge Quantum Computing
9.10.1 Company Overview
9.10.2 Financial Analysis
9.10.3 Strategic Positioning
9.10.4 Info Graphic Analysis
9.11 1Qbit, Qnami
9.11.1 Company Overview
9.11.2 Financial Analysis
9.11.3 Strategic Positioning
9.11.4 Info Graphic Analysis
9.12 Quantropi
9.12.1 Company Overview
9.12.2 Financial Analysis
9.12.3 Strategic Positioning
9.12.4 Info Graphic Analysis
The Global Quantum Computing In Energy Industry Market has been studied from the year 2019 till 2027. However, the CAGR provided in the report is from the year 2022 to 2027. The research methodology involved three stages: Desk research, Primary research, and Analysis & Output from the entire research process.

The desk research involved a robust background study which meant referring to paid and unpaid databases to understand the market dynamics; mapping contracts from press releases; identifying the key players in the market, studying their product portfolio, competition level, annual reports/SEC filings & investor presentations; and learning the demand and supply-side analysis for the Quantum Computing In Energy Industry Market.

The primary research activity included telephonic conversations with more than 50 tier 1 industry consultants, distributors, and end-use product manufacturers.

Finally, based on the above thorough research process, an in-depth analysis was carried out considering the following aspects: market attractiveness, current & future market trends, market share analysis, SWOT analysis of the company and customer analytics.

Frequently Asked Questions

This FREE sample includes market data points, ranging from trend analyses to market estimates & forecasts. See for yourself.
Or view our licence options:
Tailor made solutions just for you
80% of our clients seek made-to-order reports. How do you want us to tailor yours?
OUR CLIENTS


