This report was recently updated on August 31 2025 with the latest and most recent
market numbers
Global Recycled Materials for Mobility Applications Market Size, Trends & Analysis - Forecasts to 2028 By Material (Polymers, Composites, and Others), By Component (Exteriors, Interiors, and Others), By Application (OEMs and Aftermarket), By Vehicles (Passenger and Commercial), and By Region (North America, Asia Pacific, Central & South America, Europe, and Middle East and Africa), Competitive Landscape, Company Market Share Analysis, and End User Analysis
The global recycled materials for mobility applications market is expected to grow at a CAGR of 8.9% from 2023 to 2028. The global recycled materials for mobility applications market is witnessing growth due to the high demand for automobiles among the global populace. Thus, the increased demand for automobiles raises the need for construction materials. Introducing recycled materials is a boon for the market as it eliminates the need to create materials from scratch. Moreover, the recycled materials for mobility applications market is growing due to the rising demand for sustainable materials. The global recycled materials for mobility applications market was valued at USD 2.4 billion in 2022 and is expected to generate significant revenue over the forecast period from 2023-2028.
The primary aspect of the market is that the production of recycled materials uses a significantly lower amount of energy than the production of new materials. The production of new materials is very energy-consuming and requires much labour. This provides a sufficiently large market for recycled materials in mobility applications. For example, the energy saved from recycling materials from waste worth USD 7.1 trillion is enough to reduce the CO2 emissions of 360,000 cars. So, energy conservation incentive is an essential driver for the market.
However, producing new materials can hamper market growth, as these are often the components of high-end products. New materials are desirable in high-end products due to their unique composition, which is impossible in recycled plastics. Other restraints include the ban imposed by China on recycled plastics and the discovery of a new source of fossil fuel in the USA.
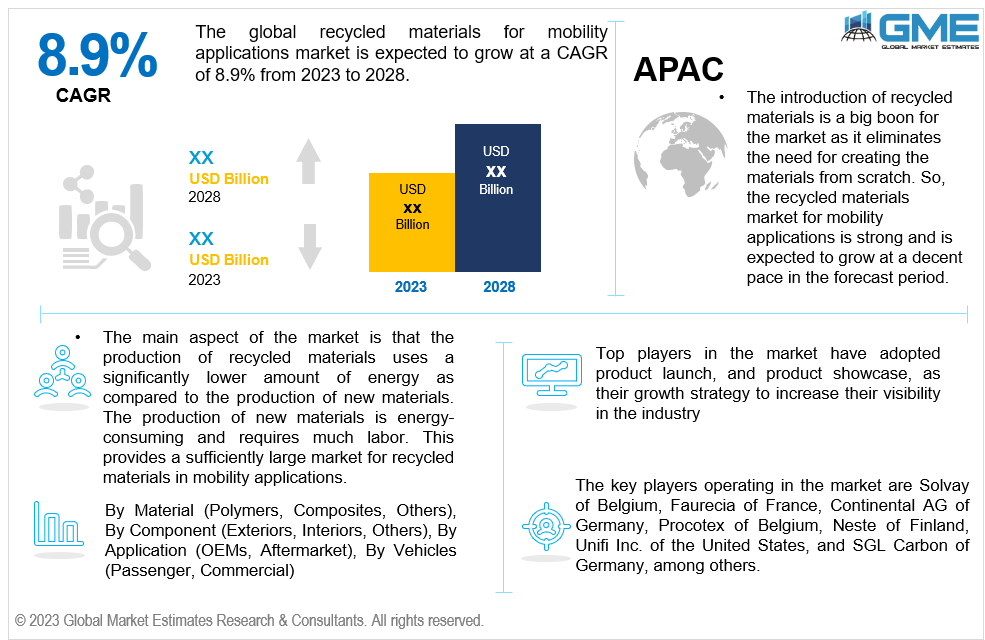
Based on material, the global recycled materials for mobility applications market is segmented into polymers, composites, and others. The polymers segment is expected to be the largest segment over the forecast period due to the rising demand for recycled polymers in the automobile sector. Plastic bottles and caps are the primary sources of the recycled plastic polymers used in automobiles. Several products utilize recycled polymers, including car textiles, splash guards, radiator shrouds, and dashboards.
On the basis of component, the market is segmented into exterior, interior, and others. The exterior components include external vehicle parts like bodies and chassis. The internal components include seats and other things made from recycled plastics and leather.
On the basis of application, the market is segmented into OEMs and aftermarket. The OEMs segment is expected to be the largest segment between 2023 and 2028. In OEM and aftermarket applications for the automobile industry, recycled materials are utilised. The primary use of recycled materials is in the OEMs sector. The manufacturers of vehicle parts are looking for more efficient and sustainable materials. OEMs frequently employ recycled composite and polymer materials in the automobile sector. Several OEMs have turned to recycled plastics to produce a more environmentally friendly version of the manufacturing-grade material.
Based on vehicles, the global recycled materials for mobility applications market is segmented into passenger vehicles and commercial vehicles. The passenger vehicles are utilized for personal purposes, thus not generating revenue for the owner. The commercial vehicles are used to generate income for their owners. This is also an important segment because the travel industry relies heavily on commercial vehicles. Moreover, the demand for vehicles increases with the rising population.
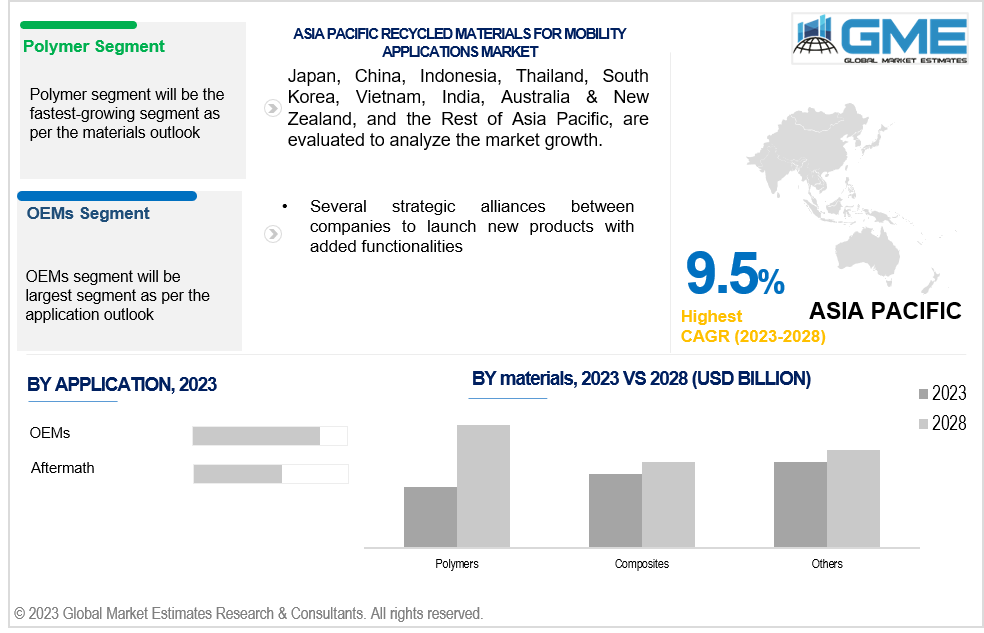
Asia Pacific is analyzed to be the largest region in the global recycled materials for mobility applications market. The regional market growth is attributed to the increasing number of emerging economies, accounting for around 30% of the world's GDP. Moreover, the region's rapidly growing population with increased demand for automobiles also fuels the need for recycled materials like polymers and composites. The low cost of labour in the region also contributes to the regional market growth.
Asia Pacific is also analyzed to be the fastest-growing region in the global recycled materials for mobility applications market over the forecast period, with a CAGR of over 9.5%. The demand for recycled materials for mobility applications is increasing to handle the regional transport shortage issue. The largest market in the Asia Pacific region is China, followed by India and Japan. Furthermore, Europe is expected to be the second-largest market during the forecast period.
Key companies operating in the market are Solvay of Belgium, Faurecia of France, Continental AG of Germany, Procotex of Belgium, Neste of Finland, Unifi Inc. of the United States, SGL Carbon of Germany, Celanese Corporation of the United States, Custom Polymers Inc. of the United States, Toray Industries Inc. of Japan, Carbon Fiber Recycling of the United States,. and Wellman Advanced Materials of United States.
Please note: This is not an exhaustive list of companies profiled in the report.
The global recycled materials for mobility applications market has observed several strategic alliances between companies to launch new products with added functionalities and maintain revenue share & profitability. Organic and inorganic growth strategies adopted by small players have been the highlight of this market.
For instance, Vartega Inc. and Aditya Birla signed a memorandum of understanding (MoU) to develop the recycling value chain for recyclamine based composites in 2021.
Moreover, Slovay announced a new production line for recycled and thermoplastic composite production in 2019.
1 STRATEGIC INSIGHTS ON NEW REVENUE POCKETS
1.1 Strategic Opportunity & Attractiveness Analysis
1.1.1 Hot Revenue Pockets
1.1.2 Market Attractiveness Score
1.1.3 Revenue Impacting Opportunity
1.1.4 High Growing Region/Country
1.1.5 Competitor Analysis
1.1.6 Consumer Analysis
1.2 Global Market Estimates' View
1.3 Strategic Insights across Business Functions
1.3.1 For Chief Executive Officers
1.3.2 For Chief Marketing Officers
1.3.3 For Chief Strategy Officers
1.4 Evaluate the Potential of your Existing Business Lines vs. New Lines to Enter Into
2 TECHNOLOGICAL TRENDS
2.1 Technological Adoption Rate
2.2 Current Trend Impact Analysis
2.3 Future Trend Impact Analysis
2.4 Data Metrics
3 GLOBAL MARKET OUTLOOK
3.1 Market Pyramid Analysis
3.1.1 Introduction
3.1.2 Adjacent Market Opportunities
3.1.3 Ancillary Market Opportunities
3.2 Demand Side Analysis
3.2.1 Market Drivers: Impact Analysis
3.2.2 Market Restraints: Impact Analysis
3.2.3 Market Opportunities: Impact Analysis
3.2.4 Market Challenges: Impact Analysis
3.3 Supply Side Analysis
3.3.1 Porter’s Five Forces Analysis
3.3.1.1 Threat of New Entrants
3.3.1.2 Threat of New Substitutes
3.3.1.3 Bargaining Power of Suppliers
3.3.1.4 Bargaining Power of Buyers
3.3.1.5 Intensity of Competitive Rivalry
3.3.2 SWOT Analysis; By Factor (Political & Legal, Economic, and Technological)
3.3.2.1 Political Landscape
3.3.2.2 Economic Landscape
3.3.2.3 Social Landscape
3.3.2.4 Technology Landscape
3.3.3 Value Chain Analysis
3.3.4 Trend Analysis
3.3.5 Gap Analysis
3.3.6 Cost Analysis
4 GLOBAL RECYCLED MATERIALS FOR MOBILITY APPLICATIONS MARKET, BY MATERIAL
4.1 Introduction
4.2 Recycled Materials for Mobility Applications Market: Material Scope Key Takeaways
4.3 Revenue Growth Analysis, 2022 & 2028
4.4 Polymer
4.4.1 Polymer Market Estimates and Forecast, 2020-2028 (USD Million)
4.5 Composites
4.5.1 Composites Market Estimates and Forecast, 2020-2028 (USD Million)
4.6 Others
4.6.1 Others Market Estimates and Forecast, 2020-2028 (USD Million)
5 GLOBAL RECYCLED MATERIALS FOR MOBILITY APPLICATIONS MARKET, BY COMPONENT
5.1 Introduction
5.2 Recycled Materials for Mobility Applications Market: Component Scope Key Takeaways
5.3 Revenue Growth Analysis, 2022 & 2028
5.4 Exterior Components
5.4.1 Exterior Components Market Estimates and Forecast, 2020-2028 (USD Million)
5.5 Interior Components
5.5.1 Interior Components Market Estimates and Forecast, 2020-2028 (USD Million)
5.6 Others
5.6.1 Others Market Estimates and Forecast, 2020-2028 (USD Million)
6 GLOBAL RECYCLED MATERIALS FOR MOBILITY APPLICATIONS MARKET, BY APPLICATION
6.1 Introduction
6.2 Recycled Materials for Mobility Applications Market: Application Scope Key Takeaways
6.3 Revenue Growth Analysis, 2022 & 2028
6.4 OEMs
6.4.1 OEMs Market Estimates and Forecast, 2020-2028 (USD Million)
6.5 Aftermath
6.5.1 Aftermath Market Estimates and Forecast, 2020-2028 (USD Million)
GLOBAL RECYCLED MATERIALS FOR MOBILITY APPLICATIONS MARKET, BY VEHICLE
7.1 Introduction
7.2 Recycled Materials for Mobility Applications Market: Vehicle Scope Key Takeaways
7.3 Revenue Growth Analysis, 2022 & 2028
7.4 Passenger Vehicles
7.4.1 Passenger Vehicles Market Estimates and Forecast, 2020-2028 (USD Million)
7.5 Commercial Vehicles
7.5.1 Commercial Vehicles Market Estimates and Forecast, 2020-2028 (USD Million)
8 GLOBAL RECYCLED MATERIALS FOR MOBILITY APPLICATIONS MARKET, BY REGION
8.1 Introduction
8.2 North America Recycled Materials for Mobility Applications Market Estimates and Forecast, 2020-2028 (USD Million)
8.2.1 By Material
8.2.2 By Component
8.2.3 By Application
8.2.4 By Vehicle
8.2.5 By Country
8.2.5.1 U.S. Recycled Materials for Mobility Applications Market Estimates and Forecast, 2020-2028 (USD Million)
8.2.5.1.1 By Material
8.2.5.1.2 By Component
8.2.5.1.3 By Application
8.2.5.1.4 By Vehicle
8.2.5.2 Canada Recycled Materials for Mobility Applications Market Estimates and Forecast, 2020-2028 (USD Million)
8.2.5.2.1 By Material
8.2.5.2.2 By Component
8.2.5.2.3 By Application
8.2.5.2.4 By Vehicle
8.2.5.3 Mexico Recycled Materials for Mobility Applications Market Estimates and Forecast, 2020-2028 (USD Million)
8.2.5.3.1 By Material
8.2.5.3.2 By Component
8.2.5.3.3 By Application
8.2.5.3.4 By Vehicle
8.3 Europe Recycled Materials for Mobility Applications Market Estimates and Forecast, 2020-2028 (USD Million)
8.3.1 By Material
8.3.2 By Component
8.3.3 By Application
8.3.4 By Vehicle
8.3.5 By Country
8.3.5.1 Germany Recycled Materials for Mobility Applications Market Estimates and Forecast, 2020-2028 (USD Million)
8.3.5.1.1 By Material
8.3.5.1.2 By Component
8.3.5.1.3 By Application
8.3.5.1.4 By Vehicle
8.3.5.2 U.K. Presered Flowers Market Estimates and Forecast, 2020-2028 (USD Million)
8.3.5.2.1 By Material
8.3.5.2.2 By Component
8.3.5.2.3 By Application
8.3.5.2.4 By Vehicle
8.3.5.3 France Recycled Materials for Mobility Applications Market Estimates and Forecast, 2020-2028 (USD Million)
8.3.5.3.1 By Material
8.3.5.3.2 By Component
8.3.5.3.3 By Application
8.3.5.3.4 By Vehicle
8.3.5.4 Italy Recycled Materials for Mobility Applications Market Estimates and Forecast, 2020-2028 (USD Million)
8.3.5.4.1 By Material
8.3.5.4.2 By Component
8.3.5.4.3 By Application
8.3.5.4.4 By Vehicle
8.3.5.5 Spain Recycled Materials for Mobility Applications Market Estimates and Forecast, 2020-2028 (USD Million)
8.3.5.5.1 By Material
8.3.5.5.2 By Component
8.3.5.5.3 By Application
8.3.5.5.4 By Vehicle
8.3.5.6 Netherlands Recycled Materials for Mobility Applications Market Estimates and Forecast, 2020-2028 (USD Million)
8.3.5.6.1 By Material
8.3.5.6.2 By Component
8.3.5.6.3 By Application
8.3.5.6.4 By Vehicle
8.3.5.7 Rest of Europe Recycled Materials for Mobility Applications Market Estimates and Forecast, 2020-2028 (USD Million)
8.3.5.7.1 By Material
8.3.5.7.2 By Component
8.3.5.7.3 By Application
8.3.5.7.4 By Vehicle
8.4 Asia Pacific Recycled Materials for Mobility Applications Market Estimates and Forecast, 2020-2028 (USD Million)
8.4.1 By Material
8.4.2 By Component
8.4.3 By Application
8.4.4 By Vehicle
8.4.5 By Country
8.4.5.1 China Recycled Materials for Mobility Applications Market Estimates and Forecast, 2020-2028 (USD Million)
8.4.5.1.1 By Material
8.4.5.1.2 By Component
8.4.5.1.3 By Application
8.4.5.1.4 By Vehicle
8.4.5.2 Japan Recycled Materials for Mobility Applications Market Estimates and Forecast, 2020-2028 (USD Million)
8.4.5.2.1 By Material
8.4.5.2.2 By Component
8.4.5.2.3 By Application
8.4.5.2.4 By Vehicle
8.4.5.3 India Recycled Materials for Mobility Applications Market Estimates and Forecast, 2020-2028 (USD Million)
8.4.5.3.1 By Material
8.4.5.3.2 By Component
8.4.5.3.3 By Application
8.4.5.3.4 By Vehicle
8.4.5.4 South Korea Recycled Materials for Mobility Applications Market Estimates and Forecast, 2020-2028 (USD Million)
8.4.5.4.1 By Material
8.4.5.4.2 By Component
8.4.5.4.3 By Application
8.4.5.4.4 By Vehicle
8.4.5.5 Singapore Recycled Materials for Mobility Applications Market Estimates and Forecast, 2020-2028 (USD Million)
8.4.5.5.1 By Material
8.4.5.5.2 By Component
8.4.5.5.3 By Application
8.4.5.5.4 By Vehicle
8.4.5.6 Malaysia Recycled Materials for Mobility Applications Market Estimates and Forecast, 2020-2028 (USD Million)
8.4.5.6.1 By Material
8.4.5.6.2 By Component
8.4.5.6.3 By Application
8.4.5.6.4 By Vehicle
8.4.5.7 Thailand Recycled Materials for Mobility Applications Market Estimates and Forecast, 2020-2028 (USD Million)
8.4.5.7.1 By Material
8.4.5.7.2 By Component
8.4.5.7.3 By Application
8.4.5.7.4 By Vehicle
8.4.5.8 Indonesia Recycled Materials for Mobility Applications Market Estimates and Forecast, 2020-2028 (USD Million)
8.4.5.8.1 By Material
8.4.5.8.2 By Component
8.4.5.8.3 By Application
8.4.5.8.4 By Vehicle
8.4.5.9 Vietnam Recycled Materials for Mobility Applications Market Estimates and Forecast, 2020-2028 (USD Million)
8.4.5.9.1 By Material
8.4.5.9.2 By Component
8.4.5.9.3 By Application
8.4.5.9.4 By Vehicle
8.4.5.10 Taiwan Recycled Materials for Mobility Applications Market Estimates and Forecast, 2020-2028 (USD Million)
8.4.5.10.1 By Material
8.4.5.10.2 By Component
8.4.5.10.3 By Application
8.4.5.10.4 By Vehicle
8.4.5.11 Rest of Asia Pacific Recycled Materials for Mobility Applications Market Estimates and Forecast, 2020-2028 (USD Million)
8.4.5.11.1 By Material
8.4.5.11.2 By Component
8.4.5.11.3 By Application
8.4.5.11.4 By Vehicle
8.5 Middle East and Africa Recycled Materials for Mobility Applications Market Estimates and Forecast, 2020-2028 (USD Million)
8.5.1 By Material
8.5.2 By Component
8.5.3 By Application
8.5.4 By Vehicle
8.5.5 By Country
8.5.5.1 Saudi Arabia Recycled Materials for Mobility Applications Market Estimates and Forecast, 2020-2028 (USD Million)
8.5.5.1.1 By Material
8.5.5.1.2 By Component
8.5.5.1.3 By Application
8.5.5.1.4 By Vehicle
8.5.5.2 U.A.E. Recycled Materials for Mobility Applications Market Estimates and Forecast, 2020-2028 (USD Million)
8.5.5.2.1 By Material
8.5.5.2.2 By Component
8.5.5.2.3 By Application
8.5.5.2.4 By Vehicle
8.5.5.3 Israel Recycled Materials for Mobility Applications Market Estimates and Forecast, 2020-2028 (USD Million)
8.5.4.3.1 By Material
8.5.4.3.2 By Component
8.5.4.3.3 By Application
8.5.5.3.4 By Vehicle
8.5.5.4 South Africa Recycled Materials for Mobility Applications Market Estimates and Forecast, 2020-2028 (USD Million)
8.5.5.4.1 By Material
8.5.5.4.2 By Component
8.5.5.4.3 By Application
8.5.5.4.4 By Vehicle
8.5.5.5 Rest of Middle East and Africa Recycled Materials for Mobility Applications Market Estimates and Forecast, 2020-2028 (USD Million)
8.5.5.5.1 By Material
8.5.5.5.2 By Component
8.5.5.5.2 By Application
8.5.5.5.4 By Vehicle
8.6 Central & South America Recycled Materials for Mobility Applications Market Estimates and Forecast, 2020-2028 (USD Million)
8.6.1 By Material
8.6.2 By Component
8.6.3 By Application
8.6.4 By Vehicle
8.6.5 By Country
8.6.5.1 Brazil Recycled Materials for Mobility Applications Market Estimates and Forecast, 2020-2028 (USD Million)
8.6.5.1.1 By Material
8.6.5.1.2 By Component
8.6.5.1.3 By Application
8.6.5.1.4 By Vehicle
8.6.5.2 Argentina Recycled Materials for Mobility Applications Market Estimates and Forecast, 2020-2028 (USD Million)
8.6.5.2.1 By Material
8.6.5.2.2 By Component
8.6.5.2.3 By Application
8.6.5.2.4 By Vehicle
8.6.5.3 Chile Recycled Materials for Mobility Applications Market Estimates and Forecast, 2020-2028 (USD Million)
8.6.5.3.1 By Material
8.6.5.3.2 By Component
8.6.5.3.3 By Application
8.6.5.5.4 By Vehicle
8.6.5.4 Rest of Central & South America Recycled Materials for Mobility Applications Market Estimates and Forecast, 2020-2028 (USD Million)
8.6.5.4.1 By Material
8.6.5.4.2 By Component
8.6.5.4.3 By Application
8.6.5.4.4 By Vehicle
9 COMPETITIVE LANDCAPE
9.1 Company Market Share Analysis
9.2 Four Quadrant Positioning Matrix
9.2.1 Market Leaders
9.2.2 Market Visionaries
9.2.3 Market Challengers
9.2.4 Niche Market Players
9.3 Vendor Landscape
9.3.1 North America
9.3.2 Europe
9.3.3 Asia Pacific
9.3.4 Rest of the World
9.4 Company Profiles
9.4.1 Solvay
9.4.1.1 Business Description & Financial Analysis
9.4.1.2 SWOT Analysis
9.4.1.3 Products & Services Offered
9.4.1.4 Strategic Alliances between Business Partners
9.4.2 Fauresia.
9.4.2.1 Business Description & Financial Analysis
9.4.2.2 SWOT Analysis
9.4.2.3 Products & Services Offered
9.4.2.4 Strategic Alliances between Business Partners
9.4.3 Continental AG
9.4.3.1 Business Description & Financial Analysis
9.4.3.2 SWOT Analysis
9.4.3.3 Products & Services Offered
9.4.3.4 Strategic Alliances between Business Partners
9.4.4 Prototex
9.4.4.1 Business Description & Financial Analysis
9.4.4.2 SWOT Analysis
9.4.4.3 Products & Services Offered
9.4.4.4 Strategic Alliances between Business Partners
9.4.5 Neste
9.4.5.1 Business Description & Financial Analysis
9.4.5.2 SWOT Analysis
9.4.5.3 Products & Services Offered
9.4.5.4 Strategic Alliances between Business Partners
9.4.6 UNIFI INC.
9.4.6.1 Business Description & Financial Analysis
9.4.6.2 SWOT Analysis
9.4.6.3 Products & Services Offered
9.4.6.4 Strategic Alliances between Business Partners
9.4.7 SGL Carbon
9.4.7.1 Business Description & Financial Analysis
9.4.7.2 SWOT Analysis
9.4.7.3 Products & Services Offered
9.4.8.4 Strategic Alliances between Business Partners
9.4.8 Celanese Corporation
9.4.8.1 Business Description & Financial Analysis
9.4.8.2 SWOT Analysis
9.4.8.3 Products & Services Offered
9.4.8.4 Strategic Alliances between Business Partners
9.4.9 Custom Polymers Inc.
9.4.9.1 Business Description & Financial Analysis
9.4.9.2 SWOT Analysis
9.4.9.3 Products & Services Offered
9.4.9.4 Strategic Alliances between Business Partners
9.4.10 Toray Industries
9.4.10.1 Business Description & Financial Analysis
9.4.10.2 SWOT Analysis
9.4.10.3 Products & Services Offered
9.4.10.4 Strategic Alliances between Business Partners
9.4.11 Carbon Fiber Recycling
9.4.11.1 Business Description & Financial Analysis
9.4.11.2 SWOT Analysis
9.4.11.3 Products & Services Offered
9.4.11.4 Strategic Alliances between Business Partners
9.4.12 Wellman Advanced Materials
9.4.12.1 Business Description & Financial Analysis
9.4.12.2 SWOT Analysis
9.4.12.3 Products & Services Offered
9.4.12.4 Strategic Alliances between Business Partners
9.4.13 Other Companies
9.4.13.1 Business Description & Financial Analysis
9.4.13.2 SWOT Analysis
9.4.13.3 Products & Services Offered
9.4.13.4 Strategic Alliances between Business Partners
10 RESEARCH METHODOLOGY
10.1 Market Introduction
10.1.1 Market Definition
10.1.2 Market Scope & SegCompositestation
10.2 Information ProcureCompositest
10.2.1 Secondary Research
10.2.1.1 Purchased Databases
10.2.1.2 GMEs Internal Data Repository
10.2.1.3 Secondary Resources & Third Party Perspectives
10.2.1.4 Company Information Sources
10.2.2 Primary Research
10.2.2.1 Various Types of Respondents for Primary Interviews
10.2.2.2 Number of Interviews Conducted throughout the Research Process
10.2.2.3 Primary Stakeholders
10.2.2.4 Discussion Guide for Primary Participants
10.2.3 Expert Panels
10.2.3.1 Expert Panels Across 30+ Industry
10.2.4 Paid Local Experts
10.2.4.1 Paid Local Experts Across 30+ Industry Across each Region
10.3 Market Estimation
10.3.1 Top-Down Approach
10.3.1.1 Macro-Economic Indicators Considered
10.3.1.2 Micro-Economic Indicators Considered
10.3.2 Bottom Up Approach
10.3.2.1 Company Share Analysis Approach
10.3.2.2 Estimation of Potential Product Sales
10.4 Data Triangulation
10.4.1 Data Collection
10.4.2 Time Series, Cross Sectional & Panel Data Analysis
10.4.3 Cluster Analysis
10.5 Analysis and Output
10.5.1 Inhouse AI Based Real Time Analytics Tool
10.5.2 Output From Desk & Primary Research
10.6 Research Assumptions & Limitations
10.7.1 Research Assumptions
10.7.2 Research Limitations
LIST OF TABLES
1 Global Recycled Materials for Mobility Applications Market, By Material, 2020-2028 (USD Mllion)
2 Polymer Market, By Region, 2020-2028 (USD Mllion)
3 Composites Market, By Region, 2020-2028 (USD Mllion)
4 Others Market, By Region, 2020-2028 (USD Mllion)
5 Global Recycled Materials for Mobility Applications Market, By Component, 2020-2028 (USD Mllion)
6 Exterior Components Market, By Region, 2020-2028 (USD Mllion)
7 Interior Components Market, By Region, 2020-2028 (USD Mllion)
8 Others Market, By Region, 2020-2028 (USD Mllion)
9 Global Recycled Materials for Mobility Applications Market, By Application, 2020-2028 (USD Mllion)
10 OEMs Market, By Region, 2020-2028 (USD Mllion)
11 Aftermath Market, By Region, 2020-2028 (USD Mllion)
12 Global Recycled Materials for Mobility Applications Market, By VEHICLE, 2020-2028 (USD Mllion)
13 Passenger Vehicles Market, By Region, 2020-2028 (USD Mllion)
14 Commercial Vehicles Market, By Region, 2020-2028 (USD Mllion)
15 Regional Analysis, 2020-2028 (USD Mllion)
16 North America Recycled Materials for Mobility Applications Market, By Material, 2020-2028 (USD Million)
17 North America Recycled Materials for Mobility Applications Market, By Component, 2020-2028 (USD Million)
18 North America Recycled Materials for Mobility Applications Market, By Application, 2020-2028 (USD Million)
19 North America Recycled Materials for Mobility Applications Market, By Vehicle, 2020-2028 (USD Million)
20 North America Recycled Materials for Mobility Applications Market, By Country, 2020-2028 (USD Million)
21 U.S Recycled Materials for Mobility Applications Market, By Material, 2020-2028 (USD Million)
22 U.S Recycled Materials for Mobility Applications Market, By Component, 2020-2028 (USD Million)
23 U.S Recycled Materials for Mobility Applications Market, By Application, 2020-2028 (USD Million)
24 U.S Recycled Materials for Mobility Applications Market, By Vehicle, 2020-2028 (USD Million)
25 Canada Recycled Materials for Mobility Applications Market, By Material, 2020-2028 (USD Million)
26 Canada Recycled Materials for Mobility Applications Market, By Component, 2020-2028 (USD Million)
27 Canada Recycled Materials for Mobility Applications Market, By Application, 2020-2028 (USD Million)
28 CANADA Recycled Materials for Mobility Applications Market, By Vehicle, 2020-2028 (USD Million)
29 Mexico Recycled Materials for Mobility Applications Market, By Material, 2020-2028 (USD Million)
30 Mexico Recycled Materials for Mobility Applications Market, By Component, 2020-2028 (USD Million)
31 Mexico Recycled Materials for Mobility Applications Market, By Application, 2020-2028 (USD Million)
32 mexico Recycled Materials for Mobility Applications Market, By Vehicle, 2020-2028 (USD Million)
33 Europe Recycled Materials for Mobility Applications Market, By Material, 2020-2028 (USD Million)
34 Europe Recycled Materials for Mobility Applications Market, By Component, 2020-2028 (USD Million)
35 Europe Recycled Materials for Mobility Applications Market, By Application, 2020-2028 (USD Million)
36 europe Recycled Materials for Mobility Applications Market, By Vehicle, 2020-2028 (USD Million)
37 Germany Recycled Materials for Mobility Applications Market, By Material, 2020-2028 (USD Million)
38 Germany Recycled Materials for Mobility Applications Market, By Component, 2020-2028 (USD Million)
39 Germany Recycled Materials for Mobility Applications Market, By Application, 2020-2028 (USD Million)
40 germany Recycled Materials for Mobility Applications Market, By Vehicle, 2020-2028 (USD Million)
41 UK Recycled Materials for Mobility Applications Market, By Material, 2020-2028 (USD Million)
42 UK Recycled Materials for Mobility Applications Market, By Component, 2020-2028 (USD Million)
43 UK Recycled Materials for Mobility Applications Market, By Application, 2020-2028 (USD Million)
44 U.kRecycled Materials for Mobility Applications Market, By Vehicle, 2020-2028 (USD Million)
45 France Recycled Materials for Mobility Applications Market, By Material, 2020-2028 (USD Million)
46 France Recycled Materials for Mobility Applications Market, By Component, 2020-2028 (USD Million)
47 France Recycled Materials for Mobility Applications Market, By Application, 2020-2028 (USD Million)
48 france Recycled Materials for Mobility Applications Market, By Vehicle, 2020-2028 (USD Million)
49 Italy Recycled Materials for Mobility Applications Market, By Material, 2020-2028 (USD Million)
50 Italy Recycled Materials for Mobility Applications Market, By T Component Type, 2020-2028 (USD Million)
51 Italy Recycled Materials for Mobility Applications Market, By Application, 2020-2028 (USD Million)
52 italy Recycled Materials for Mobility Applications Market, By Vehicle, 2020-2028 (USD Million)
53 Spain Recycled Materials for Mobility Applications Market, By Material, 2020-2028 (USD Million)
54 Spain Recycled Materials for Mobility Applications Market, By Component, 2020-2028 (USD Million)
55 Spain Recycled Materials for Mobility Applications Market, By Application, 2020-2028 (USD Million)
56 spain Recycled Materials for Mobility Applications Market, By Vehicle, 2020-2028 (USD Million)
57 Rest Of Europe Recycled Materials for Mobility Applications Market, By Material, 2020-2028 (USD Million)
58 Rest Of Europe Recycled Materials for Mobility Applications Market, By Component, 2020-2028 (USD Million)
59 Rest of Europe Recycled Materials for Mobility Applications Market, By Application, 2020-2028 (USD Million)
60 REST OF EUROPE Recycled Materials for Mobility Applications Market, By Vehicle, 2020-2028 (USD Million)
61 Asia Pacific Recycled Materials for Mobility Applications Market, By Material, 2020-2028 (USD Million)
62 Asia Pacific Recycled Materials for Mobility Applications Market, By Component, 2020-2028 (USD Million)
63 Asia Pacific Recycled Materials for Mobility Applications Market, By Application, 2020-2028 (USD Million)
64 asia Recycled Materials for Mobility Applications Market, By Vehicle, 2020-2028 (USD Million)
65 Asia Pacific Recycled Materials for Mobility Applications Market, By Country, 2020-2028 (USD Million)
66 China Recycled Materials for Mobility Applications Market, By Material, 2020-2028 (USD Million)
67 China Recycled Materials for Mobility Applications Market, By Component, 2020-2028 (USD Million)
68 China Recycled Materials for Mobility Applications Market, By Application, 2020-2028 (USD Million)
69 china Recycled Materials for Mobility Applications Market, By Vehicle, 2020-2028 (USD Million)
70 India Recycled Materials for Mobility Applications Market, By Material, 2020-2028 (USD Million)
71 India Recycled Materials for Mobility Applications Market, By Component, 2020-2028 (USD Million)
72 India Recycled Materials for Mobility Applications Market, By Application, 2020-2028 (USD Million)
73 india Recycled Materials for Mobility Applications Market, By Vehicle, 2020-2028 (USD Million)
74 Japan Recycled Materials for Mobility Applications Market, By Material, 2020-2028 (USD Million)
75 Japan Recycled Materials for Mobility Applications Market, By Component, 2020-2028 (USD Million)
76 Japan Recycled Materials for Mobility Applications Market, By Application, 2020-2028 (USD Million)
77 japan Recycled Materials for Mobility Applications Market, By Vehicle, 2020-2028 (USD Million)
78 South Korea Recycled Materials for Mobility Applications Market, By Material, 2020-2028 (USD Million)
79 South Korea Recycled Materials for Mobility Applications Market, By Component, 2020-2028 (USD Million)
80 South Korea Recycled Materials for Mobility Applications Market, By Application, 2020-2028 (USD Million)
81 south korea Recycled Materials for Mobility Applications Market, By Vehicle, 2020-2028 (USD Million)
82 Middle East and Africa Recycled Materials for Mobility Applications Market, By Material, 2020-2028 (USD Million)
83 Middle East and Africa Recycled Materials for Mobility Applications Market, By Component, 2020-2028 (USD Million)
84 Middle East and Africa Recycled Materials for Mobility Applications Market, By Application, 2020-2028 (USD Million)
85 MIDDLE EAST AND AFRICA Recycled Materials for Mobility Applications Market, By Vehicle, 2020-2028 (USD Million)
86 Middle East and Africa Recycled Materials for Mobility Applications Market, By Country, 2020-2028 (USD Million)
87 Saudi Arabia Recycled Materials for Mobility Applications Market, By Material, 2020-2028 (USD Million)
88 Saudi Arabia Recycled Materials for Mobility Applications Market, By Component, 2020-2028 (USD Million)
89 Saudi Arabia Recycled Materials for Mobility Applications Market, By Application, 2020-2028 (USD Million)
90 saudi arabia Recycled Materials for Mobility Applications Market, By Vehicle, 2020-2028 (USD Million)
91 UAE Recycled Materials for Mobility Applications Market, By Material, 2020-2028 (USD Million)
92 UAE Recycled Materials for Mobility Applications Market, By Component, 2020-2028 (USD Million)
93 UAE Recycled Materials for Mobility Applications Market, By Application, 2020-2028 (USD Million)
94 uae Recycled Materials for Mobility Applications Market, By Vehicle, 2020-2028 (USD Million)
95 Central & South America Recycled Materials for Mobility Applications Market, By Material, 2020-2028 (USD Million)
96 Central & South America Recycled Materials for Mobility Applications Market, By Component, 2020-2028 (USD Million)
97 Central & South America Recycled Materials for Mobility Applications Market, By Application, 2020-2028 (USD Million)
98 CENTRAL & SOUTH AMERICA Recycled Materials for Mobility Applications Market, By Vehicle, 2020-2028 (USD Million)
99 Central & South America Recycled Materials for Mobility Applications Market, By Country, 2020-2028 (USD Million)
100 Brazil Recycled Materials for Mobility Applications Market, By Material, 2020-2028 (USD Million)
101 Brazil Recycled Materials for Mobility Applications Market, By Component, 2020-2028 (USD Million)
102 Brazil Recycled Materials for Mobility Applications Market, By Application, 2020-2028 (USD Million)
103 brazil Recycled Materials for Mobility Applications Market, By Vehicle, 2020-2028 (USD Million)
104 Solvay: Products & Services Offering
105 Fauresia.: Products & Services Offering
106 Continental AG: Products & Services Offering
107 Prototex: Products & Services Offering
108 Neste: Products & Services Offering
109 UNIFI INC. : Products & Services Offering
110 SGL Carbon : Products & Services Offering
111 Celanese Corporation: Products & Services Offering
112 Custom Polymers Inc., Inc: Products & Services Offering
113 Toray Industries: Products & Services Offering
114 Carbon Fiber Recycling: Products & Services Offering
115 Wellman Advanced Materials: Products & Services Offering
116 Other Companies: Products & Services Offering
LIST OF FIGURES
1 Global Recycled Materials for Mobility Applications Market Overview
2 Global Recycled Materials for Mobility Applications Market Value From 2020-2028 (USD Mllion)
3 Global Recycled Materials for Mobility Applications Market Share, By Material (2022)
4 Global Recycled Materials for Mobility Applications Market Share, By Component (2022)
5 Global Recycled Materials for Mobility Applications Market Share, By Application (2022)
6 Global Recycled Materials for Mobility Applications Market Share, By Vehicle (2022)
7 Global Recycled Materials for Mobility Applications Market, By Region (Asia Pacific Market)
8 Technological Trends In Global Recycled Materials for Mobility Applications Market
9 Four Quadrant Competitor Positioning Matrix
10 Impact Of Macro & Micro Indicators On The Market
11 Impact Of Key Drivers On The Global Recycled Materials for Mobility Applications Market
12 Impact Of Challenges On The Global Recycled Materials for Mobility Applications Market
13 Porter’s Five Forces Analysis
14 Global Recycled Materials for Mobility Applications Market: By Material Scope Key Takeaways
15 Global Recycled Materials for Mobility Applications Market, By Material Segment: Revenue Growth Analysis
16 Polymer Market, By Region, 2020-2028 (USD Mllion)
17 Composites Market, By Region, 2020-2028 (USD Mllion)
18 Others Market, By Region, 2020-2028 (USD Mllion)
19 Global Recycled Materials for Mobility Applications Market: By Component Scope Key Takeaways
20 Global Recycled Materials for Mobility Applications Market, By Component Segment: Revenue Growth Analysis
21 Exterior Components Market, By Region, 2020-2028 (USD Mllion)
22 Interior Components Market, By Region, 2020-2028 (USD Mllion)
23 Others Market, By Region, 2020-2028 (USD Mllion)
24 Global Recycled Materials for Mobility Applications Market: By Application Scope Key Takeaways
25 Global Recycled Materials for Mobility Applications Market, By Application Segment: Revenue Growth Analysis
26 OEMs Market, By Region, 2020-2028 (USD Mllion)
27 Aftermath Market, By Region, 2020-2028 (USD Mllion)
28 Global Recycled Materials for Mobility Applications Market: By Vehicle Scope Key Takeaways
29 Global Recycled Materials for Mobility Applications Market, By Vehicle Segment: Revenue Growth Analysis
30 Passenger Vehicles Market, By Region, 2020-2028 (USD Mllion)
31 Commercial Vehicles Market, By Region, 2020-2028 (USD Mllion)
32 Regional Segment: Revenue Growth Analysis
33 Global Recycled Materials for Mobility Applications Market: Regional Analysis
34 North America Recycled Materials for Mobility Applications Market Overview
35 North America Recycled Materials for Mobility Applications Market, By Material
36 North America Recycled Materials for Mobility Applications Market, By Component
37 North America Recycled Materials for Mobility Applications Market, By Application
38 North America Recycled Materials for Mobility Applications Market, By Vehicle
39 North America Recycled Materials for Mobility Applications Market, By Country
40 U.S. Recycled Materials for Mobility Applications Market, By Material
41 U.S. Recycled Materials for Mobility Applications Market, By Component
42 U.S. Recycled Materials for Mobility Applications Market, By Application
43 U.S. Recycled Materials for Mobility Applications Market, By Vehicle
44 Canada Recycled Materials for Mobility Applications Market, By Material
45 Canada Recycled Materials for Mobility Applications Market, By Component
46 Canada Recycled Materials for Mobility Applications Market, By Application
47 Canada Recycled Materials for Mobility Applications Market, By Vehicle
48 Mexico Recycled Materials for Mobility Applications Market, By Material
49 Mexico Recycled Materials for Mobility Applications Market, By Component
50 Mexico Recycled Materials for Mobility Applications Market, By Application
51 Mexico Recycled Materials for Mobility Applications Market, By Vehicle
52 Four Quadrant Positioning Matrix
53 Company Market Share Analysis
54 Solvay: Company Snapshot
55 Solvay: SWOT Analysis
56 Solvay: Geographic Presence
57 Fauresia.: Company Snapshot
58 Fauresia.: SWOT Analysis
59 Fauresia.: Geographic Presence
60 Continental AG: Company Snapshot
61 Continental AG: SWOT Analysis
62 Continental AG: Geographic Presence
63 Prototex: Company Snapshot
64 Prototex: Swot Analysis
65 Prototex: Geographic Presence
66 Neste: Company Snapshot
67 Neste: SWOT Analysis
68 Neste: Geographic Presence
69 UNIFI INC. : Company Snapshot
70 UNIFI INC. : SWOT Analysis
71 UNIFI INC. : Geographic Presence
72 SGL Carbon : Company Snapshot
73 SGL Carbon : SWOT Analysis
74 SGL Carbon : Geographic Presence
75 Celanese Corporation: Company Snapshot
76 Celanese Corporation: SWOT Analysis
77 Celanese Corporation: Geographic Presence
78 Custom Polymers Inc., Inc.: Company Snapshot
79 Custom Polymers Inc., Inc.: SWOT Analysis
80 Custom Polymers Inc., Inc.: Geographic Presence
81 Toray Industries: Company Snapshot
82 Toray Industries: SWOT Analysis
83 Toray Industries: Geographic Presence
84 Carbon Fiber Recycling: Company Snapshot
85 Carbon Fiber Recycling: SWOT Analysis
86 Carbon Fiber Recycling: Geographic Presence
87 Wellman Advanced Materials: Company Snapshot
88 Wellman Advanced Materials: SWOT Analysis
89 Wellman Advanced Materials: Geographic Presence
90 Other Companies: Company Snapshot
91 Other Companies: SWOT Analysis
92 Other Companies: Geographic Presence
The Global Recycled Materials for Mobility Applications Market has been studied from the year 2019 till 2028. However, the CAGR provided in the report is from the year 2023 to 2028. The research methodology involved three stages: Desk research, Primary research, and Analysis & Output from the entire research process.

The desk research involved a robust background study which meant referring to paid and unpaid databases to understand the market dynamics; mapping contracts from press releases; identifying the key players in the market, studying their product portfolio, competition level, annual reports/SEC filings & investor presentations; and learning the demand and supply-side analysis for the Recycled Materials for Mobility Applications Market.

The primary research activity included telephonic conversations with more than 50 tier 1 industry consultants, distributors, and end-use product manufacturers.

Finally, based on the above thorough research process, an in-depth analysis was carried out considering the following aspects: market attractiveness, current & future market trends, market share analysis, SWOT analysis of the company and customer analytics.

Frequently Asked Questions

This FREE sample includes market data points, ranging from trend analyses to market estimates & forecasts. See for yourself.
Or view our licence options:
Tailor made solutions just for you
80% of our clients seek made-to-order reports. How do you want us to tailor yours?
OUR CLIENTS


