This report was recently updated on August 10 2025 with the latest and most recent
market numbers
Global Reverse Logistics Market Size, Trends & Analysis - Forecasts to 2028 By Return Type (Recall Returns, B2B Returns and Commercial Returns, Repairable Returns, End of Use Returns, and End of Life Returns), By Service (Transportation, Warehousing, Reselling, Replacement Management, Refund Management, and Others), By End User Industry (Retail & E-commerce, Automotive, Consumer Electronics, Healthcare, and Others), and By Region (North America, Asia Pacific, Central and South America, Europe, and Middle East and Africa), Competitive Landscape, Company Market Share Analysis, and End User Analysis
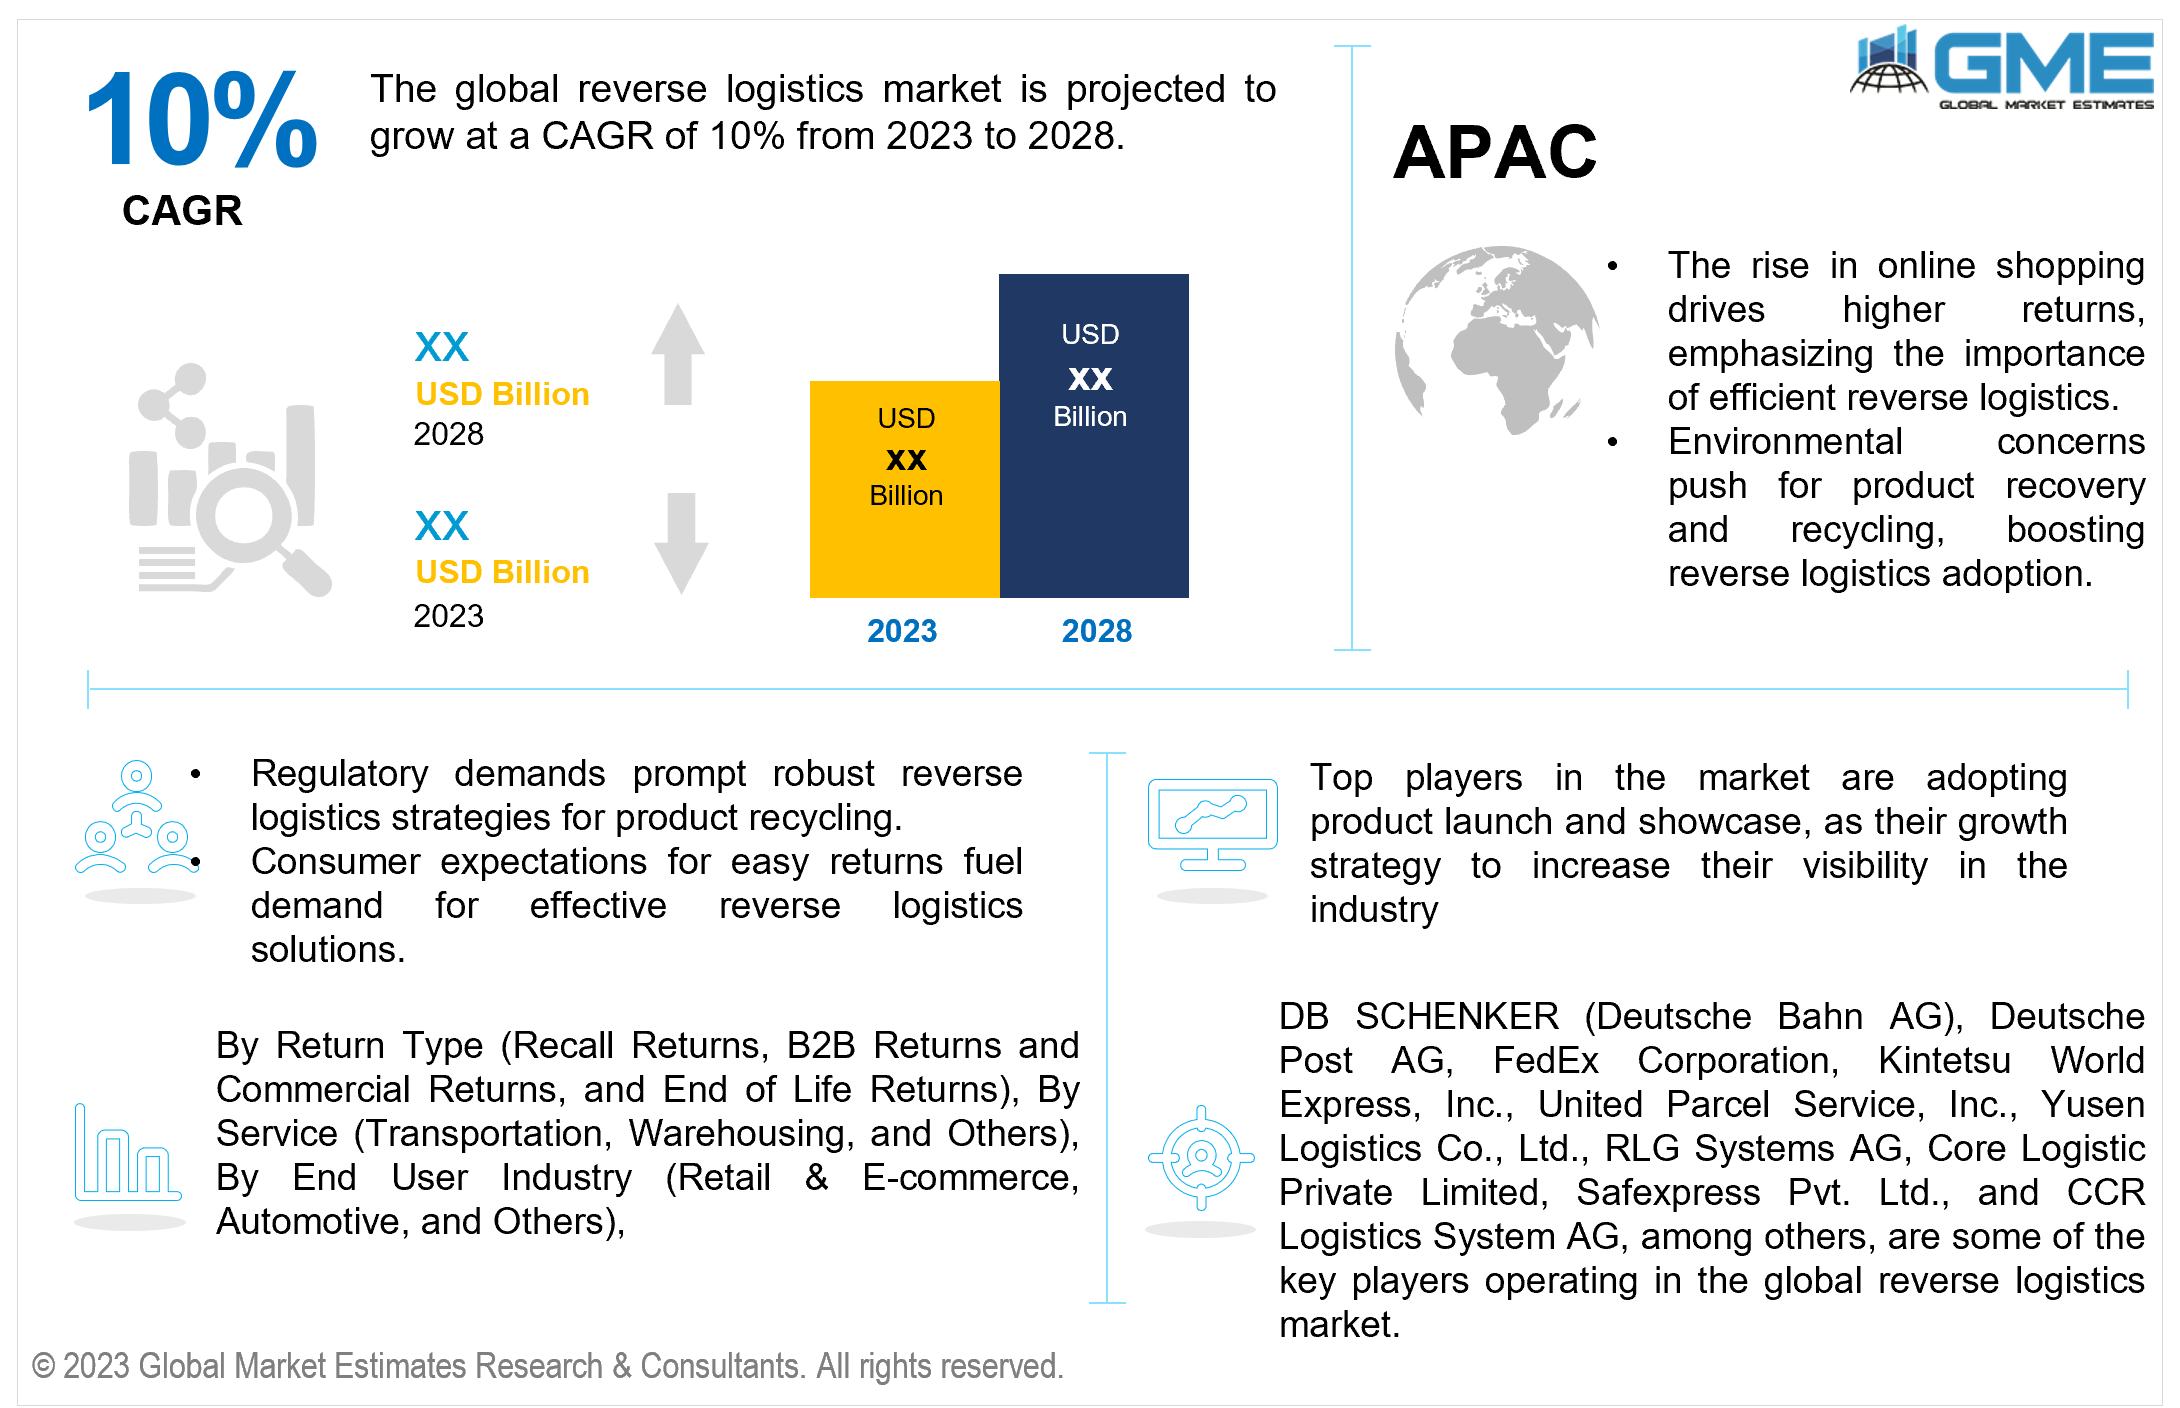
The global reverse logistics market is projected to grow at a CAGR of 10% from 2023 to 2028.
Reverse logistics plays a crucial role within various sectors such as automotive, pharmaceuticals, electronics, and more, as an essential component of their supply chain operations. The surge in online shopping generates a higher volume of returns, necessitating efficient reverse logistics processes. According to National Retail Federation, in 2021, online sales constituted around 23% of the total retail online sales of approximately USD 4.583 trillion in the U.S. Furthermore, the challenge of unwanted purchases and the return of items to retailers' physical locations and warehouses is causing significant concerns for businesses, resulting in financial losses.
Strategic alliances between manufacturers, retailers, and logistics providers improve reverse logistics capabilities. In January 2022, FedEx introduced a logistics-as-a-service offering in partnership with Microsoft. The launch's primary goal was to improve FedEx's logistical capabilities. initiative aimed to foster logistic innovation in tandem with the advancements in technology's evolution.
Manufacturers and retailers rely completely on logistics providers for reliability, expertise, and trust. This setup leaves them without direct control and oversight, posing risks like compromised product quality and confidentiality breaches. As a result, it is anticipated that the lack of control over reverse logistics will limit the development of this sector.
B2B returns and commercial returns segment is expected to hold the largest share in the market. This is a result of an increased emphasis on environmental awareness and sustainability. As businesses gain greater consciousness of the environmental repercussions of their activities, they are striving to minimize waste and adopt practices that are environmentally friendly. For example, Nike is investing in products that enables breakthroughs in recycled and recyclable materials, new machines and methods of make, and new recycling technologies. Products like the Alpha Fly Next Nature and Mercurial Next Nature are expanding capabilities scale more sustainable innovations throughout product lines.
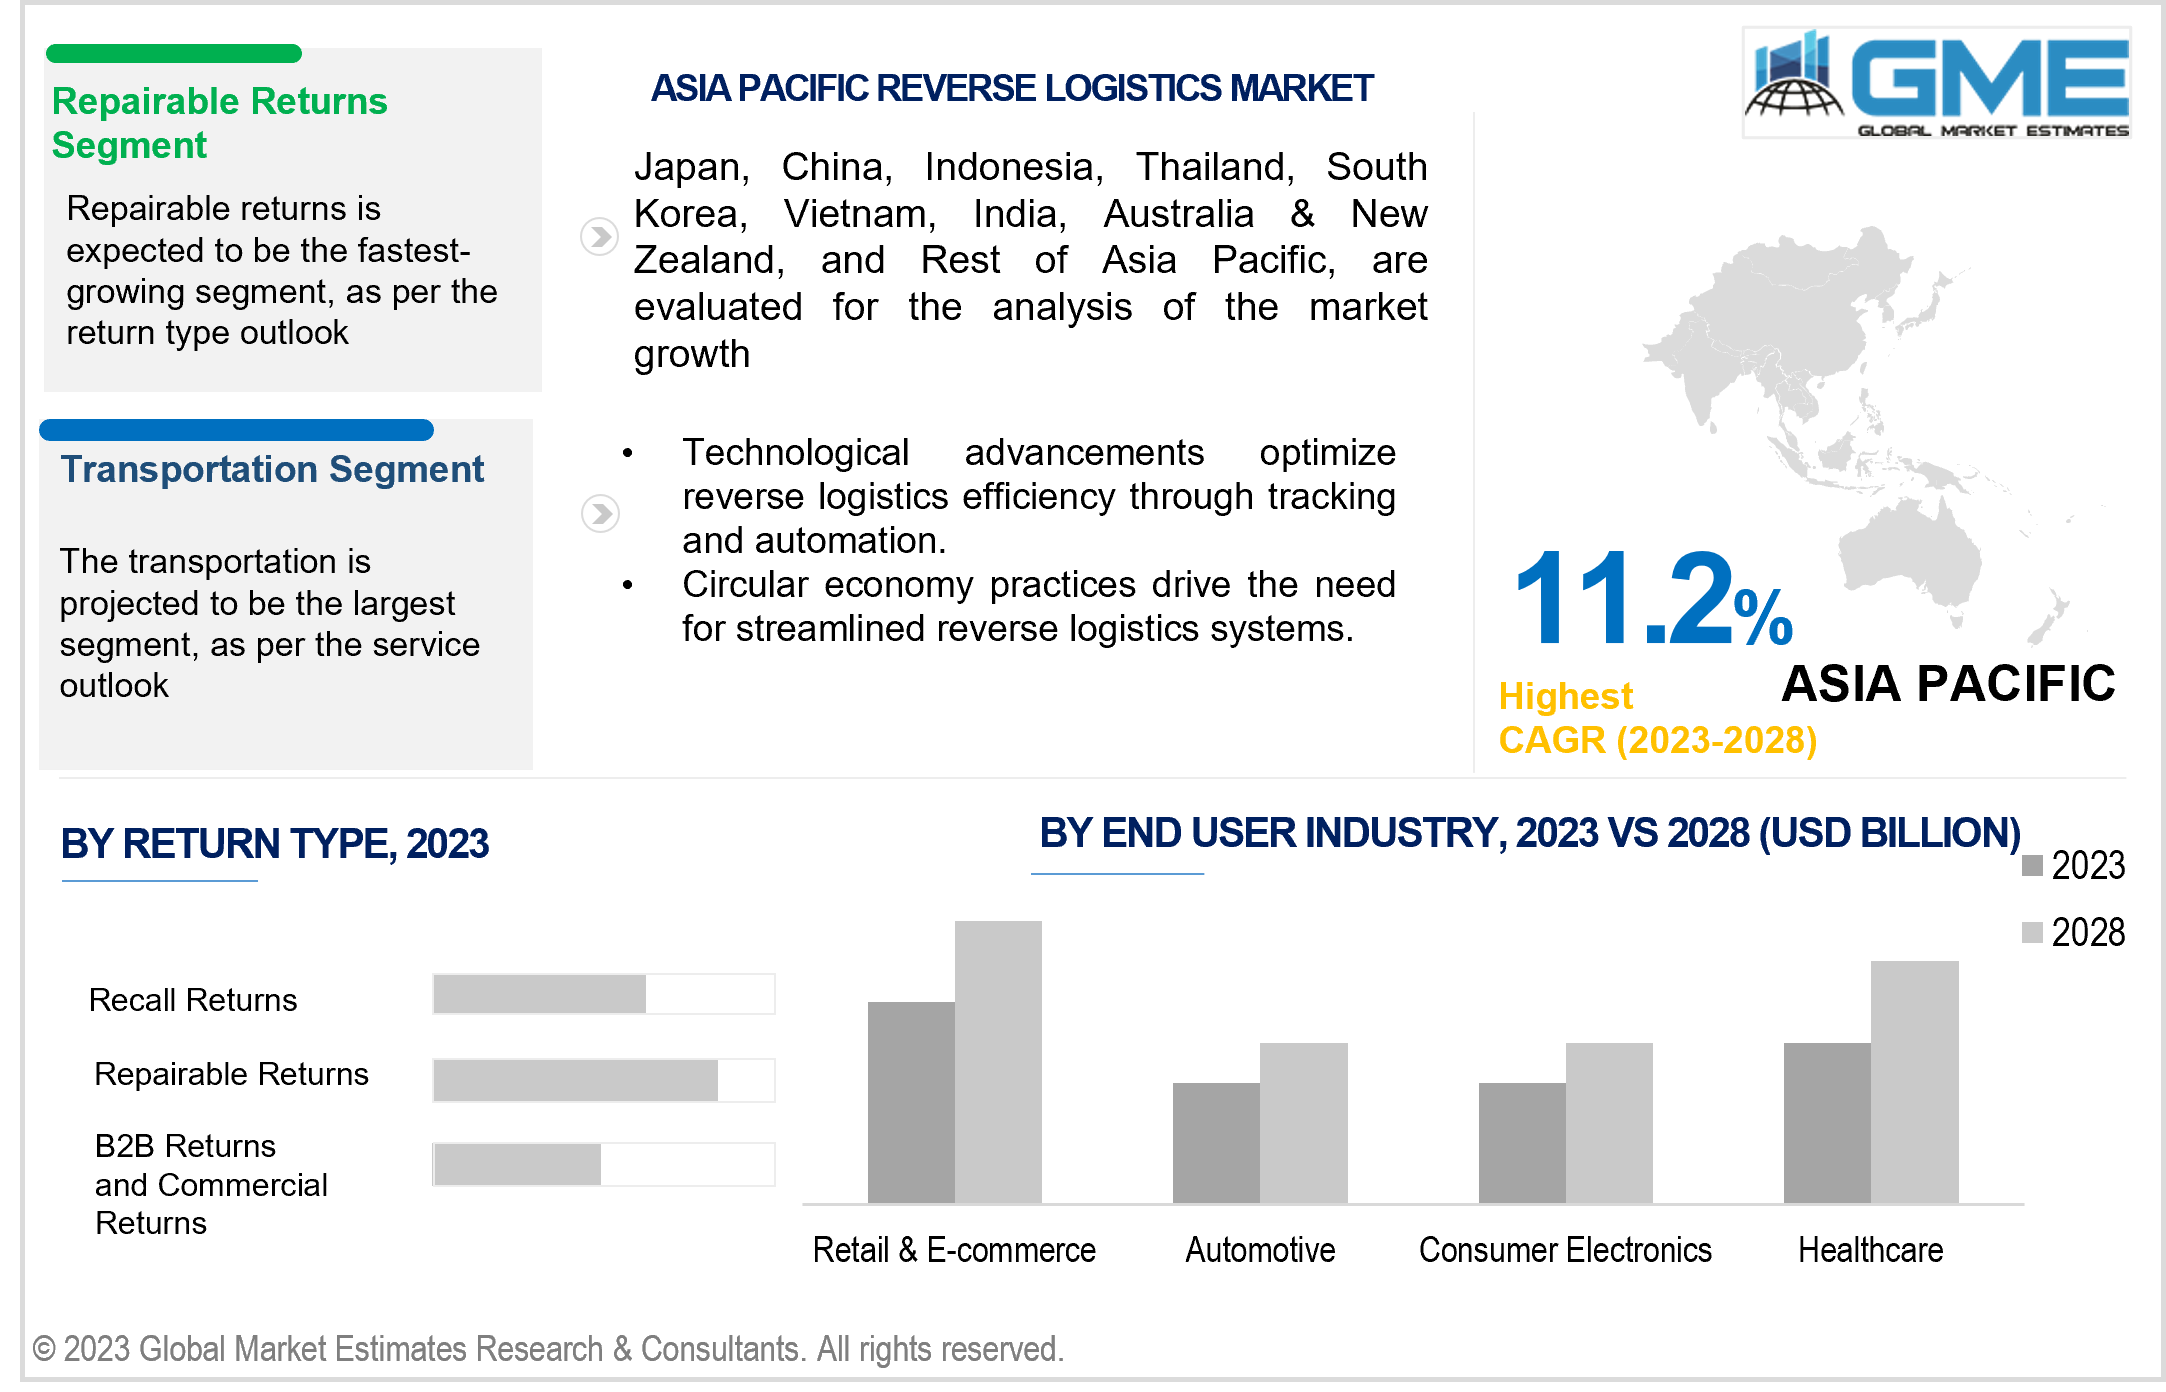
Repairable returns segment is expected to be the fastest-growing segment in the market from 2023-2028. The expansion of global market reach for businesses has been facilitated by the increase in both domestic and international connectivity. Comparable to transportation systems on land, sea, and air, connectivity options provide swift and adaptable distribution and return services. The prevalent incorporation of digital devices into people's everyday routines worldwide is propelling the need for prompt repair and refurbishment services for products delivered with defects, damages, or other issues.
Transportation segment is expected to hold the largest share of the market. The growth of online shopping and e-commerce has resulted in a notable increase in the quantity of products being returned. Hence, businesses necessitate dependable transportation solutions to streamline the transfer of these goods from customers back to sellers or manufacturers. The transportation service sector holds significant importance in guaranteeing the efficient gathering, categorization, and conveyance of returned products to appropriate destinations for further handling. For example, May 2021, the Brazilian government revealed intentions to invest USD50 billion for enhancing airports, ports, highways, and railways. These infrastructure upgrades will facilitate smoother operations for reverse logistics enterprises.
Warehousing is anticipated to be the fastest-growing segment in the market from 2023-2028. While warehouses have always held importance in reverse logistics, their necessity has seen a rapid increase due to the growth of the circular economy. Alongside the conventional handling and return of surplus items from online orders, warehouses now need to engage in a broader array of value-added activities.
Retail & E-commerce segment holds the largest share of the market. The surge in online shopping has given customers the convenience of buying items from a distance. Nevertheless, this shift has contributed to a greater number of product returns. Consequently, retailers and e-commerce enterprises need strong reverse logistics systems to smoothly manage the increased flow of returned goods. This demand has spurred the development of specialized reverse logistics procedures within the retail and e-commerce domains.
The automotive segment is anticipated to be the fastest-growing segment in the market from 2023-2028. The automotive industry increasingly focuses on remanufacturing and refurbishing automotive components to reduce waste and extend product life. Efficient reverse logistics contribute to cost control by reducing waste, optimizing transportation, and maximizing product recovery. For example, in May 2021, MG Motor India announced partnership with Attero with the objective of recycling batteries sourced from electric vehicles. In this partnership, Attero will furnish MG Motor India with services encompassing reverse logistics, rejuvenation, and recycling of these batteries. Car manufacturers are embracing reverse logistics to diminish electronic waste and uphold passenger safety.
North America is expected to be the largest region in the market. Reverse logistics firms are planning investments in modern warehouse facilities to enhance the efficiency of the reverse logistics process in this area, thus propelling the industry's growth. For instance, in 2018 FedEx has introduced the FedEx Returns Technology, aimed at assisting vendors with streamlined return processing, offering customers easy access and transparency throughout the process. Implementing effective return management procedures benefits both consumers and sellers, contributing to the advancement of the reverse logistics sector in North America.
Asia Pacific is predicted to witness rapid growth during the forecast period. This growth is mainly a result of the increasing inclination towards fashionable attire among the younger generation. Additionally, the region's growth can also be attributed to the rapid expansion of the e-commerce sector, especially in nations like India and China.
DB SCHENKER (Deutsche Bahn AG), Deutsche Post AG, FedEx Corporation, Kintetsu World Express, Inc., United Parcel Service, Inc., Yusen Logistics Co., Ltd., RLG Systems AG, Core Logistic Private Limited, Safexpress Pvt. Ltd., and CCR Logistics System AG, among others, are some of the key players operating in the global reverse logistics market.
Please note: This is not an exhaustive list of companies profiled in the report.
In March 2022, Deutsche Post DHL partnered with ReverseLogix, a company offering comprehensive returns management systems (RMS) for both B2C and B2B entities. This partnership introduces an end-to-end, purpose-built returns management system (RMS) that streamlines the entire returns process, integrating request handling, logistics, inventory, and processing within an adaptable SaaS platform. By utilizing ReverseLogix's comprehensive functionality for returns and exchanges, DHL Supply Chain can tailor its services to cater to individual customer needs.
In December 2022, FedEx Corp announced the upcoming launch of FedEx Consolidated Returns in the U.S., a cost-effective solution designed to simplify e-commerce returns for merchants and customers alike.
1 STRATEGIC INSIGHTS ON NEW REVENUE POCKETS
1.1 Strategic Opportunity & Attractiveness Analysis
1.1.1 Hot Revenue Pockets
1.1.2 Market Attractiveness Score
1.1.3 Revenue Impacting Opportunity
1.1.4 High Growing Region/Country
1.1.5 Competitor Analysis
1.1.6 Consumer Analysis
1.2 Global Market Estimates' View
1.3 Strategic Insights across Business Functions
1.3.1 For Chief Executive Officers
1.3.2 For Chief Marketing Officers
1.3.3 For Chief Strategy Officers
1.4 Evaluate the Potential of your Existing Business Lines vs. New Lines to Enter Into
2 TECHNOLOGICAL TRENDS
2.1 Technological Adoption Rate
2.2 Current Trend Impact Analysis
2.3 Future Trend Impact Analysis
2.4 Data Metrics
3 GLOBAL REVERSE LOGISTICS MARKET OUTLOOK
3.1 Market Pyramid Analysis
3.1.1 Introduction
3.1.2 Adjacent Market Opportunities
3.1.3 Ancillary Market Opportunities
3.2 Demand Side Analysis
3.2.1 Market Drivers: Impact Analysis
3.2.2 Market Restraints: Impact Analysis
3.2.3 Market Opportunities: Impact Analysis
3.2.4 Market Challenges: Impact Analysis
3.3 Supply Side Analysis
3.3.1 Porter’s Five Forces Analysis
3.3.1.1 Threat of New Entrants
3.3.1.2 Threat of New Substitutes
3.3.1.3 Bargaining Power of Suppliers
3.3.1.4 Bargaining Power of Buyers
3.3.1.5 Intensity of Competitive Rivalry
3.3.2 SWOT Analysis; By Factor (Political & Legal, Economic, and Technological)
3.3.2.1 Political Landscape
3.3.2.2 Economic Landscape
3.3.2.3 Social Landscape
3.3.2.4 Technology Landscape
3.3.3 Value Chain Analysis
3.3.4 Trend Analysis
3.3.5 Gap Analysis
3.3.6 Cost Analysis
4 GLOBAL REVERSE LOGISTICS MARKET, BY RETURN TYPE
4.1 Introduction
4.2 Reverse Logistics Market: Return Type Scope Key Takeaways
4.3 Revenue Growth Analysis, 2022 & 2028
4.4 Recall Returns
4.4.1 Recall Returns Market Estimates and Forecast, 2020-2028 (USD Million)
4.5 B2B Returns and Commercial Returns
4.5.1 B2B Returns and Commercial Returns Market Estimates and Forecast, 2020-2028 (USD Million)
4.6 Repairable Returns
4.6.1 Repairable Returns Market Estimates and Forecast, 2020-2028 (USD Million)
4.7 End of Use Returns
4.7.1 End of Use Returns Market Estimates and Forecast, 2020-2028 (USD Million)
4.8 End of Life Returns
4.8.1 End of Life Returns Market Estimates and Forecast, 2020-2028 (USD Million)
5 GLOBAL REVERSE LOGISTICS MARKET, BY SERVICE
5.1 Introduction
5.2 Reverse Logistics Market: Service Scope Key Takeaways
5.3 Revenue Growth Analysis, 2022 & 2028
5.4 Transportation
5.4.1 Transportation Market Estimates and Forecast, 2020-2028 (USD Million)
5.5 Warehousing
5.5.1 Warehousing Market Estimates and Forecast, 2020-2028 (USD Million)
5.6 Reselling
5.6.1 Reselling Market Estimates and Forecast, 2020-2028 (USD Million)
5.7 Refund Management
5.7.1 Refund Management Market Estimates and Forecast, 2020-2028 (USD Million)
5.8 Replacement Management
5.8.1 Replacement ManagementMarket Estimates and Forecast, 2020-2028 (USD Million)
5.9 Others
5.9.1 Others Market Estimates and Forecast, 2020-2028 (USD Million)
6 GLOBAL REVERSE LOGISTICS MARKET, BY END USER INDUSTRY
6.1 Introduction
6.2 Reverse Logistics Market: End User industry Scope Key Takeaways
6.3 Revenue Growth Analysis, 2022 & 2028
6.4 Retail & E-commerce
6.4.1 Retail & E-commerce Market Estimates and Forecast, 2020-2028 (USD Million)
6.5 Automotive
6.5.1 Automotive Market Estimates and Forecast, 2020-2028 (USD Million)
6.6 Consumer Electronics
6.6.1 Consumer Electronics Market Estimates and Forecast, 2020-2028 (USD Million)
6.7 Healthcare
6.7.1 Healthcare Market Estimates and Forecast, 2020-2028 (USD Million)
6.8 Others
6.8.1 Others Market Estimates and Forecast, 2020-2028 (USD Million)
7 GLOBAL REVERSE LOGISTICS MARKET, BY REGION
7.1 Introduction
7.2 North America Reverse Logistics Market Estimates and Forecast, 2020-2028 (USD Million)
7.2.1 By Return Type
7.2.2 By Service
7.2.3 By End User Industry
7.2.4 By Country
7.2.4.1 U.S. Reverse Logistics Market Estimates and Forecast, 2020-2028 (USD Million)
7.2.4.1.1 By Return Type
7.2.4.1.2 By Service
7.2.4.1.3 By End User Industry
7.2.4.2 Canada Reverse Logistics Market Estimates and Forecast, 2020-2028 (USD Million)
7.2.4.2.1 By Return Type
7.2.4.2.2 By Service
7.2.4.2.3 By End User Industry
7.2.4.3 Mexico Reverse Logistics Market Estimates and Forecast, 2020-2028 (USD Million)
7.2.4.3.1 By Return Type
7.2.4.3.2 By Service
7.2.4.3.3 By End User Industry
7.3 Europe Reverse Logistics Market Estimates and Forecast, 2020-2028 (USD Million)
7.3.1 By Return Type
7.3.2 By Service
7.3.3 By End User Industry
7.3.4 By Country
7.3.4.1 Germany Reverse Logistics Market Estimates and Forecast, 2020-2028 (USD Million)
7.3.4.1.1 By Return Type
7.3.4.1.2 By Service
7.3.4.1.3 By End User Industry
7.3.4.2 U.K. Reverse Logistics Market Estimates and Forecast, 2020-2028 (USD Million)
7.3.4.2.1 By Return Type
7.3.4.2.2 By Service
7.3.4.2.3 By End User Industry
7.3.4.3 France Reverse Logistics Market Estimates and Forecast, 2020-2028 (USD Million)
7.3.4.3.1 By Return Type
7.3.4.3.2 By Service
7.3.4.3.3 By End User Industry
7.3.4.4 Italy Reverse Logistics Market Estimates and Forecast, 2020-2028 (USD Million)
7.3.4.4.1 By Return Type
7.3.4.4.2 By Service
7.2.4.4.3 By End User Industry
7.3.4.5 Spain Reverse Logistics Market Estimates and Forecast, 2020-2028 (USD Million)
7.3.4.5.1 By Return Type
7.3.4.5.2 By Service
7.2.4.5.3 By End User Industry
7.3.4.6 Netherlands Reverse Logistics Market Estimates and Forecast, 2020-2028 (USD Million)
7.3.4.6.1 By Return Type
7.3.4.6.2 By Service
7.2.4.6.3 By End User Industry
7.3.4.7 Rest of Europe Reverse Logistics Market Estimates and Forecast, 2020-2028 (USD Million)
7.3.4.7.1 By Return Type
7.3.4.7.2 By Service
7.2.4.7.3 By End User Industry
7.4 Asia Pacific Reverse Logistics Market Estimates and Forecast, 2020-2028 (USD Million)
7.4.1 By Return Type
7.4.2 By Service
7.4.3 By End User Industry
7.4.4 By Country
7.4.4.1 China Reverse Logistics Market Estimates and Forecast, 2020-2028 (USD Million)
7.4.4.1.1 By Return Type
7.4.4.1.2 By Service
7.4.4.1.3 By End User Industry
7.4.4.2 Japan Reverse Logistics Market Estimates and Forecast, 2020-2028 (USD Million)
7.4.4.2.1 By Return Type
7.4.4.2.2 By Service
7.4.4.2.3 By End User Industry
7.4.4.3 India Reverse Logistics Market Estimates and Forecast, 2020-2028 (USD Million)
7.4.4.3.1 By Return Type
7.4.4.3.2 By Service
7.4.4.3.3 By End User Industry
7.4.4.4 South Korea Reverse Logistics Market Estimates and Forecast, 2020-2028 (USD Million)
7.4.4.4.1 By Return Type
7.4.4.4.2 By Service
7.4.4.4.3 By End User Industry
7.4.4.5 Singapore Reverse Logistics Market Estimates and Forecast, 2020-2028 (USD Million)
7.4.4.5.1 By Return Type
7.4.4.5.2 By Service
7.4.4.5.3 By End User Industry
7.4.4.6 Malaysia Reverse Logistics Market Estimates and Forecast, 2020-2028 (USD Million)
7.4.4.6.1 By Return Type
7.4.4.6.2 By Service
7.4.4.6.3 By End User Industry
7.4.4.7 Thailand Reverse Logistics Market Estimates and Forecast, 2020-2028 (USD Million)
7.4.4.7.1 By Return Type
7.4.4.7.2 By Service
7.4.4.7.3 By End User Industry
7.4.4.8 Indonesia Reverse Logistics Market Estimates and Forecast, 2020-2028 (USD Million)
7.4.4.8.1 By Return Type
7.4.4.8.2 By Service
7.4.4.8.3 By End User Industry
7.4.4.9 Vietnam Reverse Logistics Market Estimates and Forecast, 2020-2028 (USD Million)
7.4.4.9.1 By Return Type
7.4.4.9.2 By Service
7.4.4.9.3 By End User Industry
7.4.4.10 Taiwan Reverse Logistics Market Estimates and Forecast, 2020-2028 (USD Million)
7.4.4.10.1 By Return Type
7.4.4.10.2 By Service
7.4.4.10.3 By End User Industry
7.4.4.11 Rest of Asia Pacific Reverse Logistics Market Estimates and Forecast, 2020-2028 (USD Million)
7.4.4.11.1 By Return Type
7.4.4.11.2 By Service
7.4.4.11.3 By End User Industry
7.5 Middle East and Africa Reverse Logistics Market Estimates and Forecast, 2020-2028 (USD Million)
7.5.1 By Return Type
7.5.2 By Service
7.5.3 By End User Industry
7.5.4 By Country
7.5.4.1 Saudi Arabia Reverse Logistics Market Estimates and Forecast, 2020-2028 (USD Million)
7.5.4.1.1 By Return Type
7.5.4.1.2 By Service
7.5.4.1.3 By End User Industry
7.5.4.2 U.A.E. Reverse Logistics Market Estimates and Forecast, 2020-2028 (USD Million)
7.5.4.2.1 By Return Type
7.5.4.2.2 By Service
7.5.4.2.3 By End User Industry
7.5.4.3 Israel Reverse Logistics Market Estimates and Forecast, 2020-2028 (USD Million)
7.5.4.3.1 By Return Type
7.5.4.3.2 By Service
7.5.4.3.3 By End User Industry
7.5.4.4 South Africa Reverse Logistics Market Estimates and Forecast, 2020-2028 (USD Million)
7.5.4.4.1 By Return Type
7.5.4.4.2 By Service
7.5.4.4.3 By End User Industry
7.5.4.5 Rest of Middle East and Africa Reverse Logistics Market Estimates and Forecast, 2020-2028 (USD Million)
7.5.4.5.1 By Return Type
7.5.4.5.2 By Service
7.5.4.5.2 By End User Industry
7.6 Central and South America Reverse Logistics Market Estimates and Forecast, 2020-2028 (USD Million)
7.6.1 By Return Type
7.6.2 By Service
7.6.3 By End User Industry
7.6.4 By Country
7.6.4.1 Brazil Reverse Logistics Market Estimates and Forecast, 2020-2028 (USD Million)
7.6.4.1.1 By Return Type
7.6.4.1.2 By Service
7.6.4.1.3 By End User Industry
7.6.4.2 Argentina Eaporative Air Cooler Market Estimates and Forecast, 2020-2028 (USD Million)
7.6.4.2.1 By Return Type
7.6.4.2.2 By Service
7.6.4.2.3 By End User Industry
7.6.4.3 Chile Reverse Logistics Market Estimates and Forecast, 2020-2028 (USD Million)
7.6.4.3.1 By Return Type
7.6.4.3.2 By Service
7.6.4.3.3 By End User Industry
7.6.4.4 Rest of Central & South America Reverse Logistics Market Estimates and Forecast, 2020-2028 (USD Million)
7.6.4.4.1 By Return Type
7.6.4.4.2 By Service
7.6.4.4.3 By End User Industry
8 COMPETITIVE LANDCAPE
8.1 Company Market Share Analysis
8.2 Four Quadrant Positioning Matrix
8.2.1 Market Leaders
8.2.2 Market Visionaries
8.2.3 Market Challengers
8.2.4 Niche Market Players
8.3 Vendor Landscape
8.3.1 North America
8.3.2 Europe
8.3.3 Asia Pacific
8.3.4 Rest of the World
8.4 Company Profiles
8.4.1 DB SCHENKER (Deutsche Bahn AG)
8.4.1.1 Business Description & Financial Analysis
8.4.1.2 SWOT Analysis
8.4.1.3 Products & Services Offered
8.4.1.4 Strategic Alliances between Business Partners
8.4.2 Deutsche Post AG
8.4.2.1 Business Description & Financial Analysis
8.4.2.2 SWOT Analysis
8.4.2.3 Products & Services Offered
8.4.2.4 Strategic Alliances between Business Partners
8.4.3 FedEx Corporation
8.4.3.1 Business Description & Financial Analysis
8.4.3.2 SWOT Analysis
8.4.3.3 Products & Services Offered
8.4.3.4 Strategic Alliances between Business Partners
8.4.4 Kintetsu World Express, Inc.
8.4.4.1 Business Description & Financial Analysis
8.4.4.2 SWOT Analysis
8.4.4.3 Products & Services Offered
8.4.4.4 Strategic Alliances between Business Partners
8.4.5 United Parcel Service, Inc.
8.4.5.1 Business Description & Financial Analysis
8.4.5.2 SWOT Analysis
8.4.5.3 Products & Services Offered
8.4.5.4 Strategic Alliances between Business Partners
8.4.6 Yusen Logistics Co., Ltd.
8.4.6.1 Business Description & Financial Analysis
8.4.6.2 SWOT Analysis
8.4.6.3 Products & Services Offered
8.4.6.4 Strategic Alliances between Business Partners
8.4.7 RLG Systems AG
8.4.7.1 Business Description & Financial Analysis
8.4.7.2 SWOT Analysis
8.4.7.3 Products & Services Offered
8.4.8.4 Strategic Alliances between Business Partners
8.4.8 Core Logistic Private Limited
8.4.8.1 Business Description & Financial Analysis
8.4.8.2 SWOT Analysis
8.4.8.3 Products & Services Offered
8.4.8.4 Strategic Alliances between Business Partners
8.4.9 Safexpress Pvt. Ltd.
8.4.9.1 Business Description & Financial Analysis
8.4.9.2 SWOT Analysis
8.4.9.3 Products & Services Offered
8.4.9.4 Strategic Alliances between Business Partners
8.4.10 CCR Logistics System AG
8.4.10.1 Business Description & Financial Analysis
8.4.10.2 SWOT Analysis
8.4.10.3 Products & Services Offered
8.4.10.4 Strategic Alliances between Business Partners
8.4.11 Other Companies
8.4.11.1 Business Description & Financial Analysis
8.4.11.2 SWOT Analysis
8.4.11.3 Products & Services Offered
8.4.11.4 Strategic Alliances between Business Partners
9 RESEARCH METHODOLOGY
9.1 Market Introduction
9.1.1 Market Definition
9.1.2 Market Scope & Segmentation
9.2 Information Procurement
9.2.1 Secondary Research
9.2.1.1 Purchased Databases
9.2.1.2 GMEs Internal Data Repository
9.2.1.3 Secondary Resources & Third Party Perspectives
9.2.1.4 Company Information Sources
9.2.2 Primary Research
9.2.2.1 Various Types of Respondents for Primary Interviews
9.2.2.2 Number of Interviews Conducted throughout the Research Process
9.2.2.3 Primary Stakeholders
9.2.2.4 Discussion Guide for Primary Participants
9.2.3 Expert Panels
9.2.3.1 Expert Panels Across 30+ Industry
9.2.4 Paid Local Experts
9.2.4.1 Paid Local Experts Across 30+ Industry Across each Region
9.3 Market Estimation
9.3.1 Top-Down Approach
9.3.1.1 Macro-Economic Indicators Considered
9.3.1.2 Micro-Economic Indicators Considered
9.3.2 Bottom Up Approach
9.3.2.1 Company Share Analysis Approach
9.3.2.2 Estimation of Potential Product Sales
9.4 Data Triangulation
9.4.1 Data Collection
9.4.2 Time Series, Cross Sectional & Panel Data Analysis
9.4.3 Cluster Analysis
9.5 Analysis and Output
9.5.1 Inhouse AI Based Real Time Analytics Tool
9.5.2 Output From Desk & Primary Research
9.6 Research Assumptions & Limitations
9.7.1 Research Assumptions
9.7.2 Research Limitations
LIST OF TABLES
1 Global Reverse Logistics Market, By Return Type, 2020-2028 (USD Mllion)
2 Recall Returns Market, By Region, 2020-2028 (USD Mllion)
3 B2B Returns and Commercial Returns Market, By Region, 2020-2028 (USD Mllion)
4 Repairable Returns Market, By Region, 2020-2028 (USD Mllion)
5 End of Use Returns Market, By Region, 2020-2028 (USD Mllion)
6 End of Life Returns Market, By Region, 2020-2028 (USD Mllion)
7 Global Reverse Logistics Market, By Service, 2020-2028 (USD Mllion)
8 Transportation Market, By Region, 2020-2028 (USD Mllion)
9 Warehousing Market, By Region, 2020-2028 (USD Mllion)
10 Reselling Market, By Region, 2020-2028 (USD Mllion)
11 Replacement Management Market, By Region, 2020-2028 (USD Mllion)
12 Refund Management Market, By Region, 2020-2028 (USD Mllion)
13 Others Market, By Region, 2020-2028 (USD Mllion)
14 Global Reverse Logistics Market, By End User Industry, 2020-2028 (USD Mllion)
15 Retail & E-commerce Market, By Region, 2020-2028 (USD Mllion)
16 Automotive Market, By Region, 2020-2028 (USD Mllion)
17 Consumer Electronics Market, By Region, 2020-2028 (USD Mllion)
18 Healthcare Market, By Region, 2020-2028 (USD Mllion)
19 Others Market, By Region, 2020-2028 (USD Mllion)
20 Regional Analysis, 2020-2028 (USD Mllion)
21 North America Reverse Logistics Market, By Return Type, 2020-2028 (USD Million)
22 North America Reverse Logistics Market, By Service, 2020-2028 (USD Million)
23 North America Reverse Logistics Market, By End User Industry, 2020-2028 (USD Million)
24 North America Reverse Logistics Market, By Country, 2020-2028 (USD Million)
25 U.S Reverse Logistics Market, By Return Type, 2020-2028 (USD Million)
26 U.S Reverse Logistics Market, By Service, 2020-2028 (USD Million)
27 U.S Reverse Logistics Market, By End User Industry, 2020-2028 (USD Million)
28 Canada Reverse Logistics Market, By Return Type, 2020-2028 (USD Million)
29 Canada Reverse Logistics Market, By Service, 2020-2028 (USD Million)
30 Canada Reverse Logistics Market, By End User Industry, 2020-2028 (USD Million)
31 Mexico Reverse Logistics Market, By Return Type, 2020-2028 (USD Million)
32 Mexico Reverse Logistics Market, By Service, 2020-2028 (USD Million)
33 Mexico Reverse Logistics Market, By End User Industry, 2020-2028 (USD Million)
34 Europe Reverse Logistics Market, By Return Type, 2020-2028 (USD Million)
35 Europe Reverse Logistics Market, By Service, 2020-2028 (USD Million)
36 Europe Reverse Logistics Market, By End User Industry, 2020-2028 (USD Million)
37 Europe Reverse Logistics Market, By country, 2020-2028 (USD Million)
38 Germany Reverse Logistics Market, By Return Type, 2020-2028 (USD Million)
39 Germany Reverse Logistics Market, By Service, 2020-2028 (USD Million)
40 Germany Reverse Logistics Market, By End User Industry, 2020-2028 (USD Million)
41 UK Reverse Logistics Market, By Return Type, 2020-2028 (USD Million)
42 UK Reverse Logistics Market, By Service, 2020-2028 (USD Million)
43 UK Reverse Logistics Market, By End User Industry, 2020-2028 (USD Million)
44 France Reverse Logistics Market, By Return Type, 2020-2028 (USD Million)
45 France Reverse Logistics Market, By Service, 2020-2028 (USD Million)
46 France Reverse Logistics Market, By End User Industry, 2020-2028 (USD Million)
47 Italy Reverse Logistics Market, By Return Type, 2020-2028 (USD Million)
48 Italy Reverse Logistics Market, By T End Use Type, 2020-2028 (USD Million)
49 Italy Reverse Logistics Market, By End User Industry, 2020-2028 (USD Million)
50 Spain Reverse Logistics Market, By Return Type, 2020-2028 (USD Million)
51 Spain Reverse Logistics Market, By Service, 2020-2028 (USD Million)
52 Spain Reverse Logistics Market, By End User Industry, 2020-2028 (USD Million)
53 Rest Of Europe Reverse Logistics Market, By Return Type, 2020-2028 (USD Million)
54 Rest Of Europe Reverse Logistics Market, By Service, 2020-2028 (USD Million)
55 Rest of Europe Reverse Logistics Market, By End User Industry, 2020-2028 (USD Million)
56 Asia Pacific Reverse Logistics Market, By Return Type, 2020-2028 (USD Million)
57 Asia Pacific Reverse Logistics Market, By Service, 2020-2028 (USD Million)
58 Asia Pacific Reverse Logistics Market, By End User Industry, 2020-2028 (USD Million)
59 Asia Pacific Reverse Logistics Market, By Country, 2020-2028 (USD Million)
60 China Reverse Logistics Market, By Return Type, 2020-2028 (USD Million)
61 China Reverse Logistics Market, By Service, 2020-2028 (USD Million)
62 China Reverse Logistics Market, By End User Industry, 2020-2028 (USD Million)
63 India Reverse Logistics Market, By Return Type, 2020-2028 (USD Million)
64 India Reverse Logistics Market, By Service, 2020-2028 (USD Million)
65 India Reverse Logistics Market, By End User Industry, 2020-2028 (USD Million)
66 Japan Reverse Logistics Market, By Return Type, 2020-2028 (USD Million)
67 Japan Reverse Logistics Market, By Service, 2020-2028 (USD Million)
68 Japan Reverse Logistics Market, By End User Industry, 2020-2028 (USD Million)
69 South Korea Reverse Logistics Market, By Return Type, 2020-2028 (USD Million)
70 South Korea Reverse Logistics Market, By Service, 2020-2028 (USD Million)
71 South Korea Reverse Logistics Market, By End User Industry, 2020-2028 (USD Million)
72 Vietnam Reverse Logistics Market, By Return Type, 2020-2028 (USD Million)
73 Vietnam Reverse Logistics Market, By Service, 2020-2028 (USD Million)
74 Vietnam Reverse Logistics Market, By End User Industry, 2020-2028 (USD Million)
75 Taiwan Reverse Logistics Market, By Return Type, 2020-2028 (USD Million)
76 Taiwan Reverse Logistics Market, By Service, 2020-2028 (USD Million)
77 Taiwan Reverse Logistics Market, By End User Industry, 2020-2028 (USD Million)
78 Rest of Asia Pacific Reverse Logistics Market, By Return Type, 2020-2028 (USD Million)
79 Rest of Asia Pacific Reverse Logistics Market, By Service, 2020-2028 (USD Million)
80 Rest of Asia Pacific Reverse Logistics Market, By End User Industry, 2020-2028 (USD Million)
81 Middle East and Africa Reverse Logistics Market, By Return Type, 2020-2028 (USD Million)
82 Middle East and Africa Reverse Logistics Market, By Service, 2020-2028 (USD Million)
83 Middle East and Africa Reverse Logistics Market, By End User Industry, 2020-2028 (USD Million)
84 Middle East and Africa Reverse Logistics Market, By Country, 2020-2028 (USD Million)
85 Saudi Arabia Reverse Logistics Market, By Return Type, 2020-2028 (USD Million)
86 Saudi Arabia Reverse Logistics Market, By Service, 2020-2028 (USD Million)
87 Saudi Arabia Reverse Logistics Market, By End User Industry, 2020-2028 (USD Million)
88 UAE Reverse Logistics Market, By Return Type, 2020-2028 (USD Million)
89 UAE Reverse Logistics Market, By Service, 2020-2028 (USD Million)
90 UAE Reverse Logistics Market, By End User Industry, 2020-2028 (USD Million)
91 South Africa Reverse Logistics Market, By Return Type, 2020-2028 (USD Million)
92 South Africa Reverse Logistics Market, By Service, 2020-2028 (USD Million)
93 South Africa Reverse Logistics Market, By End User Industry, 2020-2028 (USD Million)
94 Rest of Middle East and Africa Reverse Logistics Market, By Return Type, 2020-2028 (USD Million)
95 Rest of Middle East and Africa Reverse Logistics Market, By Service, 2020-2028 (USD Million)
96 Rest of Middle East and Africa Reverse Logistics Market, By End User Industry, 2020-2028 (USD Million)
97 Central and South America Reverse Logistics Market, By Return Type, 2020-2028 (USD Million)
98 Central and South America Reverse Logistics Market, By Service, 2020-2028 (USD Million)
99 Central and South America Reverse Logistics Market, By End User Industry, 2020-2028 (USD Million)
100 Central and South America Reverse Logistics Market, By Country, 2020-2028 (USD Million)
101 Brazil Reverse Logistics Market, By Return Type, 2020-2028 (USD Million)
102 Brazil Reverse Logistics Market, By Service, 2020-2028 (USD Million)
103 Brazil Reverse Logistics Market, By End User Industry, 2020-2028 (USD Million)
104 Chile Reverse Logistics Market, By Return Type, 2020-2028 (USD Million)
105 Chile Reverse Logistics Market, By Service, 2020-2028 (USD Million)
106 Chile Reverse Logistics Market, By End User Industry, 2020-2028 (USD Million)
107 Rest of Central and South America Reverse Logistics Market, By Return Type, 2020-2028 (USD Million)
108 Rest of Central and South America Reverse Logistics Market, By Service, 2020-2028 (USD Million)
109 Rest of Central and South AmericaReverse Logistics Market, By End User Industry, 2020-2028 (USD Million)
110 DB SCHENKER (Deutsche Bahn AG): Products & Services Offering
111 Deutsche Post AG: Products & Services Offering
112 FedEx Corporation: Products & Services Offering
113 Kintetsu World Express, Inc.: Products & Services Offering
114 United Parcel Service, Inc.: Products & Services Offering
115 YUSEN LOGISTICS CO., LTD.: Products & Services Offering
116 RLG Systems AG : Products & Services Offering
117 Core Logistic Private Limited: Products & Services Offering
118 Safexpress Pvt. Ltd., Inc: Products & Services Offering
119 CCR Logistics System AG: Products & Services Offering
120 Other Companies: Products & Services Offering
LIST OF FIGURES
1 Global Reverse Logistics Market Overview
2 Global Reverse Logistics Market Value From 2020-2028 (USD Mllion)
3 Global Reverse Logistics Market Share, By Return Type (2022)
4 Global Reverse Logistics Market Share, By Service (2022)
5 Global Reverse Logistics Market Share, By End User Industry (2022)
6 Global Reverse Logistics Market, By Region (Asia Pacific Market)
7 Technological Trends In Global Reverse Logistics Market
8 Four Quadrant Competitor Positioning Matrix
9 Impact Of Macro & Micro Indicators On The Market
10 Impact Of Key Drivers On The Global Reverse Logistics Market
11 Impact Of Challenges On The Global Reverse Logistics Market
12 Porter’s Five Forces Analysis
13 Global Reverse Logistics Market: By Return Type Scope Key Takeaways
14 Global Reverse Logistics Market, By Return Type Segment: Revenue Growth Analysis
15 Recall Returns Market, By Region, 2020-2028 (USD Mllion)
16 B2B Returns and Commercial Returns Market, By Region, 2020-2028 (USD Mllion)
17 Repairable Returns Market, By Region, 2020-2028 (USD Mllion)
18 End of Use Returns Market, By Region, 2020-2028 (USD Mllion)
19 End of Life Returns Market, By Region, 2020-2028 (USD Mllion)
20 Global Reverse Logistics Market: By Service Scope Key Takeaways
21 Global Reverse Logistics Market, By Service Segment: Revenue Growth Analysis
22 Transportation Market, By Region, 2020-2028 (USD Mllion)
23 Warehousing Market, By Region, 2020-2028 (USD Mllion)
24 Reselling Market, By Region, 2020-2028 (USD Mllion)
25 Replacement Management Market, By Region, 2020-2028 (USD Mllion)
26 Refund Management Market, By Region, 2020-2028 (USD Mllion)
27 Others Market, By Region, 2020-2028 (USD Mllion)
28 Global Reverse Logistics Market: By End User Industry Scope Key Takeaways
29 Global Reverse Logistics Market, By End User Industry Segment: Revenue Growth Analysis
30 Retail & E-commerce Market, By Region, 2020-2028 (USD Mllion)
31 Automotive Market, By Region, 2020-2028 (USD Mllion)
32 Consumer Electronics Market, By Region, 2020-2028 (USD Mllion)
33 Healthcare Market, By Region, 2020-2028 (USD Mllion)
34 Others Market, By Region, 2020-2028 (USD Mllion)
35 Regional Segment: Revenue Growth Analysis
36 Global Reverse Logistics Market: Regional Analysis
37 North America Reverse Logistics Market Overview
38 North America Reverse Logistics Market, By Return Type
39 North America Reverse Logistics Market, By Service
40 North America Reverse Logistics Market, By End User Industry
41 North America Reverse Logistics Market, By Country
42 U.S. Reverse Logistics Market, By Return Type
43 U.S. Reverse Logistics Market, By Service
44 U.S. Reverse Logistics Market, By End User Industry
45 Canada Reverse Logistics Market, By Return Type
46 Canada Reverse Logistics Market, By Service
47 Canada Reverse Logistics Market, By End User Industry
48 Mexico Reverse Logistics Market, By Return Type
49 Mexico Reverse Logistics Market, By Service
50 Mexico Reverse Logistics Market, By End User Industry
51 Four Quadrant Positioning Matrix
52 Company Market Share Analysis
53 DB SCHENKER (Deutsche Bahn AG): Company Snapshot
54 DB SCHENKER (Deutsche Bahn AG): SWOT Analysis
55 DB SCHENKER (Deutsche Bahn AG): Geographic Presence
56 Deutsche Post AG: Company Snapshot
57 Deutsche Post AG: SWOT Analysis
58 Deutsche Post AG: Geographic Presence
59 FedEx Corporation: Company Snapshot
60 FedEx Corporation: SWOT Analysis
61 FedEx Corporation: Geographic Presence
62 Kintetsu World Express, Inc.: Company Snapshot
63 Kintetsu World Express, Inc.: Swot Analysis
64 Kintetsu World Express, Inc.: Geographic Presence
65 United Parcel Service, Inc.: Company Snapshot
66 United Parcel Service, Inc.: SWOT Analysis
67 United Parcel Service, Inc.: Geographic Presence
68 Yusen Logistics Co., Ltd.: Company Snapshot
69 Yusen Logistics Co., Ltd.: SWOT Analysis
70 Yusen Logistics Co., Ltd.: Geographic Presence
71 RLG Systems AG : Company Snapshot
72 RLG Systems AG : SWOT Analysis
73 RLG Systems AG : Geographic Presence
74 Core Logistic Private Limited: Company Snapshot
75 Core Logistic Private Limited: SWOT Analysis
76 Core Logistic Private Limited: Geographic Presence
77 Safexpress Pvt. Ltd., Inc.: Company Snapshot
78 Safexpress Pvt. Ltd., Inc.: SWOT Analysis
79 Safexpress Pvt. Ltd., Inc.: Geographic Presence
80 CCR Logistics System AG: Company Snapshot
81 CCR Logistics System AG: SWOT Analysis
82 CCR Logistics System AG: Geographic Presence
83 Other Companies: Company Snapshot
84 Other Companies: SWOT Analysis
85 Other Companies: Geographic Presence
The Global Reverse Logistics Market has been studied from the year 2019 till 2028. However, the CAGR provided in the report is from the year 2023 to 2028. The research methodology involved three stages: Desk research, Primary research, and Analysis & Output from the entire research process.

The desk research involved a robust background study which meant referring to paid and unpaid databases to understand the market dynamics; mapping contracts from press releases; identifying the key players in the market, studying their product portfolio, competition level, annual reports/SEC filings & investor presentations; and learning the demand and supply-side analysis for the Reverse Logistics Market.

The primary research activity included telephonic conversations with more than 50 tier 1 industry consultants, distributors, and end-use product manufacturers.

Finally, based on the above thorough research process, an in-depth analysis was carried out considering the following aspects: market attractiveness, current & future market trends, market share analysis, SWOT analysis of the company and customer analytics.

Frequently Asked Questions

This FREE sample includes market data points, ranging from trend analyses to market estimates & forecasts. See for yourself.
Or view our licence options:
Tailor made solutions just for you
80% of our clients seek made-to-order reports. How do you want us to tailor yours?
OUR CLIENTS


