This report was recently updated on August 25 2025 with the latest and most recent
market numbers
Global Rheometer & Viscometer Market Size, Trends & Analysis - Forecasts to 2026 By Product (Viscometers [Rotational Viscometers, Process Viscometers, Capillary Viscometers, Other Viscometers], Rheometers [Torque Rotational Rheometers, Dynamic Rotational Rheometers, Capillary Rheometers, Oscillatory Rheometers, High-Throughput Rheometers, Other Rheometers]), By Sample Type (Resins & Coatings, Pastes & Gels, Suspensions & Slurries, Other Samples), By End-User (Pharmaceutical, Cosmeceutical, and Biotechnology Companies, Petroleum, Product Manufacturers and Petrochemical Refineries, Chemical and Material Manufacturers, Food and Beverage Manufacturers, Research Laboratories and Academic Institutes), By Region (North America, Europe, Asia Pacific, MEA, and CSA); End-User Landscape, Vendor Landscape, and Company Market Share Analysis and Competitor Analysis
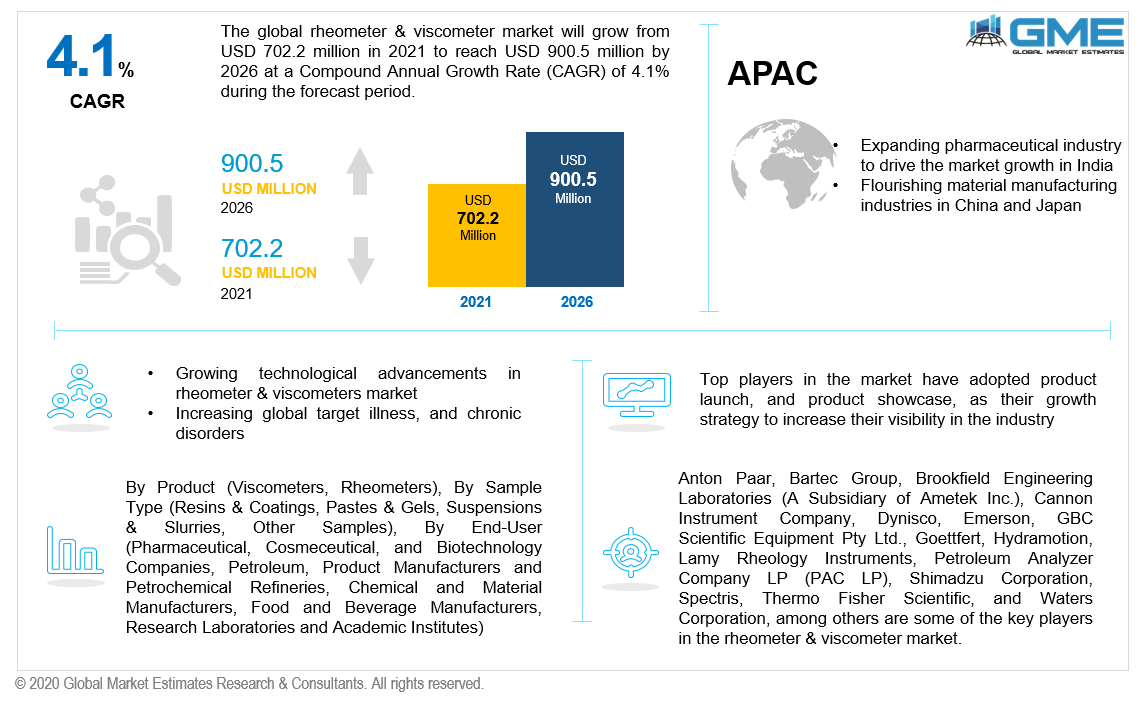
The global rheometer & viscometer market will grow from USD 702.2 million in 2021 to reach USD 900.5 million in 2026, with a CAGR value of 4.1%. Viscometer & rheometer are used to measure the viscosity and flow properties of a fluid. Viscometers only measure the flow condition, but rheometers measure the flow in multiple parameters. Rheometers and viscometers analyze how a fluid reacts to shear or stress, potentially providing information on material structure and elasticity.
The rising acceptance of viscometers & rheometers in the manufacturing & healthcare industry, expansion of petrochemical and material manufacturing industries, technical advancements related to rheometers & viscometers, and the increasing global incidence of target disorders are some of the key factors expected to drive market growth during the forecast period. In addition, automation is lately being implemented in refinery plants to assure the highest safety and security of equipment, workers, and the plant environment. Hence, with the augmentation of automation in refinery plants, there is a greater demand for in-line process (IIPV) viscometers in the market.
Moreover, the increasing private-public investments to aid product innovation in rheometer & viscometer and rising stringent safety compliance for production procedure in biotechnological and cosmeceutical are anticipated to augment the market growth.
According to the comprehensive forecast trend analysis by Global Market Estimates, the industrial viscometer is high in demand during the forecast period. Industrial viscometer models can be used not just for laboratory measurements, but also for measurements during manufacturing operations. There are various options available, ranging from portable devices to models with waterproof enclosures that allow for a thorough inspection of liquid samples. Also, viscometer torque is an apparatus to measure the viscosity of slurries. Hence, with the robust application area of viscometer, and availability of portable measuring devices, the viscometer rheometer market is ought to be growing the fastest.
The product type segment is categorized into viscometers and rheometers. The viscometers product segment is expected to capture the largest share in the market from 2021 to 2026. The segment is further classified as rotational viscometers, process viscometers, capillary viscometers, other viscometers (dynamic viscometers). The rising acceptance of viscometer among pharma researchers and petro-refinery industries and laboratory personnel owing to the procedural benefits provided by these instruments, such as the capacity to examine samples in varied conditions, high accuracy, versatility in assessing diverse samples, simplicity of handling, quick processing time, and device portability is likely to accelerate the segment growth throughout the forecast period.
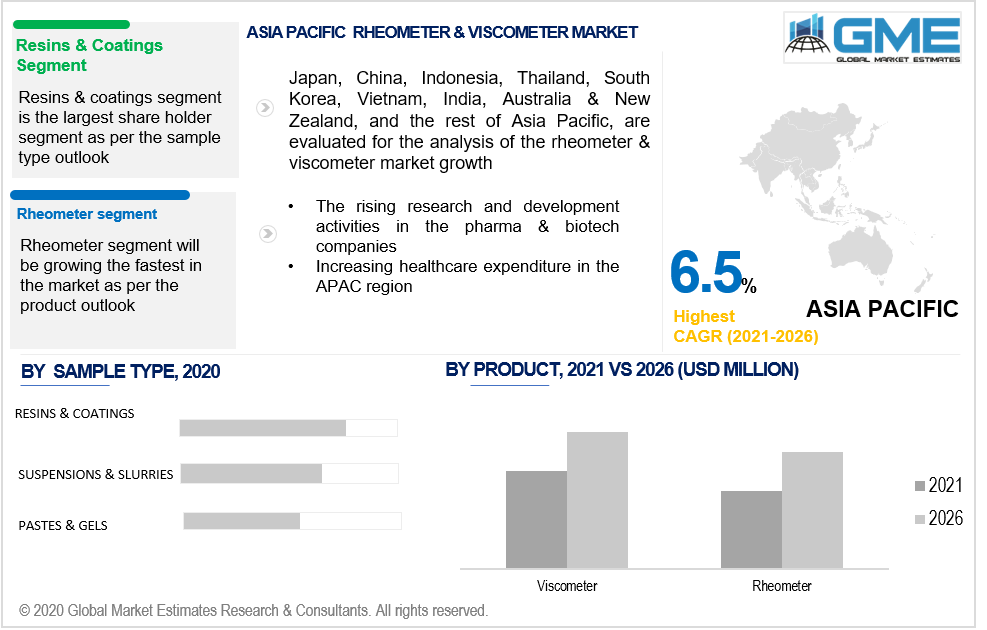
The rheometer segment is expected to grow at the highest CAGR during the forecast period. The segment is further segregated into torque rotational rheometers, dynamic rotational rheometry, capillary rheometers, oscillatory rheometers, high-throughput rheometers, and other rheometers. The capillary rheometer detects extensional viscosity, wall slip, and heat stability. Due to its vast range of applications for capillary rheology, it is expected that sales of capillary rheometers will expand at a faster rate from 2021 to 2026.
Resins & coatings, pastes & gels, suspensions & slurries, and other samples are the segments based on the type of samples in the rheometer & viscometer market. The resins & coatings segment is expected to capture the lion’s share during the forecast period of 2021 to 2026. The high growth is mainly due to the growing production of coatings, binders, paints, solvents, and additives, and growing usage of rheometer & viscometer among petrochemical refineries producers.
The end-user segment is categorized into pharmaceutical, cosmeceutical, and biotechnology companies, petroleum, product manufacturers and petrochemical refineries, chemical and material manufacturers, food and beverage manufacturers, research laboratories, and academic institutes. The petroleum, product manufacturers, and petrochemical refineries segments are expected to dominate the market in terms of revenue during the forecast period. It is attributable to the expanding production capacity & output of major producers post COVID-19 pandemic situation.
As per the geographical analysis, the global rheometer & viscometer market can be classified into North America (the United States, Canada, and Mexico), Asia Pacific (India, China, Japan, Malaysia, Singapore, and the Rest of Asia Pacific), Europe (Germany, United Kingdom, Italy, France, Spain, Netherlands, and Rest of Europe), Middle East & Africa (Saudi Arabia, United Arab Emirates, and Rest of the Middle East & Africa) and Central & South America (Brazil, Argentina, and Rest of Central and South America).
North America (the United States, Canada, and Mexico) will have a dominant share in the market from 2021 to 2026. The largest share of the US rheometer & viscometer market is mainly due to the presence of major viscometer players in the country, and the rising number of disease diagnostic procedures based on rheology or viscosity analysis. Moreover, the growing government regulatory frameworks along with the rising healthcare infrastructure, and constant technological advancements in the area of rheometers and viscometers in the country are fit is some of the factors supporting the growth of the rheometer & viscometer market during the forecast period.
Furthermore, the Asia Pacific region will grow with the highest CAGR rate in the market. The increasing number of foodborne illnesses, increasing consumption of packaged foods, and rising R&D investments in healthcare infrastructure will impact the rheometer & viscometer market size in the APAC region.
Anton Paar, Bartec Group, Brookfield Engineering Laboratories (A Subsidiary of Ametek Inc.), Cannon Instrument Company, Dynisco, Emerson, GBC Scientific Equipment Pty Ltd., Goettfert, Hydramotion, Lamy Rheology Instruments, Petroleum Analyzer Company LP (PAC LP), Shimadzu Corporation, Spectris, Thermo Fisher Scientific, and Waters Corporation, among others are some of the key players in the rheometer & viscometer market.
Please note: This is not an exhaustive list of companies profiled in the report.
In March 2021, Bruker Corporation launched the OPTIMUS 2 detector device. This helped the company increase its market visibility.
Chapter 1 Methodology
1.1 Market Scope & Definitions
1.2 Estimates & Forecast Calculation
1.3 Historical Data Overview and Validation
1.4 Data Sources
1.4.1 Secondary
1.4.2 Primary
Chapter 2 Report Outlook
2.1 Rheometer & Viscometer Industry Overview, 2020-2026
2.1.1 Industry Overview
2.1.2 End-User Overview
2.1.3 Product Overview
2.1.4 Sample Type Overview
2.1.5 Regional Overview
Chapter 3 Global Rheometer & Viscometer Market Trends
3.1 Market Segmentation
3.2 Industry Background, 2020-2026
3.3 Market Key Trends
3.3.1 Positive Trends
3.3.1.1 Rising technological advancements in viscometers and rheometers market
3.3.1.2 Growing global burden of infectious diseases
3.3.2 Industry Challenges
3.3.2.1 Lack of skilled-technicians for instrument operation
3.4 Prospective Growth Scenario
3.4.1 End-User Growth Scenario
3.4.2 Product Growth Scenario
3.4.3 Sample Type Growth Scenario
3.5 COVID-19 Influence over Industry Growth
3.6 Porter’s Analysis
3.7 PESTEL Analysis
3.8 Value Chain & Supply Chain Analysis
3.9 Regulatory Framework
3.9.1 North America
3.9.2 Europe
3.9.3 APAC
3.9.4 LATAM
3.9.5 MEA
3.10 Technology Overview
3.11 Market Share Analysis, 2020
3.11.1 Company Positioning Overview, 2020
Chapter 4 Global Rheometer & Viscometer Market, By End-User
4.1 End-User Outlook
4.2 Petroleum Product Manufacturers and Petrochemical Refineries
4.2.1 Market Size, By Region, 2020-2026 (USD Million)
4.3 Pharmaceutical, Cosmeceutical, and Biotechnology Companies
4.3.1 Market Size, By Region, 2020-2026 (USD Million)
4.4 Chemical and Material Manufacturers
4.4.1 Market Size, By Region, 2020-2026 (USD Million)
4.5 Food and Beverage Manufacturer
4.5.1 Market Size, By Region, 2020-2026 (USD Million)
4.6 Research Laboratories and Academic Institutes
4.6.1 Market Size, By Region, 2020-2026 (USD Million)
4.7 Others
4.7.1 Market Size, By Region, 2020-2026 (USD Million)
Chapter 5 Global Rheometer & Viscometer Market, By Product
5.1 Product Outlook
5.2 Rheometers
5.2.1 Market Size, By Region, 2020-2026 (USD Million)
5.2.1.1 Torque Rotational Rheometers Market Size, By Region, 2020-2026 (USD Million)
5.2.1.2 Dynamic Rotational Rheometers Market Size, By Region, 2020-2026 (USD Million)
5.2.1.3 Capillary Rheometers Market Size, By Region, 2020-2026 (USD Million)
5.2.1.4 Oscillatory Rheometers Market Size, By Region, 2020-2026 (USD Million)
5.2.1.5 Torque Rotational Rheometers Market Size, By Region, 2020-2026 (USD Million)
5.2.1.6 Torque Rotational Rheometers Market Size, By Region, 2020-2026 (USD Million)
5.3 Viscometer
5.3.1 Market Size, By Region, 2020-2026 (USD Million)
5.3.1.1 Rotational Viscometers Market Size, By Region, 2020-2026 (USD Million)
5.3.1.2 Process Viscometers Market Size, By Region, 2020-2026 (USD Million)
5.3.1.3 Capillary Viscometers Market Size, By Region, 2020-2026 (USD Million)
5.3.1.4 Others Viscometers Market Size, By Region, 2020-2026 (USD Million)
Chapter 6 Rheometer & Viscometer Market, By Sample Type
6.1 Sample Type Outlook
6.2 Resins & Coatings
6.2.1 Market Size, By Region, 2020-2026 (USD Million)
6.3 Suspensions & Slurries
6.3.1 Market Size, By Region, 2020-2026 (USD Million)
6.4 Pastes & Gels
6.4.1 Market Size, By Region, 2020-2026 (USD Million)
6.5 Others
6.5.1 Market Size, By Region, 2020-2026 (USD Million)
Chapter 7 Rheometer & Viscometer Market, By Region
7.1 Regional outlook
7.2 North America
7.2.1 Market Size, By Country 2020-2026 (USD Million)
7.2.2 Market Size, By End-User, 2020-2026 (USD Million)
7.2.3 Market Size, By Product, 2020-2026 (USD Million)
7.2.4 Market Size, By Sample Type, 2020-2026 (USD Million)
7.2.5 U.S.
7.2.5.1 Market Size, By End-User, 2020-2026 (USD Million)
7.2.5.2 Market Size, By Product, 2020-2026 (USD Million)
7.2.5.3 Market Size, By Sample Type, 2020-2026 (USD Million)
7.2.6 Canada
7.2.6.1 Market Size, By End-User, 2020-2026 (USD Million)
7.2.6.2 Market Size, By Product, 2020-2026 (USD Million)
7.2.6.3 Market Size, By Sample Type, 2020-2026 (USD Million)
7.3 Europe
7.3.1 Market Size, By Country 2020-2026 (USD Million)
7.3.2 Market Size, By End-User, 2020-2026 (USD Million)
7.3.3 Market Size, By Product, 2020-2026 (USD Million)
7.3.4 Market Size, By Sample Type, 2020-2026 (USD Million)
7.3.5 Germany
7.3.5.1 Market Size, By End-User, 2020-2026 (USD Million)
7.3.5.2 Market Size, By Product, 2020-2026 (USD Million)
7.3.5.3 Market Size, By Sample Type, 2020-2026 (USD Million)
7.3.6 UK
7.3.6.1 Market Size, By End-User, 2020-2026 (USD Million)
7.3.6.2 Market Size, By Product, 2020-2026 (USD Million)
7.3.6.3 Market Size, By Sample Type, 2020-2026 (USD Million)
7.3.7 France
7.3.7.1 Market Size, By End-User, 2020-2026 (USD Million)
7.3.7.2 Market Size, By Product, 2020-2026 (USD Million)
7.3.7.3 Market Size, By Sample Type, 2020-2026 (USD Million)
7.3.8 Italy
7.3.8.1 Market Size, By End-User, 2020-2026 (USD Million)
7.3.8.2 Market Size, By Product, 2020-2026 (USD Million)
7.3.8.3 Market Size, By Sample Type, 2020-2026 (USD Million)
7.3.9 Spain
7.3.9.1 Market Size, By End-User, 2020-2026 (USD Million)
7.3.9.2 Market Size, By Product, 2020-2026 (USD Million)
7.3.9.3 Market Size, By Sample Type, 2020-2026 (USD Million)
7.3.10 Russia
7.3.10.1 Market Size, By End-User, 2020-2026 (USD Million)
7.3.10.2 Market Size, By Product, 2020-2026 (USD Million)
7.3.10.3 Market Size, By Sample Type, 2020-2026 (USD Million)
7.4 Asia Pacific
7.4.1 Market Size, By Country,2020-2026 (USD Million)
7.4.2 Market Size, By End-User, 2020-2026 (USD Million)
7.4.3 Market Size, By Product, 2020-2026 (USD Million)
7.4.4 Market Size, By Sample Type, 2020-2026 (USD Million)
7.4.5 China
7.4.5.1 Market Size, By End-User, 2020-2026 (USD Million)
7.4.5.2 Market Size, By Product, 2020-2026 (USD Million)
7.4.5.3 Market Size, By Sample Type, 2020-2026 (USD Million)
7.4.6 India
7.4.6.1 Market Size, By End-User, 2020-2026 (USD Million)
7.4.6.2 Market Size, By Product, 2020-2026 (USD Million)
7.4.6.3 Market Size, By Sample Type, 2020-2026 (USD Million)
7.4.7 Japan
7.4.7.1 Market Size, By End-User, 2020-2026 (USD Million)
7.4.7.2 Market Size, By Product, 2020-2026 (USD Million)
7.4.7.3 Market Size, By Sample Type, 2020-2026 (USD Million)
7.4.8 Australia
7.4.8.1 Market Size, By End-User, 2020-2026 (USD Million)
7.4.8.2 Market size, By Product, 2020-2026 (USD Million)
7.4.8.3 Market Size, By Sample Type, 2020-2026 (USD Million)
7.4.9 South Korea
7.4.9.1 Market Size, By End-User, 2020-2026 (USD Million)
7.4.9.2 Market Size, By Product, 2020-2026 (USD Million)
7.4.9.3 Market Size, By Sample Type, 2020-2026 (USD Million)
7.6.5 Latin America
7.5.1 Market Size, By Country 2020-2026 (USD Million)
7.5.2 Market Size, By End-User, 2020-2026 (USD Million)
7.5.3 Market Size, By Product, 2020-2026 (USD Million)
7.5.4 Market Size, By Sample Type, 2020-2026 (USD Million)
7.5.5 Brazil
7.5.5.1 Market Size, By End-User, 2020-2026 (USD Million)
7.5.5.2 Market Size, By Product, 2020-2026 (USD Million)
7.5.5.3 Market Size, By Sample Type, 2020-2026 (USD Million)
7.5.6 Mexico
7.5.6.1 Market Size, By End-User, 2020-2026 (USD Million)
7.5.6.2 Market Size, By Product, 2020-2026 (USD Million)
7.5.6.3 Market Size, By Sample Type, 2020-2026 (USD Million)
7.5.7 Argentina
7.5.7.1 Market Size, By End-User, 2020-2026 (USD Million)
7.5.7.2 Market Size, By Product, 2020-2026 (USD Million)
7.5.7.3 Market Size, By Sample Type, 2020-2026 (USD Million)
7.6 MEA
7.6.1 Market Size, By Country 2020-2026 (USD Million)
7.6.2 Market Size, By End-User, 2020-2026 (USD Million)
7.6.3 Market Size, By Product, 2020-2026 (USD Million)
7.6.4 Market Size, By Sample Type, 2020-2026 (USD Million)
7.6.5 Saudi Arabia
7.6.5.1 Market Size, By End-User, 2020-2026 (USD Million)
7.6.5.2 Market Size, By Product, 2020-2026 (USD Million)
7.6.5.3 Market Size, By Sample Type, 2020-2026 (USD Million)
7.6.6 UAE
7.6.6.1 Market Size, By End-User, 2020-2026 (USD Million)
7.6.6.2 Market Size, By Product, 2020-2026 (USD Million)
7.6.6.3 Market Size, By Sample Type, 2020-2026 (USD Million)
7.6.7 South Africa
7.6.7.1 Market Size, By End-User, 2020-2026 (USD Million)
7.6.7.2 Market Size, By Product, 2020-2026 (USD Million)
7.6.7.3 Market Size, By Sample Type, 2020-2026 (USD Million)
Chapter 8 Company Landscape
8.1 Competitive Analysis, 2020
8.2 Anton Paar
8.2.1 Company Overview
8.2.2 Financial Analysis
8.2.3 Strategic Positioning
8.3 Bartec Group
8.3.1 Company Overview
8.3.2 Financial Analysis
8.3.3 Strategic Positioning
8.3.4 Info-Graphic Analysis
8.4 Brookfield Engineering Laboratories (A Subsidiary of Ametek Inc.)
8.4.1 Company Overview
8.4.2 Financial Analysis
8.4.3 Strategic Positioning
8.4.4 Info-Graphic Analysis
8.5 Cannon Instrument Company
8.5.1 Company Overview
8.5.2 Financial Analysis
8.5.3 Strategic Positioning
8.5.4 Info-Graphic Analysis
8.6 Dynisco
8.6.1 Company Overview
8.6.2 Financial Analysis
8.6.3 Strategic Positioning
8.6.4 Info-Graphic Analysis
8.7 Emerson
8.7.1 Company Overview
8.7.2 Financial Analysis
8.7.3 Strategic Positioning
8.7.4 Info-Graphic Analysis
8.8 GBC Scientific Equipment Pty Ltd
8.8.1 Company Overview
8.8.2 Financial Analysis
8.8.3 Strategic Positioning
8.8.4 Info-Graphic Analysis
8.9 Goettfert
8.9.1 Company Overview
8.9.2 Financial Analysis
8.9.3 Strategic Positioning
8.9.4 Info-Graphic Analysis
8.10 Hydramotion
8.10.1 Company Overview
8.10.2 Financial Analysis
8.10.3 Strategic Positioning
8.10.4 Info-Graphic Analysis
8.11 Thermo Fisher Scientific
8.11.1 Company Overview
8.11.2 Financial Analysis
8.11.3 Strategic Positioning
8.11.4 Info-Graphic Analysis
8.12 Other Companies
8.12.1 Company Overview
8.12.2 Financial Analysis
8.12.3 Strategic Positioning
8.12.4 Info-Graphic Analysis
The Global Rheometer & Viscometer Market has been studied from the year 2019 till 2026. However, the CAGR provided in the report is from the year 2021 to 2026. The research methodology involved three stages: Desk research, Primary research, and Analysis & Output from the entire research process.

The desk research involved a robust background study which meant referring to paid and unpaid databases to understand the market dynamics; mapping contracts from press releases; identifying the key players in the market, studying their product portfolio, competition level, annual reports/SEC filings & investor presentations; and learning the demand and supply-side analysis for the Rheometer & Viscometer Market.

The primary research activity included telephonic conversations with more than 50 tier 1 industry consultants, distributors, and end-use product manufacturers.

Finally, based on the above thorough research process, an in-depth analysis was carried out considering the following aspects: market attractiveness, current & future market trends, market share analysis, SWOT analysis of the company and customer analytics.

Frequently Asked Questions
![Global Rheometer & Viscometer Market Size, Trends & Analysis - Forecasts to 2026 By Product (Viscometers [Rotational Viscometers, Process Viscometers, Capillary Viscometers, Other Viscometers], Rheometers [Torque Rotational Rheometers, Dynamic Rotational Rheometers, Capillary Rheometers, Oscillatory Rheometers, High-Throughput Rheometers, Other Rheometers]), By Sample Type (Resins & Coatings, Pastes & Gels, Suspensions & Slurries, Other Samples), By End-User (Pharmaceutical, Cosmeceutical, and Biotechnology Companies, Petroleum, Product Manufacturers and Petrochemical Refineries, Chemical and Material Manufacturers, Food and Beverage Manufacturers, Research Laboratories and Academic Institutes), By Region (North America, Europe, Asia Pacific, MEA, and CSA); End-User Landscape, Vendor Landscape, and Company Market Share Analysis and Competitor Analysis](https://www.globalmarketestimates.com/images/cat/Electronics, Semiconductors and Information & Communication Technology.png)
This FREE sample includes market data points, ranging from trend analyses to market estimates & forecasts. See for yourself.
Or view our licence options:
Tailor made solutions just for you
80% of our clients seek made-to-order reports. How do you want us to tailor yours?
OUR CLIENTS


