This report was recently updated on August 10 2025 with the latest and most recent
market numbers
Global Smart Agriculture Market Size, Trends & Analysis - Forecasts to 2028 By Offering Type (Hardware, Software, and Services), By Agriculture Type (Precision Farming, Livestock Monitoring, Smart Greenhouse, and Other Types), and By Region (North America, Asia Pacific, Central & South America, Europe, and Middle East and Africa), Competitive Landscape, Company Market Share Analysis, and Competitor Analysis
The global smart agriculture market is expected to grow at a CAGR of 9.9% from 2023 to 2028. Smart agriculture, or precision agriculture, is a cutting-edge farming method incorporating technology to improve and expedite agricultural operations. It collects and analyzes data in real-time using various technologies such as sensors, GPS, drones, and robots, which are utilized to enhance decision-making and boost efficiency in agricultural operations. The primary purpose of smart agriculture is to conserve resources such as water, fertilizer, and pesticides while increasing crop yields and improving food quality. It also assists farmers in being more ecologically sustainable by lowering water, fertilizer, and pesticide consumption and enhancing food security. The smart agriculture industry is predicted to expand as farmers and agricultural enterprises grasp the benefits of using technology-driven solutions. With rising food demand owing to population increase and limited resources, smart agriculture can assist in enhancing efficiency, productivity, and sustainability in the agricultural industry.
Several factors contribute to the growth of the smart agriculture market, such as the rising global population, the need for sustainable agriculture, technological advancements, government support, larger farm sizes, and increased demand for high-quality produce. Smart agricultural technology can assist farmers in increasing crop yields and improving efficiency, allowing them to fulfill the growing need for food while working with limited resources. Furthermore, governments encourage farmers to use smart agriculture technologies by providing incentives and subsidies. Finally, customers are becoming more aware of the advantages of high-quality products and are prepared to pay a higher price.
High initial costs, a lack of knowledge and education, inadequate infrastructure, data privacy and security issues, regulatory hurdles, and opposition to change can hinder the adoption of smart agricultural technology. Furthermore, farmers may be resistant to change and prefer traditional farming practices, limiting the adoption of smart agriculture practices.
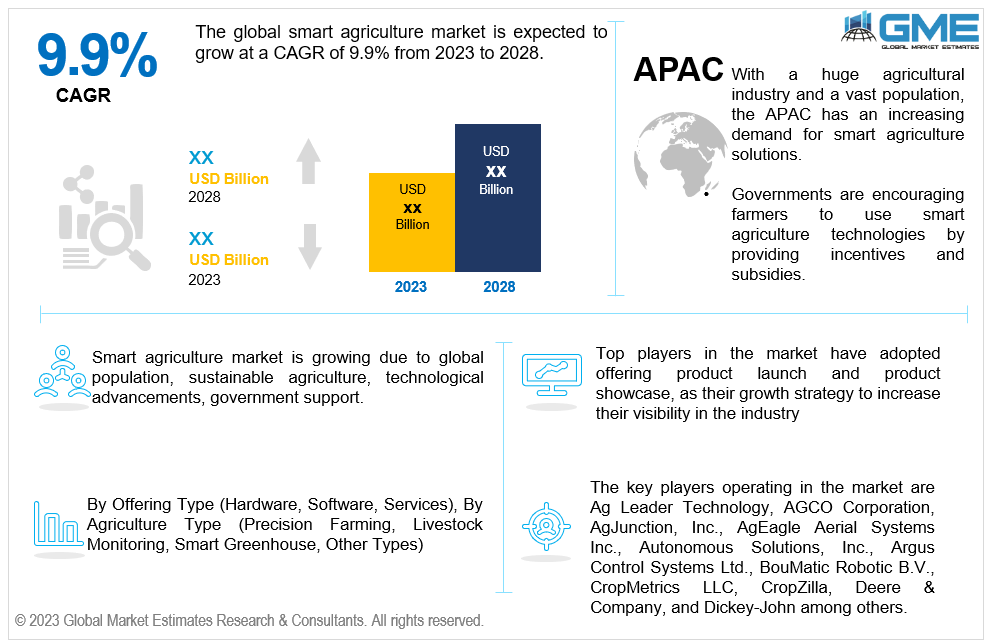
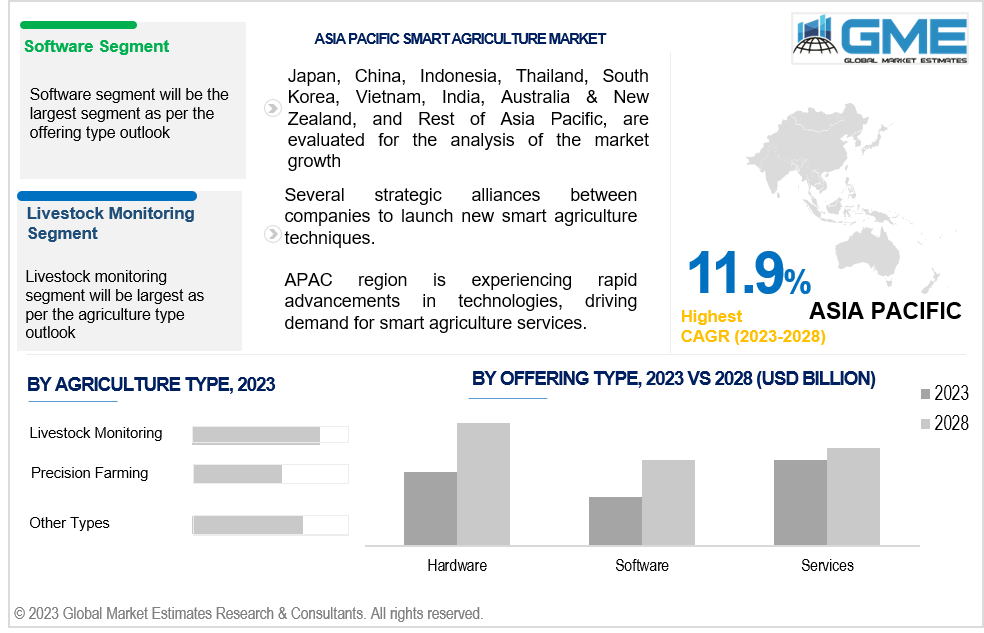
As per the offering type outlook, the software segment is expected to be the largest segment during the forecast period. Based on offering type, the market is segmented into software, hardware, and services. The software segment is expected to dominate the global smart agriculture market because of its role in gathering, managing, and interpreting data from sensors and other devices. It gives farmers real-time information about their operations, allowing them to monitor crops better, regulate irrigation, and apply fertilizers and pesticides. It may also be integrated with other technology, such as drones, autonomous vehicles, and GPS systems, to offer farmers a comprehensive perspective of their activities. This has resulted in the creation of various smart agricultural software solutions, such as farm management software, precision agriculture software, and climate monitoring software.
Based on agriculture type, the market is segmented into precision farming, livestock monitoring, smart greenhouse, and others. As per the agriculture type outlook, the livestock monitoring segment is expected to be the largest segment during the forecast period. Due to its importance in ensuring animal health and well-being, the livestock monitoring segment is the largest section in the smart agriculture industry. Smart agricultural technology such as sensors and wearables can assist farmers with real-time monitoring of their livestock's health, behaviour, and production, allowing them to discover health concerns early and avoid disease outbreaks. Furthermore, livestock contributes significantly to the global food supply, resulting in higher yields and profitability.
North America is analyzed to be the largest region in the global smart agriculture market in the forecast period. North America is home to some of the world's major agricultural-producing countries, including the United States and Canada, which have extensive farmland and strong agricultural output. North America has a well-developed infrastructure, including a solid telecommunications network and a sophisticated technology sector, allowing for the widespread implementation of smart agricultural technologies. Governments in North America have been aggressively encouraging farmers to embrace smart agricultural methods by providing financial incentives and support. Furthermore, there is a large market for high-quality produce in North America, and consumers are willing to pay a premium for food produced sustainably and environmentally friendly. Smart agricultural strategies can assist farmers in producing high-quality crops while using less resources, such as water and fertilizer.
Asia Pacific is also analyzed to be the fastest-growing region across the global smart agriculture market, with a CAGR of over 11.9%. With a huge agricultural industry and a vast population, the APAC area has an increasing demand for smart agriculture solutions. Farmers may use smart agricultural technology to boost crop yields and generate higher-quality harvests. Companies invest in developing new agricultural technologies and solutions, while governments encourage farmers to use smart agriculture technologies by providing incentives and subsidies. This assistance assists in expanding the region's smart agricultural business
The key players operating in the market are Ag Leader Technology, AGCO Corporation, AgJunction, Inc., AgEagle Aerial Systems Inc., Autonomous Solutions, Inc., Argus Control Systems Ltd., BouMatic Robotic B.V., CropMetrics LLC, CLAAS KGaA mbH, CropZilla, Deere & Company, and Dickey-John, among others.
Please note: This is not an exhaustive list of companies profiled in the report.
1 STRATEGIC INSIGHTS ON NEW REVENUE POCKETS
1.1 Strategic Opportunity & Attractiveness Analysis
1.1.1 Hot Revenue Pockets
1.1.2 Market Attractiveness Score
1.1.3 Revenue Impacting Opportunity
1.1.4 High Growing Region/Country
1.1.5 Competitor Analysis
1.1.6 Consumer Analysis
1.2 Global Market Estimates' View
1.3 Strategic Insights across Business Functions
1.3.1 For Chief Executive Officers
1.3.2 For Chief Marketing Officers
1.3.3 For Chief Strategy Officers
1.4 Evaluate the Potential of your Existing Business Lines vs. New Lines to Enter Into
2.1 Technological Adoption Rate
2.2 Current Trend Impact Analysis
2.3 Future Trend Impact Analysis
2.4 Data Metrics on Feed Stocks
3.1.2 Adjacent Market Opportunities
3.1.3 Ancillary Market Opportunities
3.2.1 Market Drivers: Impact Analysis
3.2.2 Market Restraints: Impact Analysis
3.2.3 Market OpportunIties: Impact Analysis
3.2.4 Market Challenges: Impact Analysis
3.3.1 Porter’s Five Forces Analysis
3.3.1.1 Threat of New Entrants
3.3.1.2 Threat of New Substitutes
3.3.1.3 Bargaining Power of Suppliers
3.3.1.4 Bargaining Power of Buyers
3.3.1.5 Intensity of Competitive Rivalry
3.3.2 SWOT Analysis; By Factor (Political & Legal, Economic, and Technological)
4 GLOBAL SMART AGRICULTURE MARKET, BY OFFERING TYPE
4.2 Smart Agriculture Market: Offering Type Scope Key Takeaways
4.3 Revenue Growth Analysis, 2022 & 2028
4.4.1 Hardware Market Estimates and Forecast, 2020-2028 (USD Million)
4.5.1 Software Market Estimates and Forecast, 2020-2028 (USD Million)
4.6.1 Services Market Estimates and Forecast, 2020-2028 (USD Million)
5 GLOBAL SMART AGRICULTURE MARKET, BY AGRICULTURE TYPE
5.2 Smart Agriculture Market: Agriculture Type Scope Key Takeaways
5.3 Revenue Growth Analysis, 2022 & 2028
5.4.1 Precision Farming Market Estimates And Forecast, 2020-2028 (USD Million)
5.5.1 Livestock Monitoring Market Estimates And Forecast, 2020-2028 (USD Million)
5.6.1 Smart Greenhouse Market Estimates And Forecast, 2020-2028 (USD Million)
5.7.1 Other Types Market Estimates And Forecast, 2020-2028 (USD Million)
6 GLOBAL SMART AGRICULTURE MARKET, BY REGION
6.2 North America Smart Agriculture Market Estimates and Forecast, 2020-2028 (USD Million)
6.2.3.1 U.S. Smart Agriculture Market Estimates and Forecast, 2020-2028 (USD Million)
6.2.3.2 Canada Smart Agriculture Market Estimates and Forecast, 2020-2028 (USD Million)
6.2.3.3 Mexico Smart Agriculture Market Estimates and Forecast, 2020-2028 (USD Million)
6.3 Europe Smart Agriculture Market Estimates and Forecast, 2020-2028 (USD Million)
6.3.3.1 Germany Smart Agriculture Market Estimates and Forecast, 2020-2028 (USD Million)
6.3.3.2 U.K. Smart Agriculture Market Estimates and Forecast, 2020-2028 (USD Million)
6.3.3.3 France Smart Agriculture Market Estimates and Forecast, 2020-2028 (USD Million)
6.3.3.4 Italy Smart Agriculture Market Estimates and Forecast, 2020-2028 (USD Million)
6.3.3.5 Spain Smart Agriculture Market Estimates and Forecast, 2020-2028 (USD Million)
6.3.3.6 Netherlands Smart Agriculture Market Estimates and Forecast, 2020-2028 (USD Million)
6.3.3.7 Rest of Europe Smart Agriculture Market Estimates and Forecast, 2020-2028 (USD Million)
6.4 Asia Pacific Smart Agriculture Market Estimates and Forecast, 2020-2028 (USD Million)
6.4.3.1 China Smart Agriculture Market Estimates and Forecast, 2020-2028 (USD Million)
6.4.3.2 Japan Smart Agriculture Market Estimates and Forecast, 2020-2028 (USD Million)
6.4.3.3 India Smart Agriculture Market Estimates and Forecast, 2020-2028 (USD Million)
6.4.3.4 South Korea Smart Agriculture Market Estimates and Forecast, 2020-2028 (USD Million)
6.4.3.5 Singapore Smart Agriculture Market Estimates and Forecast, 2020-2028 (USD Million)
6.4.3.6 Malaysia Smart Agriculture Market Estimates and Forecast, 2020-2028 (USD Million)
6.4.3.7 Thailand Smart Agriculture Market Estimates and Forecast, 2020-2028 (USD Million)
6.4.3.8 Indonesia Smart Agriculture Market Estimates and Forecast, 2020-2028 (USD Million)
6.4.3.9 Vietnam Smart Agriculture Market Estimates and Forecast, 2020-2028 (USD Million)
6.4.3.10 Taiwan Smart Agriculture Market Estimates and Forecast, 2020-2028 (USD Million)
6.4.3.10.2 By Agriculture Type
6.4.3.11.2 By Agriculture Type
6.5 Middle East and Africa Smart Agriculture Market Estimates and Forecast, 2020-2028 (USD Million)
6.5.3.1 Saudi Arabia Smart Agriculture Market Estimates and Forecast, 2020-2028 (USD Million)
6.5.3.2 U.A.E. Smart Agriculture Market Estimates and Forecast, 2020-2028 (USD Million)
6.5.3.3 Israel Smart Agriculture Market Estimates and Forecast, 2020-2028 (USD Million)
6.5.3.4 South Africa Smart Agriculture Market Estimates and Forecast, 2020-2028 (USD Million)
6.6 Central & South America Smart Agriculture Market Estimates and Forecast, 2020-2028 (USD Million)
6.6.3.1 Brazil Smart Agriculture Market Estimates and Forecast, 2020-2028 (USD Million)
6.6.3.2 Argentina Smart Agriculture Market Estimates and Forecast, 2020-2028 (USD Million)
6.6.3.3 Chile Smart Agriculture Market Estimates and Forecast, 2020-2028 (USD Million)
7.1 Company Market Share Analysis
7.2 Four Quadrant Positioning Matrix
7.4.1.1 Business Description & Financial Analysis
7.4.1.3 Products & Services Offered
7.4.1.4 Strategic Alliances between Business Partners
7.4.2.1 Business Description & Financial Analysis
7.4.2.3 Products & Services Offered
7.4.2.4 Strategic Alliances between Business Partners
7.4.3.1 Business Description & Financial Analysis
7.4.3.3 Products & Services Offered
7.4.3.4 Strategic Alliances between Business Partners
7.4.4 AgEagle Aerial Systems Inc.
7.4.4.1 Business Description & Financial Analysis
7.4.4.3 Products & Services Offered
7.4.4.4 Strategic Alliances between Business Partners
7.4.5 Autonomous Solutions, Inc.
7.4.5.1 Business Description & Financial Analysis
7.4.5.3 Products & Services Offered
7.4.5.4 Strategic Alliances between Business Partners
7.4.6 Argus Control Systems Ltd
7.4.6.1 Business Description & Financial Analysis
7.4.6.3 Products & Services Offered
7.4.6.4 Strategic Alliances between Business Partners
7.4.7.1 Business Description & Financial Analysis
7.4.7.3 Products & Services Offered
7.4.7.4 Strategic Alliances between Business Partners
7.4.8.1 Business Description & Financial Analysis
7.4.8.3 Products & Services Offered
7.4.8.4 Strategic Alliances between Business Partners
7.4.9.1 Business Description & Financial Analysis
7.4.9.3 Products & Services Offered
7.4.9.4 Strategic Alliances between Business Partners
7.4.10.1 Business Description & Financial Analysis
7.4.10.3 Products & Services Offered
7.4.10.4 Strategic Alliances between Business Partners
8.1.2 Market Scope & Segmentation
8.2.1.2 GMEs Internal Data Repository
8.2.1.3 Secondary Resources & Third Party Perspectives
8.2.1.4 Company Information Sources
8.2.2.1 Various Types of Respondents for Primary Interviews
8.2.2.2 Number of Interviews Conducted throughout the Research Process
8.2.2.4 Discussion Guide for Primary Participants
8.2.3.1 Expert Panels Across 30+ Industry
8.2.4.1 Paid Local Experts Across 30+ Industry Across each Region
8.3.1.1 Macro-Economic Indicators Considered
8.3.1.2 Micro-Economic Indicators Considered
8.3.2.1 Company Share Analysis Approach
8.3.2.2 Estimation of Potential Product Sales
8.4.2 Time Series, Cross Sectional & Panel Data Analysis
8.5.1 Inhouse AI Based Real Time Analytics Tool
8.5.2 Output From Desk & Primary Research
8.6 Research Assumptions & Limitations
LIST OF TABLES
1 Global Smart Agriculture Market, By Offering Type, 2020-2028 (USD Mllion)
2 Hardware Market, By Region, 2020-2028 (USD Mllion)
3 Software Market, By Region, 2020-2028 (USD Mllion)
4 Services Market, By Region, 2020-2028 (USD Mllion)
5 Global Smart Agriculture Market, By Agriculture Type, 2020-2028 (USD Mllion)
6 Precision Farming Market, By Region, 2020-2028 (USD Mllion)
7 Livestock Monitoring Market, By Region, 2020-2028 (USD Mllion)
8 Smart Greenhouse Market, By Region, 2020-2028 (USD Mllion)
9 Other Types Market, By Region, 2020-2028 (USD Mllion)
10 Regional Analysis, 2020-2028 (USD Mllion)
11 North America Smart Agriculture Market, By Offering Type, 2020-2028 (USD Mllion)
12 North America Smart Agriculture Market, By Agriculture Type, 2020-2028 (USD Mllion)
13 U.S. Smart Agriculture Market, By Offering Type, 2020-2028 (USD Mllion)
14 U.S. Smart Agriculture Market, By Agriculture Type, 2020-2028 (USD Mllion)
15 Canada Smart Agriculture Market, By Offering Type, 2020-2028 (USD Mllion)
16 Canada Smart Agriculture Market, By Agriculture Type, 2020-2028 (USD Mllion)
17 Mexico Smart Agriculture Market, By Offering Type, 2020-2028 (USD Mllion)
18 Mexico Smart Agriculture Market, By Agriculture Type, 2020-2028 (USD Mllion)
19 Europe Smart Agriculture Market, By Offering Type, 2020-2028 (USD Mllion)
20 Europe Smart Agriculture Market, By Agriculture Type, 2020-2028 (USD Mllion)
21 Germany Smart Agriculture Market, By Offering Type, 2020-2028 (USD Mllion)
22 Germany Smart Agriculture Market, By Agriculture Type, 2020-2028 (USD Mllion)
23 U.K. Smart Agriculture Market, By Offering Type, 2020-2028 (USD Mllion)
24 U.K. Smart Agriculture Market, By Agriculture Type, 2020-2028 (USD Mllion)
25 France Smart Agriculture Market, By Offering Type, 2020-2028 (USD Mllion)
26 France Smart Agriculture Market, By Agriculture Type, 2020-2028 (USD Mllion)
27 Italy Smart Agriculture Market, By Offering Type, 2020-2028 (USD Mllion)
28 Italy Smart Agriculture Market, By Agriculture Type, 2020-2028 (USD Mllion)
29 Spain Smart Agriculture Market, By Offering Type, 2020-2028 (USD Mllion)
30 Spain Smart Agriculture Market, By Agriculture Type, 2020-2028 (USD Mllion)
31 Netherlands Smart Agriculture Market, By Offering Type, 2020-2028 (USD Mllion)
32 Netherlands Smart Agriculture Market, By Agriculture Type, 2020-2028 (USD Mllion)
33 Rest Of Europe Smart Agriculture Market, By Offering Type, 2020-2028 (USD Mllion)
34 Rest Of Europe Smart Agriculture Market, By Agriculture Type, 2020-2028 (USD Mllion)
35 Asia Pacific Smart Agriculture Market, By Offering Type, 2020-2028 (USD Mllion)
36 Asia Pacific Smart Agriculture Market, By Agriculture Type, 2020-2028 (USD Mllion)
37 China Smart Agriculture Market, By Offering Type, 2020-2028 (USD Mllion)
38 China Smart Agriculture Market, By Agriculture Type, 2020-2028 (USD Mllion)
39 Japan Smart Agriculture Market, By Offering Type, 2020-2028 (USD Mllion)
40 Japan Smart Agriculture Market, By Agriculture Type, 2020-2028 (USD Mllion)
41 India Smart Agriculture Market, By Offering Type, 2020-2028 (USD Mllion)
42 India Smart Agriculture Market, By Agriculture Type, 2020-2028 (USD Mllion)
43 South Korea Smart Agriculture Market, By Offering Type, 2020-2028 (USD Mllion)
44 South Korea Smart Agriculture Market, By Agriculture Type, 2020-2028 (USD Mllion)
45 Singapore Smart Agriculture Market, By Offering Type, 2020-2028 (USD Mllion)
46 Singapore Smart Agriculture Market, By Agriculture Type, 2020-2028 (USD Mllion)
47 Thailand Smart Agriculture Market, By Offering Type, 2020-2028 (USD Mllion)
48 Thailand Smart Agriculture Market, By Agriculture Type, 2020-2028 (USD Mllion)
49 Malaysia Smart Agriculture Market, By Offering Type, 2020-2028 (USD Mllion)
50 Malaysia Smart Agriculture Market, By Agriculture Type, 2020-2028 (USD Mllion)
51 Indonesia Smart Agriculture Market, By Offering Type, 2020-2028 (USD Mllion)
52 Indonesia Smart Agriculture Market, By Agriculture Type, 2020-2028 (USD Mllion)
53 Vietnam Smart Agriculture Market, By Offering Type, 2020-2028 (USD Mllion)
54 Vietnam Smart Agriculture Market, By Agriculture Type, 2020-2028 (USD Mllion)
55 Taiwan Smart Agriculture Market, By Offering Type, 2020-2028 (USD Mllion)
56 Taiwan Smart Agriculture Market, By Agriculture Type, 2020-2028 (USD Mllion)
57 Rest of APAC Smart Agriculture Market, By Offering Type, 2020-2028 (USD Mllion)
58 Rest of APAC Smart Agriculture Market, By Agriculture Type, 2020-2028 (USD Mllion)
59 Middle East and Africa Smart Agriculture Market, By Offering Type, 2020-2028 (USD Mllion)
60 Middle East and Africa Smart Agriculture Market, By Agriculture Type, 2020-2028 (USD Mllion)
61 Saudi Arabia Smart Agriculture Market, By Offering Type, 2020-2028 (USD Mllion)
62 Saudi Arabia Smart Agriculture Market, By Agriculture Type, 2020-2028 (USD Mllion)
63 UAE Smart Agriculture Market, By Offering Type, 2020-2028 (USD Mllion)
64 UAE Smart Agriculture Market, By Agriculture Type, 2020-2028 (USD Mllion)
65 Israel Smart Agriculture Market, By Offering Type, 2020-2028 (USD Mllion)
66 Israel Smart Agriculture Market, By Agriculture Type, 2020-2028 (USD Mllion)
67 South Africa Smart Agriculture Market, By Offering Type, 2020-2028 (USD Mllion)
68 South Africa Smart Agriculture Market, By Agriculture Type, 2020-2028 (USD Mllion)
69 Rest Of Middle East and Africa Smart Agriculture Market, By Offering Type, 2020-2028 (USD Mllion)
70 Rest Of Middle East and Africa Smart Agriculture Market, By Agriculture Type, 2020-2028 (USD Mllion)
71 Central & South America Smart Agriculture Market, By Offering Type, 2020-2028 (USD Mllion)
72 Central & South America Smart Agriculture Market, By Agriculture Type, 2020-2028 (USD Mllion)
73 Brazil Smart Agriculture Market, By Offering Type, 2020-2028 (USD Mllion)
74 Brazil Smart Agriculture Market, By Agriculture Type, 2020-2028 (USD Mllion)
75 Chile Smart Agriculture Market, By Offering Type, 2020-2028 (USD Mllion)
76 Chile Smart Agriculture Market, By Agriculture Type, 2020-2028 (USD Mllion)
77 Argentina Smart Agriculture Market, By Offering Type, 2020-2028 (USD Mllion)
78 Argentina Smart Agriculture Market, By Agriculture Type, 2020-2028 (USD Mllion)
79 Rest Of Central & South America Smart Agriculture Market, By Offering Type, 2020-2028 (USD Mllion)
80 Rest Of Central & South America Smart Agriculture Market, By Agriculture Type, 2020-2028 (USD Mllion)
81 Ag Leader Technology : Products & Services Offering
82 AGCO Corporation: Products & Services Offering
83 AgJunction, Inc.: Products & Services Offering
84 AgEagle Aerial Systems Inc.: Products & Services Offering
85 Autonomous Solutions, Inc.: Products & Services Offering
86 ARGUS CONTROL SYSTEMS LTD: Products & Services Offering
87 BouMatic Robotic B.V. : Products & Services Offering
88 CropMetrics LLC: Products & Services Offering
89 Deere & Company, Inc: Products & Services Offering
90 Other Companies: Products & Services Offering
LIST OF FIGURES
1 Global Smart Agriculture Market Overview
2 Global Smart Agriculture Market Value From 2020-2028 (USD Mllion)
3 Global Smart Agriculture Market Share, By Offering Type (2022)
4 Global Smart Agriculture Market Share, By Agriculture Type (2022)
5 Global Smart Agriculture Market, By Region (Asia Pacific Market)
6 Technological Trends In Global Smart Agriculture Market
7 Four Quadrant Competitor Positioning Matrix
8 Impact Of Macro & Micro Indicators On The Market
9 Impact Of Key Drivers On The Global Smart Agriculture Market
10 Impact Of Challenges On The Global Smart Agriculture Market
11 Porter’s Five Forces Analysis
12 Global Smart Agriculture Market: By Offering Type Scope Key Takeaways
13 Global Smart Agriculture Market, By Offering Type Segment: Revenue Growth Analysis
14 Hardware Market, By Region, 2020-2028 (USD Mllion)
15 Software Market, By Region, 2020-2028 (USD Mllion)
16 Services Market, By Region, 2020-2028 (USD Mllion)
17 Global Smart Agriculture Market: By Agriculture Type Scope Key Takeaways
18 Global Smart Agriculture Market, By Agriculture Type Segment: Revenue Growth Analysis
19 Precision Farming Market, By Region, 2020-2028 (USD Mllion)
20 Livestock Monitoring Market, By Region, 2020-2028 (USD Mllion)
21 Smart Greenhouse Market, By Region, 2020-2028 (USD Mllion)
22 Other Types Market, By Region, 2020-2028 (USD Mllion)
23 Regional Segment: Revenue Growth Analysis
24 Global Smart Agriculture Market: Regional Analysis
25 North America Smart Agriculture Market Overview
26 North America Smart Agriculture Market, By Offering Type
27 North America Smart Agriculture Market, By Agriculture Type
28 North America Smart Agriculture Market, By Country
29 U.S. Smart Agriculture Market, By Offering Type
30 U.S. Smart Agriculture Market, By Agriculture Type
31 Canada Smart Agriculture Market, By Offering Type
32 Canada Smart Agriculture Market, By Agriculture Type
33 Mexico Smart Agriculture Market, By Offering Type
34 Mexico Smart Agriculture Market, By Agriculture Type
35 Four Quadrant Positioning Matrix
36 Company Market Share Analysis
37 Ag Leader Technology : Company Snapshot
38 Ag Leader Technology : SWOT Analysis
39 Ag Leader Technology : Geographic Presence
40 AGCO Corporation: Company Snapshot
41 AGCO Corporation: SWOT Analysis
42 AGCO Corporation: Geographic Presence
43 AgJunction, Inc.: Company Snapshot
44 AgJunction, Inc.: SWOT Analysis
45 AgJunction, Inc.: Geographic Presence
46 AgEagle Aerial Systems Inc.: Company Snapshot
47 AgEagle Aerial Systems Inc.: Swot Analysis
48 AgEagle Aerial Systems Inc.: Geographic Presence
49 Autonomous Solutions, Inc.: Company Snapshot
50 Autonomous Solutions, Inc.: SWOT Analysis
51 Autonomous Solutions, Inc.: Geographic Presence
52 Argus Control Systems Ltd: Company Snapshot
53 Argus Control Systems Ltd: SWOT Analysis
54 Argus Control Systems Ltd: Geographic Presence
55 BouMatic Robotic B.V. : Company Snapshot
56 BouMatic Robotic B.V. : SWOT Analysis
57 BouMatic Robotic B.V. : Geographic Presence
58 CropMetrics LLC: Company Snapshot
59 CropMetrics LLC: SWOT Analysis
60 CropMetrics LLC: Geographic Presence
61 Deere & Company, Inc.: Company Snapshot
62 Deere & Company, Inc.: SWOT Analysis
63 Deere & Company, Inc.: Geographic Presence
64 Other Companies: Company Snapshot
65 Other Companies: SWOT Analysis
66 Other Companies: Geographic Presence
The Global Smart Agriculture Market has been studied from the year 2019 till 2028. However, the CAGR provided in the report is from the year 2023 to 2028. The research methodology involved three stages: Desk research, Primary research, and Analysis & Output from the entire research process.

The desk research involved a robust background study which meant referring to paid and unpaid databases to understand the market dynamics; mapping contracts from press releases; identifying the key players in the market, studying their product portfolio, competition level, annual reports/SEC filings & investor presentations; and learning the demand and supply-side analysis for the Smart Agriculture Market.

The primary research activity included telephonic conversations with more than 50 tier 1 industry consultants, distributors, and end-use product manufacturers.

Finally, based on the above thorough research process, an in-depth analysis was carried out considering the following aspects: market attractiveness, current & future market trends, market share analysis, SWOT analysis of the company and customer analytics.

Frequently Asked Questions

This FREE sample includes market data points, ranging from trend analyses to market estimates & forecasts. See for yourself.
Or view our licence options:
Tailor made solutions just for you
80% of our clients seek made-to-order reports. How do you want us to tailor yours?
OUR CLIENTS


