This report was recently updated on August 14 2025 with the latest and most recent
market numbers
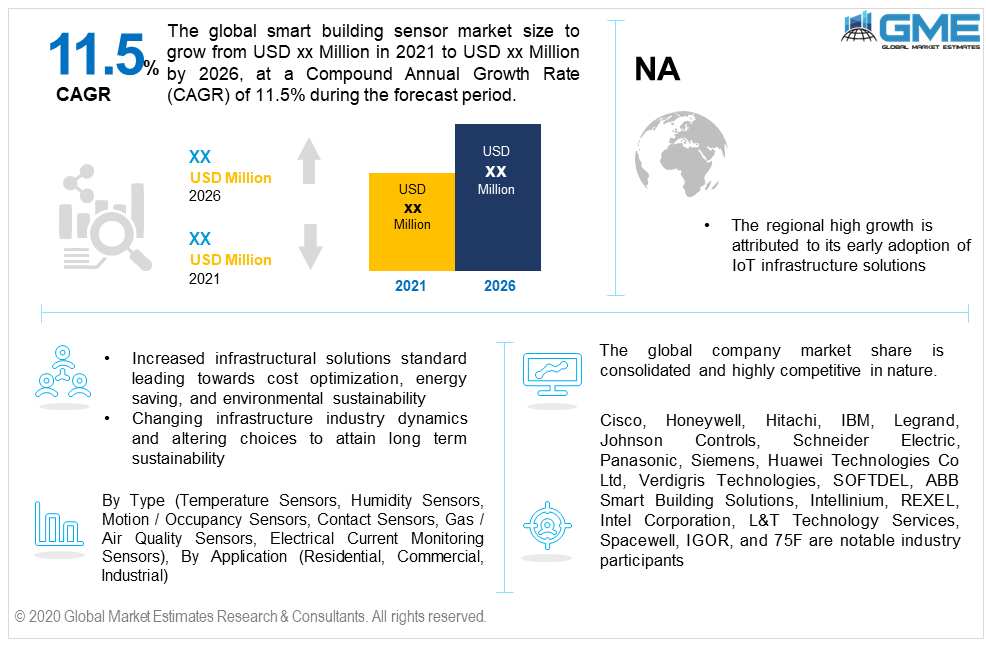
Global Smart Building Sensor Market Size, Trends & Analysis - Forecasts to 2026 By Type (Temperature Sensors, Humidity Sensors, Motion / Occupancy Sensors, Contact Sensors, Gas / Air Quality Sensors, Electrical Current Monitoring Sensors), By Application (Residential, Commercial, Industrial), By Region (North America, Asia Pacific, Europe, Latin America, Middle East & Africa); End-User Landscape, Company Market Share Analysis, and Competitor Analysis
Increased infrastructural solutions standards leading towards cost optimization, energy-saving, and environmental sustainability will drive the smart building sensors market growth. The rising deployment of IoT-enabled solutions in the commercial and industrial infrastructure along with the increasing necessity to adopt energy-efficient systems will support the product penetration.
The global smart building sensor market size will witness over 11.5% CAGR up to 2026, wherein North America dominated the overall demand in 2020. Stringent regulatory compliance related to the indoor air quality, temperature, and inside environment has forced the installation of these devices in the commercial and industrial infrastructure. The products are also gaining high penetration in the residential sector owing to the introduction of new products specifically made for residential applications. Now, the consumers are more cautious towards energy efficiency, environmental safety, and technological advancements.
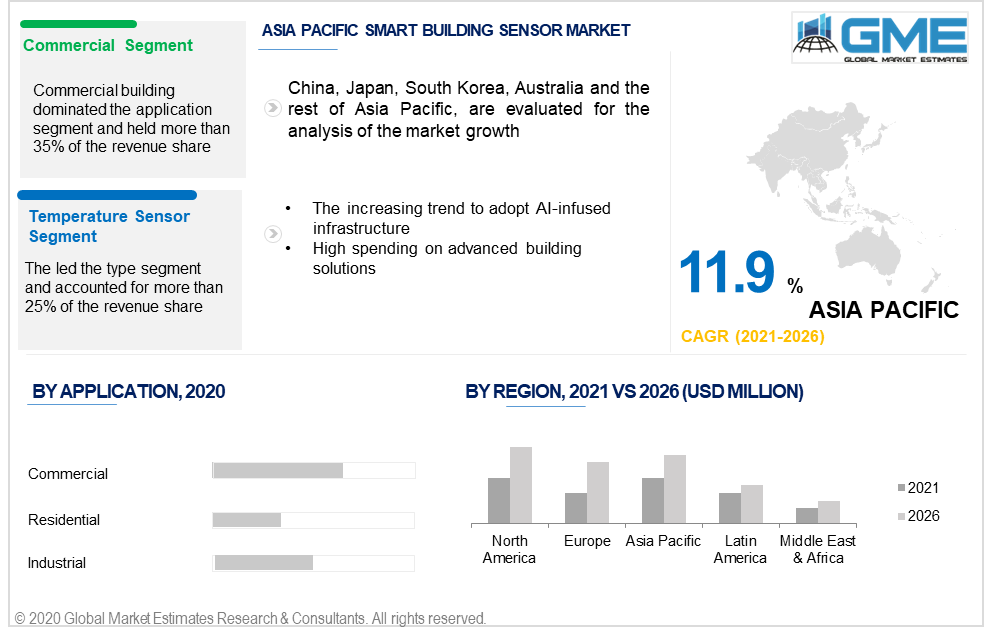
The type segment is categorized into temperature, humidity, motion/occupancy, contact, gas/air quality, and electrical current monitoring sensors. The temperature and humidity devices led the type segment and together accounted for more than 45% of the industry share in 2020. The necessity to control the temperature and humidity in commercial and industrial buildings to maintain a balanced atmosphere is the major success factor to drive demand for these devices. It is essential to maintain, check, and control the heating, cooling, and ventilation of commercial infrastructures such as offices, hospitals, and hotels.
Motion detectors include various solutions such as desk occupancy, table occupancy, room occupancy, and people flow. This product helps the users to identify and optimize space management and helps in cost savings.
Gas/ air quality detectors are largely deployed in industrial infrastructures for safety purposes. These products are installed to detect toxic and hazardous gases to prevent any fatality and property loss. The other key factor to influence demand for these detectors is the increasing company’s investment towards environmental monitoring and provide a healthy working environment.
Controlling and monitoring devices related to water quality, smoke, chemical, and pressure are projected to gain high popularity in the coming years.
Major applications in the industry include residential, commercial, and industrial infrastructure. The commercial sector led the application segment and accounted for approximately 35% of the demand in 2020. Early adoption, high penetration, and large budget allocation were the major reasons to induce demand in this segment.
Increasing demand for advanced devices to attain sustainability in terms of communication, monitoring, and energy conservation are other important aspects to engage a high deployment rate.
The residential applications will witness significant gains of more than 9.8% from 2021 to 2026. Rising consumer preference to invest in technologically advanced products along with increasing affordability will support the growth in this segment.
North America will lead the global demand and is expected to account for more than 35% of the revenue share by 2026. The regional high growth is attributed to its early adoption of IoT infrastructure solutions. The U.S. is among the leading nations to deploy artificial intelligence products and solutions to optimize energy saving, operational cost, and infrastructure sustainability. Stringent government regulations to improve energy efficiency, air quality, better contact, and temperature control have positively induced regional demand.
The Asia Pacific will observe the fastest CAGR of 11.9% from 2021 to 2026. The increasing trend to adopt AI-infused infrastructure along with increased spending on advanced construction solutions will support the regional industry growth. China, Japan, South Korea, and India are expected to lead the regional demand owing to their high capacity to invest in IT infrastructure solutions.
The European market is likely to observe significant gains from 2021 to 2026. The region is highly technology-oriented and is expected to hold huge potential during the forecast period. Rising remodeling and renovation activities will proliferate the regional demand.
The Middle East & Africa is likely to observe more than 10% CAGR during the forecast period. Increased premium housing construction which is IoT enabled along with high penetration of advanced solutions related to temperature, humidity, energy efficiency, and monitoring will fuel the regional industry expansion.
Cisco, Honeywell, Hitachi, IBM, Legrand, Johnson Controls, Schneider Electric, Panasonic, Siemens, Huawei Technologies Co Ltd, Verdigris Technologies, SOFTDEL, ABB Smart Building Solutions, Intellinium, REXEL, Intel Corporation, L&T Technology Services, Spacewell, IGOR, and 75F are notable industry participants.
Please note: This is not an exhaustive list of companies profiled in the report.
The global company revenue share is highly consolidated and competitive in nature. Brand recognition and reliability were the major factors towards the market consolidation. As of now, the top 7 players held over 60% of the revenue generation in 2020. Collaboration and mergers & acquisitions with the tech start-up companies were the prime strategies witnessed in the industry.
Enhancing product reach through long-term conglomeration with the end-users will be the key strategy adopted in the future. Companies are heavily investing in product awareness and knowledge programs.
Chapter 1 Methodology
1.1 Market scope & definitions
1.2 Estimates & forecast calculation
1.3 Historical data overview and validation
1.4 Data sources
1.4.1 Secondary
1.4.2 Primary
Chapter 2 Report Outlook
2.1 Smart Building Sensor industry overview, 2019-2026
2.1.1 Industry overview
2.1.2 Type overview
2.1.3 Application overview
2.1.4 Regional overview
Chapter 3 Smart Building Sensor Market Trends
3.1 Market segmentation
3.2 Industry background, 2019-2026
3.3 Market key trends
3.3.1 Positive trends
3.3.2 Industry challenges
3.4 Prospective growth scenario
3.4.1 Product growth scenario
3.5 Industry influence over product growth
3.6 Porter’s analysis
3.7 PESTEL analysis
3.8 Value chain & supply chain analysis
3.9 Regulatory framework
3.9.1 North America
3.9.2 Europe
3.9.3 APAC
3.9.4 LATAM
3.9.5 MEA
3.10 Technology overview
3.11 Market share analysis, 2020
3.11.1 Company positioning overview, 2020
Chapter 4 Smart Building Sensor Market, By Type
4.1 Product Outlook
4.2 Temperature sensors
4.2.1 Market size, by region, 2019-2026 (USD Million)
4.3 Humidity sensors
4.3.1 Market size, by region, 2019-2026 (USD Million)
4.4 Motion / occupancy sensors
4.4.1 Market size, by region, 2019-2026 (USD Million)
4.5 Contact sensors
4.5.1 Market size, by region, 2019-2026 (USD Million)
4.6 Gas / air quality sensors
4.6.1 Market size, by region, 2019-2026 (USD Million)
4.7 Electrical current monitoring sensors
4.7.1 Market size, by region, 2019-2026 (USD Million)
4.8 Others
4.8.1 Market size, by region, 2019-2026 (USD Million)
Chapter 5 Smart Building Sensor Market, By Application
5.1 Application Outlook
5.2 Residential
5.2.1 Market size, by region, 2019-2026 (USD Million)
5.3 Commercial
5.3.1 Market size, by region, 2019-2026 (USD Million)
5.4 Industrial
5.4.1 Market size, by region, 2019-2026 (USD Million)
5.5 Others
5.5.1 Market size, by region, 2019-2026 (USD Million)
Chapter 6 Smart Building Sensor Market, By Region
6.1 Regional outlook
6.2 North America
6.2.1 Market size, by country 2019-2026 (USD Million)
6.2.2 Market size, by type, 2019-2026 (USD Million)
6.2.3 Market size, by application, 2019-2026 (USD Million)
6.2.4 U.S.
6.2.4.1 Market size, by type, 2019-2026 (USD Million)
6.2.4.2 Market size, by application, 2019-2026 (USD Million)
6.2.5 Canada
6.2.5.1 Market size, by type, 2019-2026 (USD Million)
6.2.5.2 Market size, by application, 2019-2026 (USD Million)
6.3 Europe
6.3.1 Market size, by country 2019-2026 (USD Million)
6.3.2 Market size, by type, 2019-2026 (USD Million)
6.3.3 Market size, by application, 2019-2026 (USD Million)
6.3.4 Germany
6.2.4.1 Market size, by type, 2019-2026 (USD Million)
6.2.4.2 Market size, by application, 2019-2026 (USD Million)
6.3.5 UK
6.3.5.1 Market size, by type, 2019-2026 (USD Million)
6.3.5.2 Market size, by application, 2019-2026 (USD Million)
6.3.6 France
6.3.6.1 Market size, by type, 2019-2026 (USD Million)
6.3.6.2 Market size, by application, 2019-2026 (USD Million)
6.3.7 Italy
6.3.7.1 Market size, by type, 2019-2026 (USD Million)
6.3.7.2 Market size, by application, 2019-2026 (USD Million)
6.3.8 Spain
6.3.8.1 Market size, by type, 2019-2026 (USD Million)
6.3.8.2 Market size, by application, 2019-2026 (USD Million)
6.3.9 Russia
6.3.9.1 Market size, by type, 2019-2026 (USD Million)
6.3.9.2 Market size, by application, 2019-2026 (USD Million)
6.4 Asia Pacific
6.4.1 Market size, by country 2019-2026 (USD Million)
6.4.2 Market size, by type, 2019-2026 (USD Million)
6.4.3 Market size, by application, 2019-2026 (USD Million)
6.4.4 China
6.4.4.1 Market size, by type, 2019-2026 (USD Million)
6.4.4.2 Market size, by application, 2019-2026 (USD Million)
6.4.5 Japan
6.4.5.1 Market size, by type, 2019-2026 (USD Million)
6.4.5.2 Market size, by application, 2019-2026 (USD Million)
6.4.6 Australia
6.4.6.1 Market size, by type, 2019-2026 (USD Million)
6.4.6.2 Market size, by application, 2019-2026 (USD Million)
6.4.7 India
6.4.7.1 Market size, by type, 2019-2026 (USD Million)
6.4.7.2 Market size, by application, 2019-2026 (USD Million)
6.4.8 South Korea
6.4.8.1 Market size, by type, 2019-2026 (USD Million)
6.4.8.2 Market size, by application, 2019-2026 (USD Million)
6.5 Latin America
6.5.1 Market size, by country 2019-2026 (USD Million)
6.5.2 Market size, by type, 2019-2026 (USD Million)
6.5.3 Market size, by application, 2019-2026 (USD Million)
6.5.4 Brazil
6.5.4.1 Market size, by type, 2019-2026 (USD Million)
6.5.4.2 Market size, by application, 2019-2026 (USD Million)
6.5.5 Mexico
6.5.5.1 Market size, by type, 2019-2026 (USD Million)
6.5.5.2 Market size, by application, 2019-2026 (USD Million)
6.6 MEA
6.6.1 Market size, by country 2019-2026 (USD Million)
6.6.2 Market size, by type, 2019-2026 (USD Million)
6.6.3 Market size, by application, 2019-2026 (USD Million)
6.6.4 Saudi Arabia
6.6.4.1 Market size, by type, 2019-2026 (USD Million)
6.6.4.2 Market size, by application, 2019-2026 (USD Million)
6.6.5 UAE
6.6.5.1 Market size, by type, 2019-2026 (USD Million)
6.6.5.2 Market size, by application, 2019-2026 (USD Million)
Chapter 7 Company Landscape
7.1 Competitive analysis, 2020
7.2 Cisco
7.2.1 Company overview
7.2.2 Financial analysis
7.2.3 Strategic positioning
7.2.4 Info graphic analysis
7.3 Hitachi
7.3.1 Company overview
7.3.2 Financial analysis
7.3.3 Strategic positioning
7.3.4 Info graphic analysis
7.4 Honeywell
7.4.1 Company overview
7.4.2 Financial analysis
7.4.3 Strategic positioning
7.4.4 Info graphic analysis
7.5 IBM
7.5.1 Company overview
7.5.2 Financial analysis
7.5.3 Strategic positioning
7.5.4 Info graphic analysis
7.6 Johnson Controls
7.6.1 Company overview
7.6.2 Financial analysis
7.6.3 Strategic positioning
7.6.4 Info graphic analysis
7.7 Legrand
7.7.1 Company overview
7.7.2 Financial analysis
7.7.3 Strategic positioning
7.7.4 Info graphic analysis
7.8 Panasonic
7.8.1 Company overview
7.8.2 Financial analysis
7.8.3 Strategic positioning
7.8.4 Info graphic analysis
7.9 Schneider Electric
7.9.1 Company overview
7.9.2 Financial analysis
7.9.3 Strategic positioning
7.9.4 Info graphic analysis
7.10 Siemens
7.10.1 Company overview
7.10.2 Financial analysis
7.10.3 Strategic positioning
7.10.4 Info graphic analysis
7.11 Verdigris Technologies
7.11.1 Company overview
7.11.2 Financial analysis
7.11.3 Strategic positioning
7.11.4 Info graphic analysis
7.12 Huawei Technologies Co Ltd
7.12.1 Company overview
7.12.2 Financial analysis
7.12.3 Strategic positioning
7.12.4 Info graphic analysis
7.13 ABB Smart Building Solutions
7.13.1 Company overview
7.13.2 Financial analysis
7.13.3 Strategic positioning
7.13.4 Info graphic analysis
7.14 SOFTDEL
7.14.1 Company overview
7.14.2 Financial analysis
7.14.3 Strategic positioning
7.14.4 Info graphic analysis
7.15 Intellinium
7.15.1 Company overview
7.15.2 Financial analysis
7.15.3 Strategic positioning
7.15.4 Info graphic analysis
7.16 INTEL CORPORATION
7.16.1 Company overview
7.16.2 Financial analysis
7.16.3 Strategic positioning
7.16.4 Info graphic analysis
7.17 REXEL
7.17.1 Company overview
7.17.2 Financial analysis
7.17.3 Strategic positioning
7.17.4 Info graphic analysis
The Global Smart Building Sensor Market has been studied from the year 2019 till 2026. However, the CAGR provided in the report is from the year 2021 to 2026. The research methodology involved three stages: Desk research, Primary research, and Analysis & Output from the entire research process.

The desk research involved a robust background study which meant referring to paid and unpaid databases to understand the market dynamics; mapping contracts from press releases; identifying the key players in the market, studying their product portfolio, competition level, annual reports/SEC filings & investor presentations; and learning the demand and supply-side analysis for the Smart Building Sensor Market.

The primary research activity included telephonic conversations with more than 50 tier 1 industry consultants, distributors, and end-use product manufacturers.

Finally, based on the above thorough research process, an in-depth analysis was carried out considering the following aspects: market attractiveness, current & future market trends, market share analysis, SWOT analysis of the company and customer analytics.

Frequently Asked Questions

This FREE sample includes market data points, ranging from trend analyses to market estimates & forecasts. See for yourself.
Or view our licence options:
Tailor made solutions just for you
80% of our clients seek made-to-order reports. How do you want us to tailor yours?
OUR CLIENTS


