This report was recently updated on June 27 2025 with the latest and most recent
market numbers
Global Smart Connected Vessels Market Size, Trends & Analysis - Forecasts to 2029 By Application Type (Vessel Traffic Management, Fleet Operations, and Fleet Health Monitoring), By Type (Hardware and Software), and By Region (North America, Asia Pacific, Central and South America, Europe, and Middle East and Africa), Competitive Landscape, Company Market Share Analysis, and End User Analysis
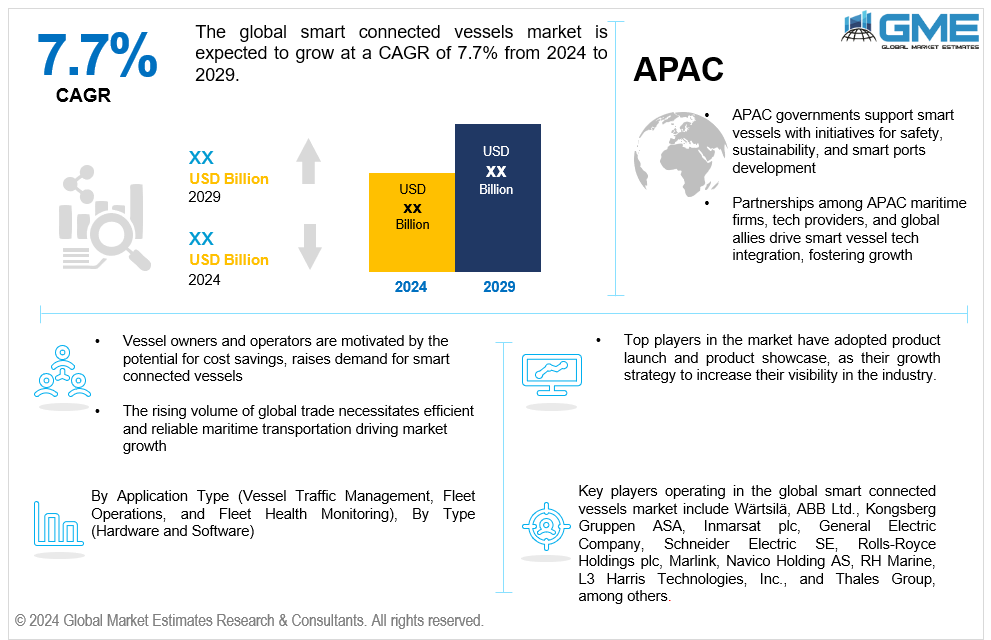
The global smart connected vessels market is expected to grow at a CAGR of 7.7% from 2024 to 2029. Smart connected vessels are ships and maritime vehicles with advanced technologies and connectivity solutions. These technologies help improve their efficiency, safety, and overall performance. The usage of interconnected sensors, devices, and communication systems in these vessels aids in collecting and exchanging real-time data. This data allows for the monitoring and management of navigation, engine performance, fuel consumption, cargo conditions, and more. By IoT devices, satellite communication, and data analytics, smart connected vessels optimize their operations while enabling predictive maintenance of the vessels. This connectivity not only enhances the safety and reliability of transportation but also leads to cost savings and fuel efficiency improvements and contributes to environmental sustainability in the shipping industry.
Many market drivers positively affect the growth of the global smart connected vessels market. Increasing emphasis on maritime safety and security is a significant driver for the adoption of smart connected vessel technologies. These solutions provide real-time monitoring of vessel conditions, navigation, and cargo, enhancing safety protocols and risk management. Smart connected vessels offer improved operational efficiency through data-driven insights, predictive maintenance, and optimization of fuel consumption. Vessel operators seek these technologies to streamline and optimize operations while reducing downtime. Vessel owners and operators are motivated by the potential for cost savings achieved through fuel efficiency, optimized routes, and predictive maintenance. Smart connected vessels are an optimal investment for many parties due to their ability to reduce operational costs. The increasing volume of global trade necessitates efficient and reliable maritime transportation. Smart connected vessels facilitate real-time communication, tracking, and coordination, thereby supporting the growing demands of the global shipping and logistics industry.
The global smart connected vessels market faces notable market restraints. The implementation of smart connected vessel technologies involves significant upfront costs for the installation of sensors, communication systems, and data analytics infrastructure. This initial financial barrier can be a restraint for some ship owners and operators, particularly for smaller or less financially robust companies. Retrofitting vessels with smart technologies can be complex, requiring seamless integration with the existing maritime systems. Compatibility issues and the need for workforce training to operate these advanced systems can slow down the adoption process.
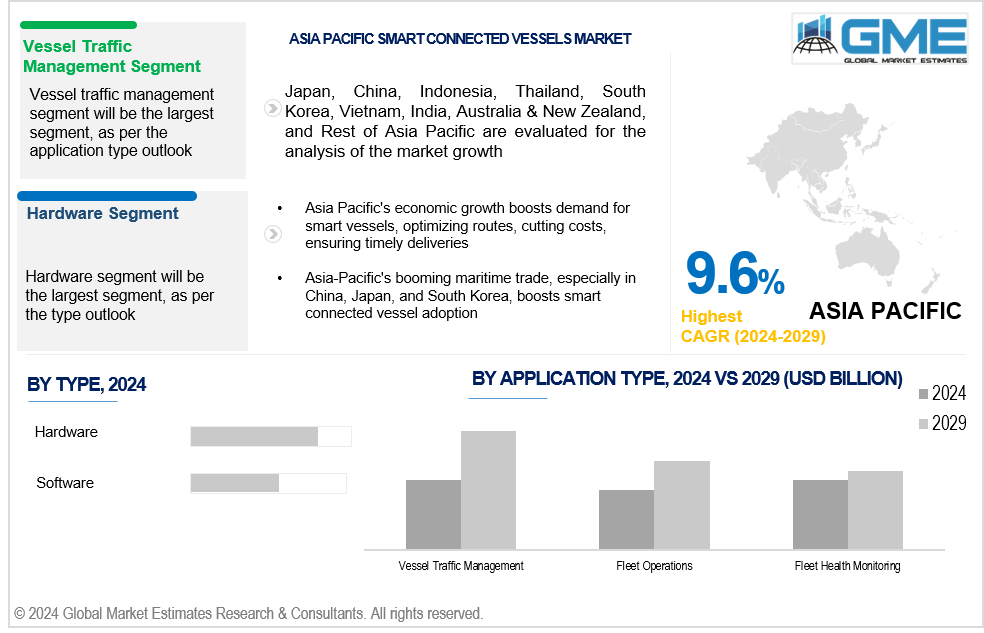
Based on application type, the market is segmented into vessel traffic management, fleet operations, and fleet health monitoring. The vessel traffic management segment is expected to be the largest segment during the forecast period. Vessel traffic management systems are extremely important, in ensuring the safety of operations. These systems use real-time data from sources like AIS (Automatic Identification System) radar and satellite communication to keep track of vessel movements, identify collision risks, and optimize navigation routes. This capability is crucial in preventing accidents and enhancing safety. Vessel traffic management systems also improve emergency response and search and rescue operations by pinpointing the location of distressed vessels. This ability is essential for effectively responding to incidents at sea.
The fleet operations segment is expected to be the fastest-growing segment in the global smart connected vessels market over the forecast period. Managing a fleet involves overseeing vessels, and using connected technologies brings valuable benefits like data analysis, real-time monitoring, and predictive maintenance capabilities. The ability to remotely monitor and control vessels within a fleet is vital for operations. With technology, fleet managers receive instant updates on the condition of each vessel, empowering them to make proactive decisions and promptly address any issues without requiring physical presence on every ship.
Based on type, the market is segmented into hardware and software. The hardware segment is expected to be the largest segment during the forecast period. Hardware components include sensors, actuators, and communication devices crucial for collecting real-time data from various aspects of vessel operations. These devices monitor engine performance, navigation, cargo conditions, and environmental factors. Vessels require advanced navigation and control systems, which are hardware components, to enable features like autonomous or semi-autonomous navigation, collision avoidance, and route optimization.
The software segment is expected to be the fastest growing in the global smart connected vessels market during the forecast period. Software solutions are essential in analyzing the vast volume of data generated by smart connected vessels. Advanced analytics help extract meaningful insights, enabling vessel operators to make informed decisions regarding maintenance, fuel efficiency, route optimization, and overall performance.
North America is analyzed to be the region with the largest share in the global smart connected vessels market during the forecast period. North America, especially the United States, stands out in global technological innovation with a robust community of tech companies, research institutions, and startups actively enhancing smart connected vessel technologies. This aligns seamlessly with the region's expansive maritime industry, including shipping, logistics, and offshore operations. Given the significant reliance on maritime transportation for trade, the integration of smart technologies has become essential for improving efficiency, safety, and compliance with environmental regulations. The unwavering commitment of the United States and Canada to stringent standards in maritime safety, security, and sustainability solidifies its dominance in this dynamic sector.
Asia Pacific is projected to be the fastest-growing region across the global smart connected vessels market over the forecast period. In the bustling Asia Pacific region, home to major ports like those in China, Japan, and South Korea, a surge in maritime trade has driven a robust demand for cutting-edge technologies, accelerating the adoption of smart connected vessels. Economic growth in these countries is amplifying the need for efficient and reliable maritime transportation, making these vessels appealing for optimizing routes, cutting costs, and ensuring timely deliveries. Governments in the APAC region are actively supporting this technological shift with initiatives focused on maritime safety, environmental sustainability, and the development of smart ports. Collaborative efforts between local maritime companies, technology providers, and international partners are seamlessly integrating smart connected vessel technologies, accelerating the adoption of advanced solutions in the maritime sector.
Key players operating in the global smart connected vessels market include Wärtsilä (Finland), ABB Ltd. (Switzerland), Kongsberg Gruppen ASA (Norway), Inmarsat plc (UK), General Electric Company (US), Schneider Electric SE (France), Rolls-Royce Holdings plc (UK), Marlink (Norway), Navico Holding AS (Norway), RH Marine (Netherlands), L3 Harris Technologies, Inc. (US), Emerson Electric Co. (US), Honeywell International Inc. (US), Siemens AG (Germany), Furuno Electric Co. Ltd. (Japan), VesselMan AS (Norway), Ericsson AB (Sweden), Intellian Technologies, Inc. (South Korea), Harris CapRock Communications, Inc. (US), and Thales Group (France), among others.
Please note: This is not an exhaustive list of companies profiled in the report.
In December 2023, Sateliot, a provider of Low-Earth Orbit (LEO) 5G IoT satellite connectivity, partnered with t42, a provider of IoT tracking devices for maritime containers. Under this agreement, t42 will deploy thousands of 5G-IoT sensors in containers, catering to over 50 logistics partners across 50 countries. The key objective of the partnership is to eliminate the prevalent issue of a lack of coverage on the high seas, where traditional connectivity options fall short, by connecting them to Sateliot's satellites.
In September 2023, Copenhagen-based Danelec updated its Danelec Connect maritime IoT system to fully integrate the ship performance monitoring software developed by Kyma following its acquisition of the company in late 2021, creating a new digital platform designed to boost operational efficiency, safety, and sustainability.
1 STRATEGIC INSIGHTS ON NEW REVENUE POCKETS
1.1 Strategic Opportunity & Attractiveness Analysis
1.1.1 Hot Revenue Pockets
1.1.2 Market Attractiveness Score
1.1.3 Revenue Impacting Opportunity
1.1.4 High Growing Region/Country
1.1.5 Competitor Analysis
1.1.6 Consumer Analysis
1.2 Global Market Estimates' View
1.3 Strategic Insights across Business Functions
1.3.1 For Chief Executive Officers
1.3.2 For Chief Marketing Officers
1.3.3 For Chief Strategy Officers
1.4 Evaluate the Potential of your Existing Business Lines vs. New Lines to Enter Into
2 TECHNOLOGICAL TRENDS
2.1 Technological Adoption Rate
2.2 Current Trend Impact Analysis
2.3 Future Trend Impact Analysis
3 GLOBAL MARKET OUTLOOK
3.1 Market Pyramid Analysis
3.1.1 Introduction
3.1.2 Adjacent Market Opportunities
3.1.3 Ancillary Market Opportunities
3.2 Demand Side Analysis
3.2.1 Market Drivers: Impact Analysis
3.2.2 Market Restraints: Impact Analysis
3.2.3 Market OpportunIties: Impact Analysis
3.2.4 Market Challenges: Impact Analysis
3.3 Supply Side Analysis
3.3.1 Porter’s Five Forces Analysis
3.3.1.1 Threat of New Entrants
3.3.1.2 Threat of New Substitutes
3.3.1.3 Bargaining Power of Suppliers
3.3.1.4 Bargaining Power of Buyers
3.3.1.5 Intensity of Competitive Rivalry
3.3.2 SWOT Analysis; By Factor (Political & Legal, Economic, and Technological)
3.3.2.1 Political Landscape
3.3.2.2 Economic Landscape
3.3.2.3 Social Landscape
3.3.2.4 Technology Landscape
3.3.3 Value Chain Analysis
3.3.4 Trend Analysis
3.3.5 Gap Analysis
3.3.6 Cost Analysis
4 GLOBAL SMART CONNECTED VESSELS MARKET, BY TYPE
4.1 Introduction
4.2 Global Smart Connected Vessels Market: Type Scope Key Takeaways
4.3 Revenue Growth Analysis, 2023 & 2029
4.4 Hardware
4.4.1 Hardware Market Estimates and Forecast, 2021-2029 (USD Billion)
4.5 Software
4.5.1 Software Market Estimates and Forecast, 2021-2029 (USD Billion)
5 GLOBAL SMART CONNECTED VESSELS MARKET, BY APPLICATION TYPE
5.1 Introduction
5.2 Global Smart Connected Vessels Market: Application Type Scope Key Takeaways
5.3 Revenue Growth Analysis, 2023 & 2029
5.4 Vessel Traffic Management
5.4.1 Vessel Traffic Management Market Estimates And Forecast, 2021-2029 (USD Billion)
5.5 Fleet Operations
5.5.1 Fleet Operations Market Estimates And Forecast, 2021-2029 (USD Billion)
5.6 Fleet Health Monitoring
5.6.1 Fleet Health Monitoring Market Estimates And Forecast, 2021-2029 (USD Billion)
6 GLOBAL SMART CONNECTED VESSELS MARKET, BY REGION
6.1 Introduction
6.2 North America Smart Connected Vessels Market Estimates and Forecast, 2021-2029 (USD Billion)
6.2.1 By Type
6.2.2 By Application Type
6.2.3 By Country
6.2.3.1 U.S. Smart Connected Vessels Market Estimates and Forecast, 2021-2029 (USD Billion)
6.2.3.1.1 By Type
6.2.3.1.2 By Application Type
6.2.3.2 Canada Smart Connected Vessels Market Estimates and Forecast, 2021-2029 (USD Billion)
6.2.3.2.1 By Type
6.2.3.2.2 By Application Type
6.2.3.3 Mexico Smart Connected Vessels Market Estimates and Forecast, 2021-2029 (USD Billion)
6.2.3.3.1 By Type
6.2.3.3.2 By Application Type
6.3 Europe Smart Connected Vessels Market Estimates and Forecast, 2021-2029 (USD Billion)
6.3.1 By Type
6.3.2 By Application Type
6.3.3 By Country
6.3.3.1 Germany Smart Connected Vessels Market Estimates and Forecast, 2021-2029 (USD Billion)
6.3.3.1.1 By Type
6.3.3.1.2 By Application Type
6.3.3.2 U.K. Smart Connected Vessels Market Estimates and Forecast, 2021-2029 (USD Billion)
6.3.3.2.1 By Type
6.3.3.2.2 By Application Type
6.3.3.3 France Smart Connected Vessels Market Estimates and Forecast, 2021-2029 (USD Billion)
6.3.3.3.1 By Type
6.3.3.3.2 By Application Type
6.3.3.4 Italy Smart Connected Vessels Market Estimates and Forecast, 2021-2029 (USD Billion)
6.3.3.4.1 By Type
6.3.3.4.2 By Application Type
6.3.3.5 Spain Smart Connected Vessels Market Estimates and Forecast, 2021-2029 (USD Billion)
6.3.3.5.1 By Type
6.3.3.5.2 By Application Type
6.3.3.6 Netherlands Smart Connected Vessels Market Estimates and Forecast, 2021-2029 (USD Billion)
6.3.3.6.1 By Type
6.3.3.6.2 By Application Type
6.3.3.7 Rest of Europe Smart Connected Vessels Market Estimates and Forecast, 2021-2029 (USD Billion)
6.3.3.6.1 By Type
6.3.3.6.2 By Application Type
6.4 Asia Pacific Smart Connected Vessels Market Estimates and Forecast, 2021-2029 (USD Billion)
6.4.1 By Type
6.4.2 By Application Type
6.4.3 By Country
6.4.3.1 China Smart Connected Vessels Market Estimates and Forecast, 2021-2029 (USD Billion)
6.4.3.1.1 By Type
6.4.3.1.2 By Application Type
6.4.3.2 Japan Smart Connected Vessels Market Estimates and Forecast, 2021-2029 (USD Billion)
6.4.3.2.1 By Type
6.4.3.2.2 By Application Type
6.4.3.3 India Smart Connected Vessels Market Estimates and Forecast, 2021-2029 (USD Billion)
6.4.3.3.1 By Type
6.4.3.3.2 By Application Type
6.4.3.4 South Korea Smart Connected Vessels Market Estimates and Forecast, 2021-2029 (USD Billion)
6.4.3.4.1 By Type
6.4.3.4.2 By Application Type
6.4.3.5 Singapore Smart Connected Vessels Market Estimates and Forecast, 2021-2029 (USD Billion)
6.4.3.5.1 By Type
6.4.3.5.2 By Application Type
6.4.3.6 Malaysia Smart Connected Vessels Market Estimates and Forecast, 2021-2029 (USD Billion)
6.4.3.6.1 By Type
6.4.3.6.2 By Application Type
6.4.3.7 Thailand Smart Connected Vessels Market Estimates and Forecast, 2021-2029 (USD Billion)
6.4.3.6.1 By Type
6.4.3.6.2 By Application Type
6.4.3.8 Indonesia Smart Connected Vessels Market Estimates and Forecast, 2021-2029 (USD Billion)
6.4.3.7.1 By Type
6.4.3.7.2 By Application Type
6.4.3.9 Vietnam Smart Connected Vessels Market Estimates and Forecast, 2021-2029 (USD Billion)
6.4.3.8.1 By Type
6.4.3.8.2 By Application Type
6.4.3.10 Taiwan Smart Connected Vessels Market Estimates and Forecast, 2021-2029 (USD Billion)
6.4.3.10.1 By Type
6.4.3.10.2 By Application Type
6.4.3.11 Rest of Asia Pacific Smart Connected Vessels Market Estimates and Forecast, 2021-2029 (USD Billion)
6.4.3.11.1 By Type
6.4.3.11.2 By Application Type
6.5 Middle East and Africa Smart Connected Vessels Market Estimates and Forecast, 2021-2029 (USD Billion)
6.5.1 By Type
6.5.2 By Application Type
6.5.3 By Country
6.5.3.1 Saudi Arabia Smart Connected Vessels Market Estimates and Forecast, 2021-2029 (USD Billion)
6.5.3.1.1 By Type
6.5.3.1.2 By Application Type
6.5.3.2 U.A.E. Smart Connected Vessels Market Estimates and Forecast, 2021-2029 (USD Billion)
6.5.3.2.1 By Type
6.5.3.2.2 By Application Type
6.5.3.3 Israel Smart Connected Vessels Market Estimates and Forecast, 2021-2029 (USD Billion)
6.5.3.3.1 By Type
6.5.3.3.2 By Application Type
6.5.3.4 South Africa Smart Connected Vessels Market Estimates and Forecast, 2021-2029 (USD Billion)
6.5.3.4.1 By Type
6.5.3.4.2 By Application Type
6.5.3.5 Rest of Middle East and Africa Smart Connected Vessels Market Estimates and Forecast, 2021-2029 (USD Billion)
6.5.3.5.1 By Type
6.5.3.5.2 By Application Type
6.6 Central and South America Smart Connected Vessels Market Estimates and Forecast, 2021-2029 (USD Billion)
6.6.1 By Type
6.6.2 By Application Type
6.6.3 By Country
6.6.3.1 Brazil Smart Connected Vessels Market Estimates and Forecast, 2021-2029 (USD Billion)
6.6.3.1.1 By Type
6.6.3.1.2 By Application Type
6.6.3.2 Argentina Smart Connected Vessels Market Estimates and Forecast, 2021-2029 (USD Billion)
6.6.3.2.1 By Type
6.6.3.2.2 By Application Type
6.6.3.3 Chile Smart Connected Vessels Market Estimates and Forecast, 2021-2029 (USD Billion)
6.6.3.3.1 By Type
6.6.3.3.2 By Application Type
6.6.3.3 Rest of Central and South America Smart Connected Vessels Market Estimates and Forecast, 2021-2029 (USD Billion)
6.6.3.3.1 By Type
6.6.3.3.2 By Application Type
7 COMPETITIVE LANDCAPE
7.1 Company Market Share Analysis
7.2 Four Quadrant Positioning Matrix
7.2.1 Market Leaders
7.2.2 Market Visionaries
7.2.3 Market Challengers
7.2.4 Niche Market Players
7.3 Vendor Landscape
7.3.1 North America
7.3.2 Europe
7.3.3 Asia Pacific
7.3.4 Rest of the World
7.4 Company Profiles
7.4.1 Wärtsilä (Finland)
7.4.1.1 Business Description & Financial Analysis
7.4.1.2 SWOT Analysis
7.4.1.3 Products & Services Offered
7.4.1.4 Strategic Alliances between Business Partners
7.4.2 ABB Ltd. (Switzerland)
7.4.2.1 Business Description & Financial Analysis
7.4.2.2 SWOT Analysis
7.4.2.3 Products & Services Offered
7.4.2.4 Strategic Alliances between Business Partners
7.4.3 Kongsberg Gruppen ASA (Norway)
7.4.3.1 Business Description & Financial Analysis
7.4.3.2 SWOT Analysis
7.4.3.3 Products & Services Offered
7.4.3.4 Strategic Alliances between Business Partners
7.4.4 Inmarsat plc (UK)
7.4.4.1 Business Description & Financial Analysis
7.4.4.2 SWOT Analysis
7.4.4.3 Products & Services Offered
7.4.4.4 Strategic Alliances between Business Partners
7.4.5 General Electric Company (US)
7.4.5.1 Business Description & Financial Analysis
7.4.5.2 SWOT Analysis
7.4.5.3 Products & Services Offered
7.4.5.4 Strategic Alliances between Business Partners
7.4.6 Schneider Electric SE (France)
7.4.6.1 Business Description & Financial Analysis
7.4.6.2 SWOT Analysis
7.4.6.3 Products & Services Offered
7.4.6.4 Strategic Alliances between Business Partners
7.4.7 Rolls-Royce Holdings plc (UK)
7.4.7.1 Business Description & Financial Analysis
7.4.7.2 SWOT Analysis
7.4.7.3 Products & Services Offered
7.4.7.4 Strategic Alliances between Business Partners
7.4.8 Marlink (Norway)
7.4.8.1 Business Description & Financial Analysis
7.4.8.2 SWOT Analysis
7.4.8.3 Products & Services Offered
7.4.8.4 Strategic Alliances between Business Partners
7.4.9 Navico Holding AS (Norway)
7.4.9.1 Business Description & Financial Analysis
7.4.9.2 SWOT Analysis
7.4.9.3 Products & Services Offered
7.4.9.4 Strategic Alliances between Business Partners
7.4.10 RH Marine (Netherlands)
7.4.10.1 Business Description & Financial Analysis
7.4.10.2 SWOT Analysis
7.4.10.3 Products & Services Offered
7.4.10.4 Strategic Alliances between Business Partners
7.4.11 L3 Harris Technologies, Inc. (US)
7.4.11.1 Business Description & Financial Analysis
7.4.11.2 SWOT Analysis
7.4.11.3 Products & Services Offered
7.4.11.4 Strategic Alliances between Business Partners
7.4.12 Emerson Electric Co. (US)
7.4.12.1 Business Description & Financial Analysis
7.4.12.2 SWOT Analysis
7.4.12.3 Products & Services Offered
7.4.12.4 Strategic Alliances between Business Partners
7.4.13 Honeywell International Inc. (US)
7.4.13.1 Business Description & Financial Analysis
7.4.13.2 SWOT Analysis
7.4.13.3 Products & Services Offered
7.4.13.4 Strategic Alliances between Business Partners
7.4.14 Siemens AG (Germany)
7.4.14.1 Business Description & Financial Analysis
7.4.14.2 SWOT Analysis
7.4.14.3 Products & Services Offered
7.4.14.4 Strategic Alliances between Business Partners
7.4.15 Furuno Electric Co., Ltd. (Japan)
7.4.15.1 Business Description & Financial Analysis
7.4.15.2 SWOT Analysis
7.4.15.3 Products & Services Offered
7.4.15.4 Strategic Alliances between Business Partners
7.4.16 VesselMan AS (Norway)
7.4.16.1 Business Description & Financial Analysis
7.4.16.2 SWOT Analysis
7.4.16.3 Products & Services Offered
7.4.16.4 Strategic Alliances between Business Partners
7.4.17 Ericsson AB (Sweden)
7.4.17.1 Business Description & Financial Analysis
7.4.17.2 SWOT Analysis
7.4.17.3 Products & Services Offered
7.4.17.4 Strategic Alliances between Business Partners
7.4.18 Intellian Technologies, Inc. (South Korea)
7.4.18.1 Business Description & Financial Analysis
7.4.18.2 SWOT Analysis
7.4.18.3 Products & Services Offered
7.4.18.4 Strategic Alliances between Business Partners
7.4.19 Harris CapRock Communications, Inc. (US)
7.4.19.1 Business Description & Financial Analysis
7.4.19.2 SWOT Analysis
7.4.19.3 Products & Services Offered
7.4.19.4 Strategic Alliances between Business Partners
7.4.20 Thales Group (France)
7.4.20.1 Business Description & Financial Analysis
7.4.20.2 SWOT Analysis
7.4.20.3 Products & Services Offered
7.4.20.4 Strategic Alliances between Business Partners
7.4.21 Other Companies
7.4.21.1 Business Description & Financial Analysis
7.4.21.2 SWOT Analysis
7.4.21.3 Products & Services Offered
7.4.21.4 Strategic Alliances between Business Partners
8 RESEARCH METHODOLOGY
8.1 Market Introduction
8.1.1 Market Definition
8.1.2 Market Scope & Segmentation
8.2 Information Procurement
8.2.1 Secondary Research
8.2.1.1 Purchased Databases
8.2.1.2 GMEs Internal Data Repository
8.2.1.3 Secondary Resources & Third Party Perspectives
8.2.1.4 Company Information Sources
8.2.2 Primary Research
8.2.2.1 Various Types of Respondents for Primary Interviews
8.2.2.2 Number of Interviews Conducted throughout the Research Process
8.2.2.3 Primary Stakeholders
8.2.2.4 Discussion Guide for Primary Participants
8.2.3 Expert Panels
8.2.3.1 Expert Panels Across 30+ Industry
8.2.4 Paid Local Experts
8.2.4.1 Paid Local Experts Across 30+ Industry Across each Region
8.3 Market Estimation
8.3.1 Top-Down Approach
8.3.1.1 Macro-Economic Indicators Considered
8.3.1.2 Micro-Economic Indicators Considered
8.3.2 Bottom Up Approach
8.3.2.1 Company Share Analysis Approach
8.3.2.2 Estimation of Potential Product Sales
8.4 Data Triangulation
8.4.1 Data Collection
8.4.2 Time Series, Cross Sectional & Panel Data Analysis
8.4.3 Cluster Analysis
8.5 Analysis and Output
8.5.1 Inhouse AI Based Real Time Analytics Tool
8.5.2 Output From Desk & Primary Research
8.6 Research Assumptions & Limitations
8.6.1 Research Assumptions
8.6.2 Research Limitations
LIST OF TABLES
1 Global Smart Connected Vessels Market, By Type, 2021-2029 (USD Billion)
2 Hardware Market, By Region, 2021-2029 (USD Billion)
3 Software Market, By Region, 2021-2029 (USD Billion)
4 Global Smart Connected Vessels Market, By Application Type, 2021-2029 (USD Billion)
5 Vessel Traffic Management Market, By Region, 2021-2029 (USD Billion)
6 Fleet Operations Market, By Region, 2021-2029 (USD Billion)
7 Fleet Health Monitoring Market, By Region, 2021-2029 (USD Billion)
8 Regional Analysis, 2021-2029 (USD Billion)
9 North America Smart Connected Vessels Market, By Type, 2021-2029 (USD Billion)
10 North America Smart Connected Vessels Market, By Application Type, 2021-2029 (USD Billion)
11 North America Smart Connected Vessels Market, By Country, 2021-2029 (USD Billion)
12 U.S. Smart Connected Vessels Market, By Type, 2021-2029 (USD Billion)
13 U.S. Smart Connected Vessels Market, By Application Type, 2021-2029 (USD Billion)
14 Canada Smart Connected Vessels Market, By Type, 2021-2029 (USD Billion)
15 Canada Smart Connected Vessels Market, By Application Type, 2021-2029 (USD Billion)
16 Mexico Smart Connected Vessels Market, By Type, 2021-2029 (USD Billion)
17 Mexico Smart Connected Vessels Market, By Application Type, 2021-2029 (USD Billion)
18 Europe Smart Connected Vessels Market, By Type, 2021-2029 (USD Billion)
19 Europe Smart Connected Vessels Market, By Application Type, 2021-2029 (USD Billion)
20 Europe Smart Connected Vessels Market, By Country, 2021-2029 (USD Billion)
21 Germany Smart Connected Vessels Market, By Type, 2021-2029 (USD Billion)
22 Germany Smart Connected Vessels Market, By Application Type, 2021-2029 (USD Billion)
23 U.K. Smart Connected Vessels Market, By Type, 2021-2029 (USD Billion)
24 U.K. Smart Connected Vessels Market, By Application Type, 2021-2029 (USD Billion)
25 France Smart Connected Vessels Market, By Type, 2021-2029 (USD Billion)
26 France Smart Connected Vessels Market, By Application Type, 2021-2029 (USD Billion)
27 Italy Smart Connected Vessels Market, By Type, 2021-2029 (USD Billion)
28 Italy Smart Connected Vessels Market, By Application Type, 2021-2029 (USD Billion)
29 Spain Smart Connected Vessels Market, By Type, 2021-2029 (USD Billion)
30 Spain Smart Connected Vessels Market, By Application Type, 2021-2029 (USD Billion)
31 Netherlands Smart Connected Vessels Market, By Type, 2021-2029 (USD Billion)
32 Netherlands Smart Connected Vessels Market, By Application Type, 2021-2029 (USD Billion)
33 Rest Of Europe Smart Connected Vessels Market, By Type, 2021-2029 (USD Billion)
34 Rest Of Europe Smart Connected Vessels Market, By Application Type, 2021-2029 (USD Billion)
35 Asia Pacific Smart Connected Vessels Market, By Type, 2021-2029 (USD Billion)
36 Asia Pacific Smart Connected Vessels Market, By Application Type, 2021-2029 (USD Billion)
37 Asia Pacific Smart Connected Vessels Market, By Country, 2021-2029 (USD Billion)
38 China Smart Connected Vessels Market, By Type, 2021-2029 (USD Billion)
39 China Smart Connected Vessels Market, By Application Type, 2021-2029 (USD Billion)
40 Japan Smart Connected Vessels Market, By Type, 2021-2029 (USD Billion)
41 Japan Smart Connected Vessels Market, By Application Type, 2021-2029 (USD Billion)
42 India Smart Connected Vessels Market, By Type, 2021-2029 (USD Billion)
43 India Smart Connected Vessels Market, By Application Type, 2021-2029 (USD Billion)
44 South Korea Smart Connected Vessels Market, By Type, 2021-2029 (USD Billion)
45 South Korea Smart Connected Vessels Market, By Application Type, 2021-2029 (USD Billion)
46 Singapore Smart Connected Vessels Market, By Type, 2021-2029 (USD Billion)
47 Singapore Smart Connected Vessels Market, By Application Type, 2021-2029 (USD Billion)
48 Thailand Smart Connected Vessels Market, By Type, 2021-2029 (USD Billion)
49 Thailand Smart Connected Vessels Market, By Application Type, 2021-2029 (USD Billion)
50 Malaysia Smart Connected Vessels Market, By Type, 2021-2029 (USD Billion)
51 Malaysia Smart Connected Vessels Market, By Application Type, 2021-2029 (USD Billion)
52 Indonesia Smart Connected Vessels Market, By Type, 2021-2029 (USD Billion)
53 Indonesia Smart Connected Vessels Market, By Application Type, 2021-2029 (USD Billion)
54 Vietnam Smart Connected Vessels Market, By Type, 2021-2029 (USD Billion)
55 Vietnam Smart Connected Vessels Market, By Application Type, 2021-2029 (USD Billion)
56 Taiwan Smart Connected Vessels Market, By Type, 2021-2029 (USD Billion)
57 Taiwan Smart Connected Vessels Market, By Application Type, 2021-2029 (USD Billion)
58 Rest of APAC Smart Connected Vessels Market, By Type, 2021-2029 (USD Billion)
59 Rest of APAC Smart Connected Vessels Market, By Application Type, 2021-2029 (USD Billion)
60 Middle East and Africa Smart Connected Vessels Market, By Type, 2021-2029 (USD Billion)
61 Middle East and Africa Smart Connected Vessels Market, By Application Type, 2021-2029 (USD Billion)
62 Middle East And africa Smart Connected Vessels Market, By Country, 2021-2029 (USD Billion)
63 Saudi Arabia Smart Connected Vessels Market, By Type, 2021-2029 (USD Billion)
64 Saudi Arabia Smart Connected Vessels Market, By Application Type, 2021-2029 (USD Billion)
65 UAE Smart Connected Vessels Market, By Type, 2021-2029 (USD Billion)
66 UAE Smart Connected Vessels Market, By Application Type, 2021-2029 (USD Billion)
67 Israel Smart Connected Vessels Market, By Type, 2021-2029 (USD Billion)
68 Israel Smart Connected Vessels Market, By Application Type, 2021-2029 (USD Billion)
69 South Africa Smart Connected Vessels Market, By Type, 2021-2029 (USD Billion)
70 South Africa Smart Connected Vessels Market, By Application Type, 2021-2029 (USD Billion)
71 Rest Of Middle East and Africa Smart Connected Vessels Market, By Type, 2021-2029 (USD Billion)
72 Rest Of Middle East and Africa Smart Connected Vessels Market, By Application Type, 2021-2029 (USD Billion)
73 Central and South America Smart Connected Vessels Market, By Type, 2021-2029 (USD Billion)
74 Central and South America Smart Connected Vessels Market, By Application Type, 2021-2029 (USD Billion)
75 Central and South America Smart Connected Vessels Market, By Country, 2021-2029 (USD Billion)
76 Brazil Smart Connected Vessels Market, By Type, 2021-2029 (USD Billion)
77 Brazil Smart Connected Vessels Market, By Application Type, 2021-2029 (USD Billion)
78 Chile Smart Connected Vessels Market, By Type, 2021-2029 (USD Billion)
79 Chile Smart Connected Vessels Market, By Application Type, 2021-2029 (USD Billion)
80 Argentina Smart Connected Vessels Market, By Type, 2021-2029 (USD Billion)
81 Argentina Smart Connected Vessels Market, By Application Type, 2021-2029 (USD Billion)
82 Rest Of Central and South America Smart Connected Vessels Market, By Type, 2021-2029 (USD Billion)
83 Rest Of Central and South America Smart Connected Vessels Market, By Application Type, 2021-2029 (USD Billion)
84 Wärtsilä (Finland): Products & Services Offering
85 ABB Ltd. (Switzerland): Products & Services Offering
86 Kongsberg Gruppen ASA (Norway): Products & Services Offering
87 Inmarsat plc (UK): Products & Services Offering
88 General Electric Company (US): Products & Services Offering
89 SCHNEIDER ELECTRIC SE (FRANCE): Products & Services Offering
90 Rolls-Royce Holdings plc (UK): Products & Services Offering
91 Marlink (Norway): Products & Services Offering
92 Navico Holding AS (Norway): Products & Services Offering
93 RH Marine (Netherlands): Products & Services Offering
94 L3 Harris Technologies, Inc. (US): Products & Services Offering
95 Emerson Electric Co. (US): Products & Services Offering
96 Honeywell International Inc. (US): Products & Services Offering
97 Siemens AG (Germany): Products & Services Offering
98 Furuno Electric Co., Ltd. (Japan): Products & Services Offering
99 VesselMan AS (Norway): Products & Services Offering
100 Ericsson AB (Sweden): Products & Services Offering
101 Intellian Technologies, Inc. (South Korea): Products & Services Offering
102 Harris CapRock Communications, Inc. (US): Products & Services Offering
103 Thales Group (France): Products & Services Offering
104 Other Companies: Products & Services Offering
LIST OF FIGURES
1 Global Smart Connected Vessels Market Overview
2 Global Smart Connected Vessels Market Value From 2021-2029 (USD Billion)
3 Global Smart Connected Vessels Market Share, By Type (2023)
4 Global Smart Connected Vessels Market Share, By Application Type (2023)
5 Global Smart Connected Vessels Market, By Region (Asia Pacific Market)
6 Technological Trends In Global Smart Connected Vessels Market
7 Four Quadrant Competitor Positioning Matrix
8 Impact Of Macro & Micro Indicators On The Market
9 Impact Of Key Drivers On The Global Smart Connected Vessels Market
10 Impact Of Challenges On The Global Smart Connected Vessels Market
11 Porter’s Five Forces Analysis
12 Global Smart Connected Vessels Market: By Type Scope Key Takeaways
13 Global Smart Connected Vessels Market, By Type Segment: Revenue Growth Analysis
14 Hardware Market, By Region, 2021-2029 (USD Billion)
15 Software Market, By Region, 2021-2029 (USD Billion)
16 Global Smart Connected Vessels Market: By Application Type Scope Key Takeaways
17 Global Smart Connected Vessels Market, By Application Type Segment: Revenue Growth Analysis
18 Vessel Traffic Management Market, By Region, 2021-2029 (USD Billion)
19 Fleet Operations Market, By Region, 2021-2029 (USD Billion)
20 Fleet Health Monitoring Market, By Region, 2021-2029 (USD Billion)
21 Regional Segment: Revenue Growth Analysis
22 Global Smart Connected Vessels Market: Regional Analysis
23 North America Smart Connected Vessels Market Overview
24 North America Smart Connected Vessels Market, By Type
25 North America Smart Connected Vessels Market, By Application Type
26 North America Smart Connected Vessels Market, By Country
27 U.S. Smart Connected Vessels Market, By Type
28 U.S. Smart Connected Vessels Market, By Application Type
29 Canada Smart Connected Vessels Market, By Type
30 Canada Smart Connected Vessels Market, By Application Type
31 Mexico Smart Connected Vessels Market, By Type
32 Mexico Smart Connected Vessels Market, By Application Type
33 Four Quadrant Positioning Matrix
34 Company Market Share Analysis
35 Wärtsilä (Finland): Company Snapshot
36 Wärtsilä (Finland): SWOT Analysis
37 Wärtsilä (Finland): Geographic Presence
38 ABB Ltd. (Switzerland): Company Snapshot
39 ABB Ltd. (Switzerland): SWOT Analysis
40 ABB Ltd. (Switzerland): Geographic Presence
41 Kongsberg Gruppen ASA (Norway): Company Snapshot
42 Kongsberg Gruppen ASA (Norway): SWOT Analysis
43 Kongsberg Gruppen ASA (Norway): Geographic Presence
44 Inmarsat plc (UK): Company Snapshot
45 Inmarsat plc (UK): Swot Analysis
46 Inmarsat plc (UK): Geographic Presence
47 General Electric Company (US): Company Snapshot
48 General Electric Company (US): SWOT Analysis
49 General Electric Company (US): Geographic Presence
50 Schneider Electric SE (France): Company Snapshot
51 Schneider Electric SE (France): SWOT Analysis
52 Schneider Electric SE (France): Geographic Presence
53 Rolls-Royce Holdings plc (UK): Company Snapshot
54 Rolls-Royce Holdings plc (UK): SWOT Analysis
55 Rolls-Royce Holdings plc (UK): Geographic Presence
56 Marlink (Norway): Company Snapshot
57 Marlink (Norway): SWOT Analysis
58 Marlink (Norway): Geographic Presence
59 Navico Holding AS (Norway): Company Snapshot
60 Navico Holding AS (Norway): SWOT Analysis
61 Navico Holding AS (Norway): Geographic Presence
62 RH Marine (Netherlands): Company Snapshot
63 RH Marine (Netherlands): SWOT Analysis
64 RH Marine (Netherlands): Geographic Presence
65 L3 Harris Technologies, Inc. (US): Company Snapshot
66 L3 Harris Technologies, Inc. (US): SWOT Analysis
67 L3 Harris Technologies, Inc. (US).: Geographic Presence
68 Emerson Electric Co. (US): Company Snapshot
69 Emerson Electric Co. (US): SWOT Analysis
70 Emerson Electric Co. (US): Geographic Presence
71 Honeywell International Inc. (US): Company Snapshot
72 Honeywell International Inc. (US): SWOT Analysis
73 Honeywell International Inc. (US): Geographic Presence
74 Siemens AG (Germany): Company Snapshot
75 Siemens AG (Germany): SWOT Analysis
76 Siemens AG (Germany): Geographic Presence
77 Furuno Electric Co., Ltd. (Japan): Company Snapshot
78 Furuno Electric Co., Ltd. (Japan): SWOT Analysis
79 Furuno Electric Co., Ltd. (Japan): Geographic Presence
80 VesselMan AS (Norway): Company Snapshot
81 VesselMan AS (Norway): SWOT Analysis
82 VesselMan AS (Norway): Geographic Presence
83 Ericsson AB (Sweden): Company Snapshot
84 Ericsson AB (Sweden): SWOT Analysis
85 Ericsson AB (Sweden): Geographic Presence
86 Harris CapRock Communications, Inc. (US): Company Snapshot
87 Harris CapRock Communications, Inc. (US): SWOT Analysis
88 Harris CapRock Communications, Inc. (US): Geographic Presence
89 Thales Group (France): Company Snapshot
90 Thales Group (France): SWOT Analysis
91 Thales Group (France): Geographic Presence
92 Other Companies: Company Snapshot
93 Other Companies: SWOT Analysis
94 Other Companies: Geographic Presence
The Global Smart Connected Vessels Market has been studied from the year 2019 till 2029. However, the CAGR provided in the report is from the year 2024 to 2029. The research methodology involved three stages: Desk research, Primary research, and Analysis & Output from the entire research process.

The desk research involved a robust background study which meant referring to paid and unpaid databases to understand the market dynamics; mapping contracts from press releases; identifying the key players in the market, studying their product portfolio, competition level, annual reports/SEC filings & investor presentations; and learning the demand and supply-side analysis for the Smart Connected Vessels Market.

The primary research activity included telephonic conversations with more than 50 tier 1 industry consultants, distributors, and end-use product manufacturers.

Finally, based on the above thorough research process, an in-depth analysis was carried out considering the following aspects: market attractiveness, current & future market trends, market share analysis, SWOT analysis of the company and customer analytics.

Frequently Asked Questions

This FREE sample includes market data points, ranging from trend analyses to market estimates & forecasts. See for yourself.
Or view our licence options:
Tailor made solutions just for you
80% of our clients seek made-to-order reports. How do you want us to tailor yours?
OUR CLIENTS


