This report was recently updated on August 28 2025 with the latest and most recent
market numbers
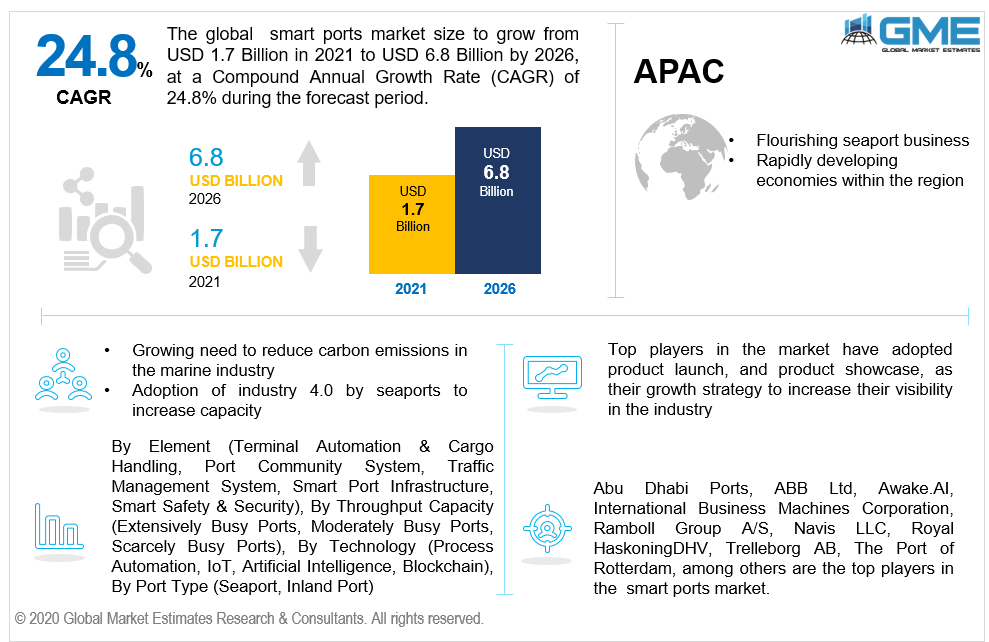
Global Smart Ports Market Size, Trends & Analysis - Forecasts to 2026 By Element (Terminal Automation & Cargo Handling, Port Community System, Traffic Management System, Smart Port Infrastructure, Smart Safety & Security), By Throughput Capacity (Extensively Busy Ports, Moderately Busy Ports, Scarcely Busy Ports), By Technology (Process Automation, Internet Of Things, Artificial Intelligence, Blockchain), By Port Type (Seaport, Inland Port), By Region (North America, Asia Pacific, Central & South America, Europe, and the Middle East and Africa), Competitive Landscape, Company Market Share Analysis, and Competitor Analysis
The global smart ports market is projected to grow from USD 1.7 billion in 2021 and reach USD 6.8 billion by 2026 at a CAGR of 24.8% from 2021 to 2026.
A smart port is an entirely automated port that connects gadgets seamlessly. As the existence of smart detection systems in ports is becoming a reality, several operating sectors are already operating in autonomous transmission.
The global smart port market is being driven by increasing number of online commercial transactions especially during and post COVID-19 pandemic, rising adoption of smart port across airports, and sea ports, and the rising demand for digitalization across major sectors.
The growing need to reduce carbon emissions from the marine industry, as well as the adoption of industry 4.0 technology by seaports to increase capacity, are driving the expansion of the smart ports market.
Numerous seaport authorities across the globe are rapidly adopting smart technology as a result of the significant development in trade and commerce via marine shipping. As these technologies assist to improve the overall efficiency of the port, their increasing usage has a beneficial impact on market growth.
The overall productivity improvements are the main drivers in smart ports. Successful automated ports have helped lower the operating costs by 25% to 55%, with increased efficiency by 10% to 35%. GME has analyzed that the production costs for computerized port can be reduced by 15% to 35%. The digital port's infrastructural facilities is a combination of smart sensing devices, electronic connections, and cloud services that allow shipping companies to conduct key functions more quickly and effectively.
COVID-19 has hindered the expansion of the smart ports sector as the governments had to forcibly apply lockdown norms in the first half of 2020. Governments and municipal corporations established strict restrictions, and all non-essential activities were halted. Because the end users' activities were halted, the smart port business also got affected negatively.
Based on the element, the market is segmented into terminal automation & cargo handling, port community system, traffic management system, smart port infrastructure, smart safety & security. The smart port infrastructure segment is estimated to have the largest share in the market during the forecast period. The rising integration of IoT and sea port industry is one of the prime drivers for the segment’s growth. The size of boats and cargo loads have grown in tandem with the growth of global trade. Seaports are increasingly relying on smart technologies to help them optimize operations, increase productivity, and reduce operational cost without having to spend heavily in new equipment and infrastructure.
Based on throughput capacity, the market is segmented into extensively busy ports, moderately busy ports, scarcely busy ports. The market for extensively busy ports is the largest during the forecast period.
As the throughput of goods and passengers increases year after year, more infrastructure, provisioning, and accompanying services are necessary, with differing degrees of benefit to the economy and the country. Ports that are exceptionally busy handle more than 18 million TEU annually, while moderately busy ports handle 5–8 million TEU each year, and ports that really are scarcely busy handle just under 5 million TEU a year.
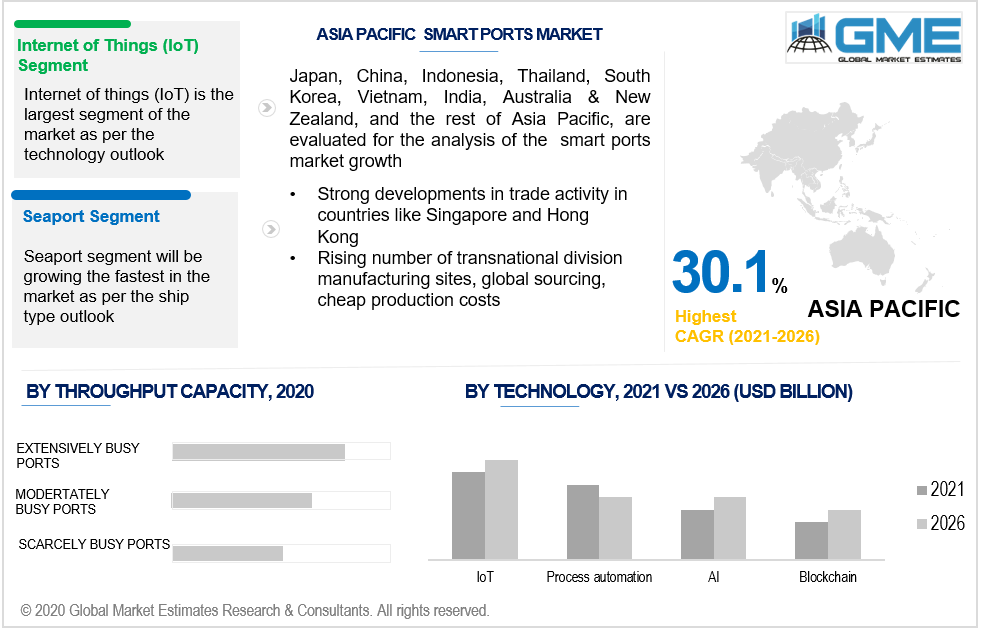
Based on the technology, the market is segmented into process automation, Internet of Things (IoT), artificial intelligence, and blockchain. The market for the Internet of Things (IoT) is expected to have the largest share during the forecast period. Rising demand for implementing digitalization and increasing need for incorporating IoT into port operations are some of the factors supporting the growth of the market.
Based on the port type, the market is segmented into a seaport and inland port. The seaport segment is expected to have the largest share in the market during the forecast period since seaports are outfitted with powerful digital technology and smart sensors and IoT, which enhance the operational productivity and achieve cargo management easier for port authorities.
As per the geographical analysis, the market can be classified into North America (the US, Canada, and Mexico), Asia Pacific (India, China, Japan, Malaysia, Singapore, and Rest of Asia Pacific), Europe (Germany, United Kingdom, Italy, France, Spain, Netherlands, and Rest of Europe), Middle East & Africa (United Arab Emirates, Saudi Arabia, Rest of Middle East & Africa) and Central & South America (Brazil, Peru, Chile, and Rest of Central & South America).
The North American region is expected to hold the lion’s share of the global revenue generated in the market. The rapidly rising port economy, has led to a wider adoption of smart ports to improve operational efficiency, which is driving the market's growth in this area. Excessive government measures, launch of cloud-based software deployment, and technological breakthroughs are all contributing to the sector's development. Furthermore, the anticipated expansion in the number of mega-ports will benefit the business over the forecast period.
During the forecast period, the Asia Pacific region is expected to grow rapidly owing to a surge in variety of variables like transnational divisional manufacturing, global supply networks, cheap production costs, and each country's export-led development plans.
Abu Dhabi Ports, ABB Ltd, Awake.AI, International Business Machines Corporation, Ramboll Group A/S, Navis LLC, Royal HaskoningDHV, Trelleborg AB, The Port of Rotterdam, Wipro Limited, Abu Dhabi Ports, Accenture, Abb, Ramboll Group, among others are the top players in the smart ports market.
Please note: This is not an exhaustive list of companies profiled in the report.
Chapter 1 Methodology
1.1 Market Scope & Definitions
1.2 Estimates & Forecast Calculation
1.3 Historical Data Overview and Validation
1.4 Data Sources
1.4.1 Secondary
1.4.2 Primary
Chapter 2 Report Outlook
2.1 Smart Ports Industry Overview, 2021-2026
2.1.1 Industry Overview
2.1.2 Element Overview
2.1.3 Throughput Capacity Overview
2.1.4 Technology Overview
2.1.5 Port Type Overview
2.1.6 Regional Overview
Chapter 3 Smart Ports Market Trends
3.1 Market Segmentation
3.2 Industry Background, 2021-2026
3.3 Market Key Trends
3.3.1 Positive Trends
3.3.1.1 The growing number of sea based trading activities and the rising trend of automation across various industries
3.3.2 Industry Challenges
3.3.2.1 Increasing concern about data security and theft
3.4 Prospective Growth Scenario
3.4.1 Element Growth Scenario
3.4.2 Technology Growth Scenario
3.4.3 Throughput Capacity Growth Scenario
3.4.4 Port Type Growth Scenario
3.5 COVID-19 Influence over Industry Growth
3.6 Porter’s Analysis
3.7 PESTEL Analysis
3.8 Value Chain & Supply Chain Analysis
3.9 Regulatory Framework
3.9.1 North America
3.9.2 Europe
3.9.3 APAC
3.9.4 LATAM
3.9.5 MEA
3.10 Element Overview
3.11 Market Share Analysis, 2021
3.11.1 Company Positioning Overview, 2021
Chapter 4 Smart Ports Market, By Element
4.1 Element Outlook
4.2 Terminal Automation & Cargo Handling
4.2.1 Market Size, By Region, 2021-2026 (USD Billion)
4.3 Port Community System
4.3.1 Market Size, By Region, 2021-2026 (USD Billion)
4.4 Traffic Management System
4.4.1 Market Size, By Region, 2021-2026 (USD Billion)
4.5 Smart Port Infrastructure
4.5.1 Market Size, By Region, 2021-2026 (USD Billion)
4.6 Smart Safety & Security
4.6.1 Market Size, By Region, 2021-2026 (USD Billion)
Chapter 5 Smart Ports Market, By Throughput Capacity
5.1 Throughput Capacity Outlook
5.2 Extensively Busy Ports
5.2.1 Market Size, By Region, 2021-2026 (USD Billion)
5.3 Moderately Busy Ports
5.3.1 Market Size, By Region, 2021-2026 (USD Billion)
5.4 Scarcely Busy Ports
5.4.1 Market Size, By Region, 2021-2026 (USD Billion)
Chapter 6 Smart Ports Market, By Technology
6.1 Process Automation
6.1.1 Market Size, By Region, 2021-2026 (USD Billion)
6.2 Internet of Things
6.2.1 Market Size, By Region, 2021-2026 (USD Billion)
6.3 Artificial Intelligence
6.3.1 Market Size, By Region, 2021-2026 (USD Billion)
6.4 Blockchain
6.4.1 Market Size, By Region, 2021-2026 (USD Billion)
Chapter 7 Smart Ports Market, By Port Type
7.1 Seaport
7.1.1 Market Size, By Region, 2021-2026 (USD Billion)
7.2 Inland Port
7.2.1 Market Size, By Region, 2021-2026 (USD Billion)
Chapter 8 Smart Ports Market, By Region
8.1 Regional outlook
8.2 North America
8.2.1 Market Size, By Country 2021-2026 (USD Billion)
8.2.2 Market Size, By Element, 2021-2026 (USD Billion)
8.2.3 Market Size, By Throughput Capacity, 2021-2026 (USD Billion)
8.2.4 Market Size, By Technology, 2021-2026 (USD Billion)
8.2.5 Market Size, By Port Type, 2021-2026 (USD Billion)
8.2.6 U.S.
8.2.6.1 Market Size, By Element, 2021-2026 (USD Billion)
8.2.4.2 Market Size, By Throughput Capacity, 2021-2026 (USD Billion)
8.2.4.3 Market Size, By Technology, 2021-2026 (USD Billion)
Market Size, By Port Type, 2021-2026 (USD Billion)
8.2.7 Canada
8.2.7.1 Market Size, By Element, 2021-2026 (USD Billion)
8.2.7.2 Market Size, By Throughput Capacity, 2021-2026 (USD Billion)
8.2.7.3 Market Size, By Technology, 2021-2026 (USD Billion)
8.2.7.4 Market Size, By Port Type, 2021-2026 (USD Billion)
8.3 Europe
8.3.1 Market Size, By Country 2021-2026 (USD Billion)
8.3.2 Market Size, By Element, 2021-2026 (USD Billion)
8.3.3 Market Size, By Throughput Capacity, 2021-2026 (USD Billion)
8.3.4 Market Size, By Technology, 2021-2026 (USD Billion)
8.3.5 Market Size, By Port Type, 2021-2026 (USD Billion)
8.3.6 Germany
8.3.6.1 Market Size, By Element, 2021-2026 (USD Billion)
8.3.6.2 Market Size, By Throughput Capacity, 2021-2026 (USD Billion)
8.3.6.3 Market Size, By Technology, 2021-2026 (USD Billion)
8.3.6.4 Market Size, By Port Type, 2021-2026 (USD Billion)
8.3.7 UK
8.3.7.1 Market Size, By Element, 2021-2026 (USD Billion)
8.3.7.2 Market Size, By Throughput Capacity, 2021-2026 (USD Billion)
8.3.7.3 Market Size, By Technology, 2021-2026 (USD Billion)
8.3.7.4 Market Size, By Port Type, 2021-2026 (USD Billion)
8.3.8 France
8.3.8.1 Market Size, By Element, 2021-2026 (USD Billion)
8.3.8.2 Market Size, By Throughput Capacity, 2021-2026 (USD Billion)
8.3.8.3 Market Size, By Technology, 2021-2026 (USD Billion)
8.3.8.4 Market Size, By Port Type, 2021-2026 (USD Billion)
8.3.9 Italy
8.3.9.1 Market Size, By Element, 2021-2026 (USD Billion)
8.3.9.2 Market Size, By Throughput Capacity, 2021-2026 (USD Billion)
8.3.9.3 Market Size, By Technology, 2021-2026 (USD Billion)
8.3.9.4 Market Size, By Port Type, 2021-2026 (USD Billion)
8.3.10 Spain
8.3.10.1 Market Size, By Element, 2021-2026 (USD Billion)
8.3.10.2 Market Size, By Throughput Capacity, 2021-2026 (USD Billion)
8.3.10.3 Market Size, By Technology, 2021-2026 (USD Billion)
8.3.10.4 Market Size, By Port Type, 2021-2026 (USD Billion)
8.3.11 Russia
8.3.11.1 Market Size, By Element, 2021-2026 (USD Billion)
8.3.11.2 Market Size, By Throughput Capacity, 2021-2026 (USD Billion)
8.3.11.3 Market Size, By Technology, 2021-2026 (USD Billion)
8.3.11.4 Market Size, By Port Type, 2021-2026 (USD Billion)
8.4 Asia Pacific
8.4.1 Market Size, By Country 2021-2026 (USD Billion)
8.4.2 Market Size, By Element, 2021-2026 (USD Billion)
8.4.3 Market Size, By Throughput Capacity, 2021-2026 (USD Billion)
8.4.4 Market Size, By Technology, 2021-2026 (USD Billion)
8.4.5 Market Size, By Port Type, 2021-2026 (USD Billion)
8.4.6 China
8.4.6.1 Market Size, By Element, 2021-2026 (USD Billion)
8.4.6.2 Market Size, By Throughput Capacity, 2021-2026 (USD Billion)
8.4.6.3 Market Size, By Technology, 2021-2026 (USD Billion)
8.4.6.4 Market Size, By Port Type, 2021-2026 (USD Billion)
8.4.7 India
8.4.7.1 Market Size, By Element, 2021-2026 (USD Billion)
8.4.7.2 Market Size, By Throughput Capacity, 2021-2026 (USD Billion)
8.4.7.3 Market Size, By Technology, 2021-2026 (USD Billion)
8.4.7.4 Market Size, By Port Type, 2021-2026 (USD Billion)
8.4.8 Japan
8.4.8.1 Market Size, By Element, 2021-2026 (USD Billion)
8.4.8.2 Market Size, By Throughput Capacity, 2021-2026 (USD Billion)
8.4.8.3 Market Size, By Technology, 2021-2026 (USD Billion)
8.4.8.4 Market Size, By Port Type, 2021-2026 (USD Billion)
8.4.9 Australia
8.4.9.1 Market Size, By Element, 2021-2026 (USD Billion)
8.4.9.2 Market size, By Throughput Capacity, 2021-2026 (USD Billion)
8.4.9.3 Market Size, By Technology, 2021-2026 (USD Billion)
8.4.9.4 Market Size, By Port Type, 2021-2026 (USD Billion)
8.4.10 South Korea
8.4.10.1 Market Size, By Element, 2021-2026 (USD Billion)
8.4.10.2 Market Size, By Throughput Capacity, 2021-2026 (USD Billion)
8.4.10.3 Market Size, By Technology, 2021-2026 (USD Billion)
8.4.10.4 Market Size, By Port Type, 2021-2026 (USD Billion)
8.5 Latin America
8.5.1 Market Size, By Country 2021-2026 (USD Billion)
8.5.2 Market Size, By Element, 2021-2026 (USD Billion)
8.5.3 Market Size, By Throughput Capacity, 2021-2026 (USD Billion)
8.5.4 Market Size, By Technology, 2021-2026 (USD Billion)
8.5.5 Market Size, By Port Type, 2021-2026 (USD Billion)
8.5.6 Brazil
8.5.6.1 Market Size, By Element, 2021-2026 (USD Billion)
8.5.6.2 Market Size, By Throughput Capacity, 2021-2026 (USD Billion)
8.5.6.3 Market Size, By Technology, 2021-2026 (USD Billion)
8.5.6.4 Market Size, By Port Type, 2021-2026 (USD Billion)
8.5.7 Mexico
8.5.7.1 Market Size, By Element, 2021-2026 (USD Billion)
8.5.7.2 Market Size, By Throughput Capacity, 2021-2026 (USD Billion)
8.5.7.3 Market Size, By Technology, 2021-2026 (USD Billion)
8.5.7.4 Market Size, By Port Type, 2021-2026 (USD Billion)
8.5.8 Argentina
8.5.8.1 Market Size, By Element, 2021-2026 (USD Billion)
8.5.8.2 Market Size, By Throughput Capacity, 2021-2026 (USD Billion)
8.5.8.3 Market Size, By Technology, 2021-2026 (USD Billion)
8.5.8.4 Market Size, By Port Type, 2021-2026 (USD Billion)
8.6 MEA
8.6.1 Market Size, By Country 2021-2026 (USD Billion)
8.6.2 Market Size, By Element, 2021-2026 (USD Billion)
8.6.3 Market Size, By Throughput Capacity, 2021-2026 (USD Billion)
8.6.4 Market Size, By Technology, 2021-2026 (USD Billion)
8.6.5 Market Size, By Port Type, 2021-2026 (USD Billion)
8.6.6 Saudi Arabia
8.6.6.1 Market Size, By Element, 2021-2026 (USD Billion)
8.6.6.2 Market Size, By Throughput Capacity, 2021-2026 (USD Billion)
8.6.6.3 Market Size, By Technology, 2021-2026 (USD Billion)
8.6.6.4 Market Size, By Port Type, 2021-2026 (USD Billion)
8.6.7 UAE
8.6.7.1 Market Size, By Element, 2021-2026 (USD Billion)
8.6.7.2 Market Size, By Throughput Capacity, 2021-2026 (USD Billion)
8.6.7.3 Market Size, By Technology, 2021-2026 (USD Billion)
8.6.7.4 Market Size, By Port Type, 2021-2026 (USD Billion)
8.6.8 South Africa
8.6.8.1 Market Size, By Element, 2021-2026 (USD Billion)
8.6.8.2 Market Size, By Throughput Capacity, 2021-2026 (USD Billion)
8.6.8.3 Market Size, By Technology, 2021-2026 (USD Billion)
8.6.8.4 Market Size, By Port Type , 2021-2026 (USD Billion)
Chapter 9 Company Landscape
9.1 Competitive Analysis, 2021
9.2 Abu Dhabi Ports
9.2.1 Company Overview
9.2.2 Financial Analysis
9.2.3 Strategic Positioning
9.2.4 Info Graphic Analysis
9.3 ABB Ltd
9.3.1 Company Overview
9.3.2 Financial Analysis
9.3.3 Strategic Positioning
9.3.4 Info Graphic Analysis
9.4 Awake.AI
9.4.1 Company Overview
9.4.2 Financial Analysis
9.4.3 Strategic Positioning
9.4.4 Info Graphic Analysis
9.5 International Business Machines Corporation
9.5.1 Company Overview
9.5.2 Financial Analysis
9.5.3 Strategic Positioning
9.5.4 Info Graphic Analysis
9.6 Ramboll Group A/S
9.6.1 Company Overview
9.6.2 Financial Analysis
9.6.3 Strategic Positioning
9.6.4 Info Graphic Analysis
9.7 Navis LLC
9.7.1 Company Overview
9.7.2 Financial Analysis
9.7.3 Strategic Positioning
9.7.4 Info Graphic Analysis
9.8 Royal HaskoningDHV
9.8.1 Company Overview
9.8.2 Financial Analysis
9.8.3 Strategic Positioning
9.8.4 Info Graphic Analysis
9.9 Trelleborg AB
9.9.1 Company Overview
9.9.2 Financial Analysis
9.9.3 Strategic Positioning
9.9.4 Info Graphic Analysis
9.10 The Port of Rotterdam
9.10.1 Company Overview
9.10.2 Financial Analysis
9.10.3 Strategic Positioning
9.10.4 Info Graphic Analysis
9.11 Other Companies
9.11.1 Company Overview
9.11.2 Financial Analysis
9.11.3 Strategic Positioning
9.11.4 Info Graphic Analysis
The Global Smart Ports Market has been studied from the year 2019 till 2026. However, the CAGR provided in the report is from the year 2021 to 2026. The research methodology involved three stages: Desk research, Primary research, and Analysis & Output from the entire research process.

The desk research involved a robust background study which meant referring to paid and unpaid databases to understand the market dynamics; mapping contracts from press releases; identifying the key players in the market, studying their product portfolio, competition level, annual reports/SEC filings & investor presentations; and learning the demand and supply-side analysis for the Smart Ports Market.

The primary research activity included telephonic conversations with more than 50 tier 1 industry consultants, distributors, and end-use product manufacturers.

Finally, based on the above thorough research process, an in-depth analysis was carried out considering the following aspects: market attractiveness, current & future market trends, market share analysis, SWOT analysis of the company and customer analytics.

Frequently Asked Questions

This FREE sample includes market data points, ranging from trend analyses to market estimates & forecasts. See for yourself.
Or view our licence options:
Tailor made solutions just for you
80% of our clients seek made-to-order reports. How do you want us to tailor yours?
OUR CLIENTS


