This report was recently updated on August 12 2025 with the latest and most recent
market numbers
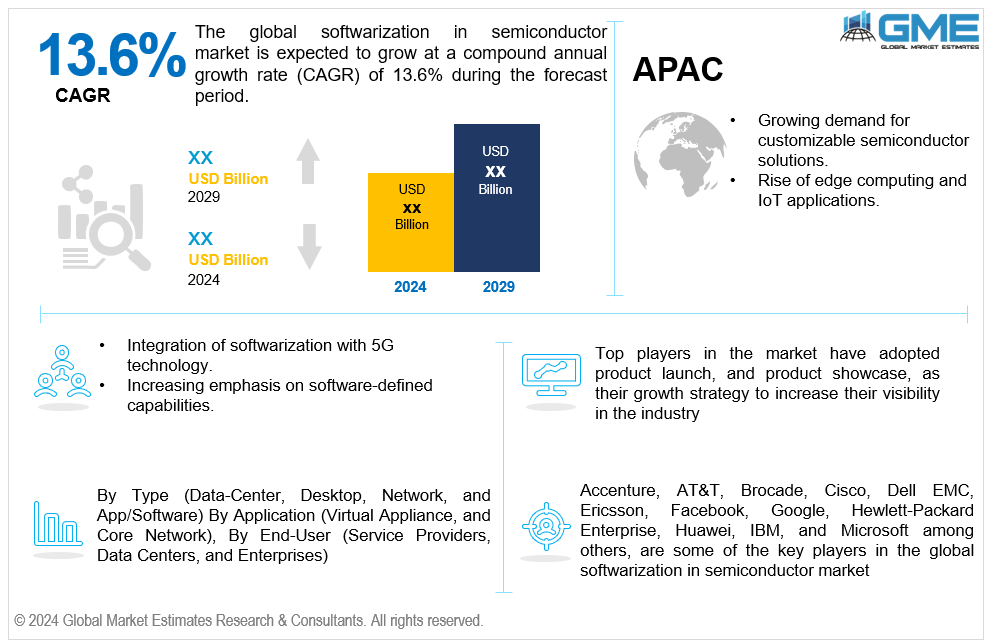
Global Softwarization in Semiconductor Market Size, Trends & Analysis - Forecasts to 2029 By Type (Data-Center, Desktop, Network, and App/Software) By Application (Virtual Appliance and Core Network), By End User (Service Providers, Data Centers, and Enterprises), and By Region (North America, Asia Pacific, Central and South America, Europe, and Middle East and Africa), Competitive Landscape, Company Market Share Analysis, and End User Analysis
The global softwarization in semiconductor market is estimated to exhibit a CAGR of 13.6% from 2024 to 2029.
In the semiconductor industry, softwarization signifies a notable shift towards integrating software-centric approaches into semiconductor devices' design, development, and functionality. Traditionally, these devices were primarily hardware-focused, relying on physical components to determine their primary function. However, the landscape is changing, and softwarization has emerged as a paradigm shift.
Incorporating software-defined capabilities into semiconductor devices increases flexibility, scalability, and adaptability. This transformation allows manufacturers to reconfigure and update functionalities through software updates, reducing the need for physical alterations. Softwarization is particularly evident in applications like field-programmable gate arrays (FPGAs), where re-programmability is crucial. Additionally, the advent of softwarization in semiconductors is driving advancements in artificial intelligence (AI), edge computing, and the Internet of Things (IoT). It empowers devices to process complex algorithms, adapt to changing requirements, and support diverse applications. This shift toward softwarization is reshaping the semiconductor industry, fostering innovation, and enhancing the efficiency of electronic devices across various sectors. With the growing demand for more agile and versatile semiconductor solutions, softwarization is expected to play a pivotal role in shaping the future of semiconductor technologies.
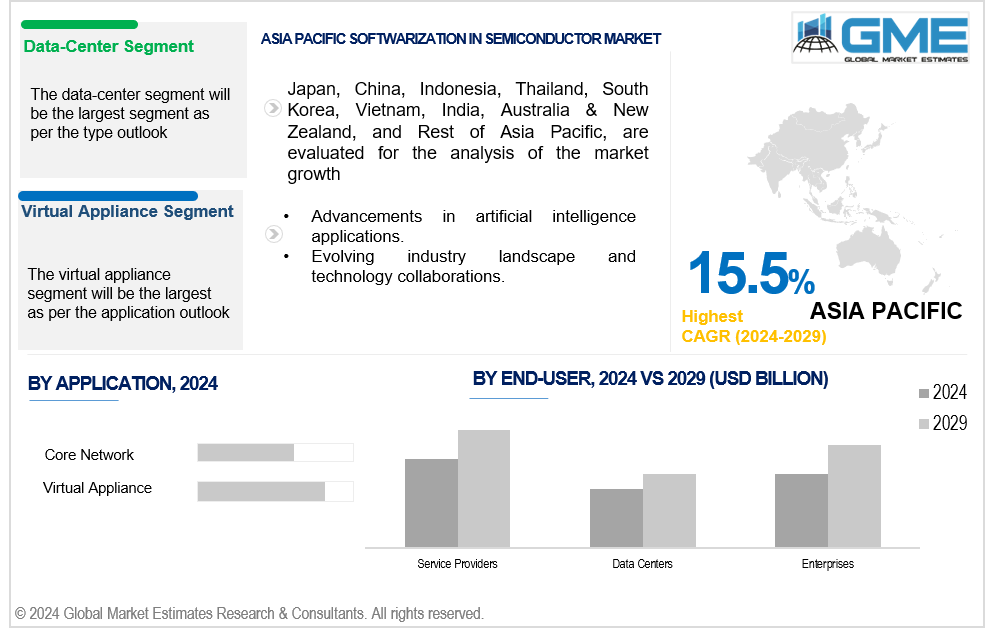
The data-center segment is expected to hold the largest share of the market. The growth is primarily driven by the increasing demand for robust and scalable infrastructure to support the burgeoning volume of digital data. Furthermore, with the rising prevalence of cloud computing, big data analytics, and other data-intensive applications, organizations invest significantly in data-center solutions. This includes servers, storage systems, and networking equipment tailored for efficient data processing and storage, contributing to the dominance of the data-center segment.
The app/software segment is experiencing rapid growth and is fuelled by the continuous evolution of software applications and their integral role in various industries. The increasing reliance on applications for business operations, communication, and productivity propels the demand for innovative and specialized software solutions. With the advent of technologies like artificial intelligence, augmented reality, and blockchain, the app/software segment is witnessing dynamic advancements, making it the fastest-growing segment in the market. The need for efficient and tailored software applications across diverse sectors is a key factor driving the accelerated growth of this segment.
Global Softwarization in Semiconductor Market: By Application
The virtual appliance segment is expected to be the fastest-growing segment during the forecast period. The main networking functions included in a virtual appliance include traffic forwarding, traffic monitoring, security, caching, intrusion detection, and domain name service, among others. Virtual Customer Premise Equipment (VCPe) is commonly used for these processes over the edge. This has had a significant impact on the businesses' efforts to simplify their complex networks, and as a result, the market is anticipated to grow somewhat in the upcoming years.
Furthermore, virtual appliances are also analyzed as the largest segment in the market. This segment offers a flexible and scalable solution for organizations, allowing them to run multiple virtual instances on a single physical server. This approach leads to efficient resource utilization, cost savings, and enhanced agility in deploying applications. As businesses increasingly embrace virtualization technologies, the demand for virtual appliances is rising, contributing to the segment's accelerated growth.
Moreover, virtual appliances provide a streamlined and simplified deployment process compared to traditional hardware appliances. This simplicity and the ability to quickly adapt to changing workloads and IT environments make virtual appliances an attractive choice for enterprises seeking agile and scalable solutions. Additionally, the virtual appliance model aligns well with cloud computing trends, supporting organizations in transitioning to cloud-based infrastructures.
The enterprise segment is expected to grow at the highest CAGR during the forecast period. This growth can be attributed to several factors driving the adoption of virtual appliances within enterprises.
Enterprises are increasingly leveraging virtual appliances to streamline their IT infrastructure and optimize resource utilization. By deploying virtual appliances, organizations can achieve greater flexibility, scalability, and cost-effectiveness in managing their IT resources. Additionally, virtual appliances enable enterprises to provision and deploy new applications, services, and workloads rapidly, enhancing operational efficiency and agility.
Furthermore, the enterprise vertical is experiencing a growing demand for solutions supporting modern business requirements, such as digital transformation initiatives, cloud migration strategies, and hybrid IT environments.
North America is anticipated to dominate the global market, owing to established technological infrastructure, high adoption rates of advanced solutions, and a mature market ecosystem. The region boasts a strong presence of key market players and is characterized by significant investments in research and development activities. Moreover, a high awareness among businesses and consumers regarding the benefits of virtual appliances contributes to the region's leadership position. North America's well-established IT landscape and robust regulatory framework position it as a key hub for the softwarization in semiconductor market.
Meanwhile, the Asia Pacific region is poised to experience the highest growth rate in the global market. The increasing digitization initiatives, expanding IT spending, and surge in cloud adoption across countries like China, India, and Japan drive the demand for virtual appliances. The rapid economic development and a growing emphasis on enhancing IT infrastructure create a conducive environment for the widespread adoption of virtual appliances in the APAC region. The rising number of businesses leveraging advanced technologies and the shift towards modernizing IT capabilities contribute to the accelerated growth of the softwarization in semiconductor market in Asia Pacific.
Accenture, AT&T, Brocade, Cisco, Dell EMC, Ericsson, Facebook, Google, Hewlett-Packard Enterprise, Huawei, IBM, and Microsoft among others, are some of the key players in the global softwarization in semiconductor market.
Please note: This is not an exhaustive list of companies profiled in the report.
In May 2023, NTT Corporation demonstrated that power-saving enablers, technologies developed through NTT's research, could reduce the power consumption of software-based virtualized base stations by up to 46% in an environment similar to an actual commercial network.
In November 2019, VMware extended its collaboration with Nokia, focusing on enhancing large-scale multi-cloud operations. The partnership emphasizes increased investments, technological collaboration, and advanced research and development efforts to create integrated solutions.
1 STRATEGIC INSIGHTS ON NEW REVENUE POCKETS
1.1 Strategic Opportunity & Attractiveness Analysis
1.1.1 Hot Revenue Pockets
1.1.2 Market Attractiveness Score
1.1.3 Revenue Impacting Opportunity
1.1.4 High Growing Region/Country
1.1.5 Competitor Analysis
1.1.6 Consumer Analysis
1.2 Global Market Estimates' View
1.3 Strategic Insights across Business Functions
1.3.1 For Chief Executive Officers
1.3.2 For Chief Marketing Officers
1.3.3 For Chief Strategy Officers
1.4 Evaluate the Potential of your Existing Business Lines vs. New Lines to Enter Into
2 TECHNOLOGICAL TRENDS
2.1 Technological Adoption Rate
2.2 Current Trend Impact Analysis
2.3 Future Trend Impact Analysis
3 GLOBAL SOFTWARIZATION IN SEMICONDUCTOR MARKET OUTLOOK
3.1 Market Pyramid Analysis
3.1.1 Introduction
3.1.2 Adjacent Market Opportunities
3.1.3 Ancillary Market Opportunities
3.2 Demand Side Analysis
3.2.1 Market Drivers: Impact Analysis
3.2.2 Market Restraints: Impact Analysis
3.2.3 Market Opportunities: Impact Analysis
3.2.4 Market Challenges: Impact Analysis
3.3 Supply Side Analysis
3.3.1 Porter’s Five Forces Analysis
3.3.1.1 Threat of New Entrants
3.3.1.2 Threat of New Substitutes
3.3.1.3 Bargaining Power of Suppliers
3.3.1.4 Bargaining Power of Buyers
3.3.1.5 Intensity of Competitive Rivalry
3.3.2 SWOT Analysis; By Factor (Political & Legal, Economic, and Technological)
3.3.2.1 Political Landscape
3.3.2.2 Economic Landscape
3.3.2.3 Social Landscape
3.3.2.4 Technology Landscape
3.3.3 Value Chain Analysis
3.3.4 Trend Analysis
3.3.5 Gap Analysis
3.3.6 Cost Analysis
4 GLOBAL SOFTWARIZATION IN SEMICONDUCTOR MARKET, BY TYPE
4.1 Introduction
4.2 Softwarization in Semiconductor Market: Type Scope Key Takeaways
4.3 Revenue Growth Analysis, 2023 & 2029
4.4 Data-Center
4.4.1 Data-Center Market Estimates and Forecast, 2021-2029 (USD Million)
4.5 Desktop
4.5.1 Desktop Market Estimates and Forecast, 2021-2029 (USD Million)
4.6 App/Software
4.6.1 App/Software Market Estimates and Forecast, 2021-2029 (USD Million)
4.7 Network
4.7.1 Network Market Estimates and Forecast, 2021-2029 (USD Million)
5 GLOBAL SOFTWARIZATION IN SEMICONDUCTOR MARKET, BY APPLICATION
5.1 Introduction
5.2 Softwarization in Semiconductor Market: Application Scope Key Takeaways
5.3 Revenue Growth Analysis, 2023 & 2029
5.4 Virtual Appliance
5.4.1 Virtual Appliance Market Estimates and Forecast, 2021-2029 (USD Million)
5.5 Core Network
5.5.1 Core Network Market Estimates and Forecast, 2021-2029 (USD Million)
6 GLOBAL SOFTWARIZATION IN SEMICONDUCTOR MARKET, BY END USER
6.1 Introduction
6.2 Softwarization in Semiconductor Market: End User Scope Key Takeaways
6.3 Revenue Growth Analysis, 2023 & 2029
6.4 Enterprise
6.4.1 Enterprise Market Estimates and Forecast, 2021-2029 (USD Million)
6.5 Data Centers
6.5.1 Data Centers Market Estimates and Forecast, 2021-2029 (USD Million)
6.6 Service Providers
6.6.1 Service Providers Market Estimates and Forecast, 2021-2029 (USD Million)
7 GLOBAL SOFTWARIZATION IN SEMICONDUCTOR MARKET, BY REGION
7.1 Introduction
7.2 North America Softwarization in Semiconductor Market Estimates and Forecast, 2021-2029 (USD Million)
7.2.1 By Type
7.2.2 By Application
7.2.3 By End User
7.2.4 By Country
7.2.4.1 U.S. Softwarization in Semiconductor Market Estimates and Forecast, 2021-2029 (USD Million)
7.2.4.1.1 By Type
7.2.4.1.2 By Application
7.2.4.1.3 By End User
7.2.4.2 Canada Softwarization in Semiconductor Market Estimates and Forecast, 2021-2029 (USD Million)
7.2.4.2.1 By Type
7.2.4.2.2 By Application
7.2.4.2.3 By End User
7.2.4.3 Mexico Softwarization in Semiconductor Market Estimates and Forecast, 2021-2029 (USD Million)
7.2.4.3.1 By Type
7.2.4.3.2 By Application
7.2.4.3.3 By End User
7.3 Europe Softwarization in Semiconductor Market Estimates and Forecast, 2021-2029 (USD Million)
7.3.1 By Type
7.3.2 By Application
7.3.3 By End User
7.3.4 By Country
7.3.4.1 Germany Softwarization in Semiconductor Market Estimates and Forecast, 2021-2029 (USD Million)
7.3.4.1.1 By Type
7.3.4.1.2 By Application
7.3.4.1.3 By End User
7.3.4.2 U.K. Softwarization in Semiconductor Market Estimates and Forecast, 2021-2029 (USD Million)
7.3.4.2.1 By Type
7.3.4.2.2 By Application
7.3.4.2.3 By End User
7.3.4.3 France Softwarization in Semiconductor Market Estimates and Forecast, 2021-2029 (USD Million)
7.3.4.3.1 By Type
7.3.4.3.2 By Application
7.3.4.3.3 By End User
7.3.4.4 Italy Softwarization in Semiconductor Market Estimates and Forecast, 2021-2029 (USD Million)
7.3.4.4.1 By Type
7.3.4.4.2 By Application
7.2.4.4.3 By End User
7.3.4.5 Spain Softwarization in Semiconductor Market Estimates and Forecast, 2021-2029 (USD Million)
7.3.4.5.1 By Type
7.3.4.5.2 By Application
7.2.4.5.3 By End User
7.3.4.6 Netherlands Softwarization in Semiconductor Market Estimates and Forecast, 2021-2029 (USD Million)
7.3.4.6.1 By Type
7.3.4.6.2 By Application
7.2.4.6.3 By End User
7.3.4.7 Rest of Europe Softwarization in Semiconductor Market Estimates and Forecast, 2021-2029 (USD Million)
7.3.4.7.1 By Type
7.3.4.7.2 By Application
7.2.4.7.3 By End User
7.4 Asia Pacific Softwarization in Semiconductor Market Estimates and Forecast, 2021-2029 (USD Million)
7.4.1 By Type
7.4.2 By Application
7.4.3 By End User
7.4.4 By Country
7.4.4.1 China Softwarization in Semiconductor Market Estimates and Forecast, 2021-2029 (USD Million)
7.4.4.1.1 By Type
7.4.4.1.2 By Application
7.4.4.1.3 By End User
7.4.4.2 Japan Softwarization in Semiconductor Market Estimates and Forecast, 2021-2029 (USD Million)
7.4.4.2.1 By Type
7.4.4.2.2 By Application
7.4.4.2.3 By End User
7.4.4.3 India Softwarization in Semiconductor Market Estimates and Forecast, 2021-2029 (USD Million)
7.4.4.3.1 By Type
7.4.4.3.2 By Application
7.4.4.3.3 By End User
7.4.4.4 South Korea Softwarization in Semiconductor Market Estimates and Forecast, 2021-2029 (USD Million)
7.4.4.4.1 By Type
7.4.4.4.2 By Application
7.4.4.4.3 By End User
7.4.4.5 Singapore Softwarization in Semiconductor Market Estimates and Forecast, 2021-2029 (USD Million)
7.4.4.5.1 By Type
7.4.4.5.2 By Application
7.4.4.5.3 By End User
7.4.4.6 Malaysia Softwarization in Semiconductor Market Estimates and Forecast, 2021-2029 (USD Million)
7.4.4.6.1 By Type
7.4.4.6.2 By Application
7.4.4.6.3 By End User
7.4.4.7 Thailand Softwarization in Semiconductor Market Estimates and Forecast, 2021-2029 (USD Million)
7.4.4.7.1 By Type
7.4.4.7.2 By Application
7.4.4.7.3 By End User
7.4.4.8 Indonesia Softwarization in Semiconductor Market Estimates and Forecast, 2021-2029 (USD Million)
7.4.4.8.1 By Type
7.4.4.8.2 By Application
7.4.4.8.3 By End User
7.4.4.9 Vietnam Softwarization in Semiconductor Market Estimates and Forecast, 2021-2029 (USD Million)
7.4.4.9.1 By Type
7.4.4.9.2 By Application
7.4.4.9.3 By End User
7.4.4.10 Taiwan Softwarization in Semiconductor Market Estimates and Forecast, 2021-2029 (USD Million)
7.4.4.10.1 By Type
7.4.4.10.2 By Application
7.4.4.10.3 By End User
7.4.4.11 Rest of Asia Pacific Softwarization in Semiconductor Market Estimates and Forecast, 2021-2029 (USD Million)
7.4.4.11.1 By Type
7.4.4.11.2 By Application
7.4.4.11.3 By End User
7.5 Middle East and Africa Softwarization in Semiconductor Market Estimates and Forecast, 2021-2029 (USD Million)
7.5.1 By Type
7.5.2 By Application
7.5.3 By End User
7.5.4 By Country
7.5.4.1 Saudi Arabia Softwarization in Semiconductor Market Estimates and Forecast, 2021-2029 (USD Million)
7.5.4.1.1 By Type
7.5.4.1.2 By Application
7.5.4.1.3 By End User
7.5.4.2 U.A.E. Softwarization in Semiconductor Market Estimates and Forecast, 2021-2029 (USD Million)
7.5.4.2.1 By Type
7.5.4.2.2 By Application
7.5.4.2.3 By End User
7.5.4.3 Israel Softwarization in Semiconductor Market Estimates and Forecast, 2021-2029 (USD Million)
7.5.4.3.1 By Type
7.5.4.3.2 By Application
7.5.4.3.3 By End User
7.5.4.4 South Africa Softwarization in Semiconductor Market Estimates and Forecast, 2021-2029 (USD Million)
7.5.4.4.1 By Type
7.5.4.4.2 By Application
7.5.4.4.3 By End User
7.5.4.5 Rest of Middle East and Africa Softwarization in Semiconductor Market Estimates and Forecast, 2021-2029 (USD Million)
7.5.4.5.1 By Type
7.5.4.5.2 By Application
7.5.4.5.2 By End User
7.6 Central and South America Softwarization in Semiconductor Market Estimates and Forecast, 2021-2029 (USD Million)
7.6.1 By Type
7.6.2 By Application
7.6.3 By End User
7.6.4 By Country
7.6.4.1 Brazil Softwarization in Semiconductor Market Estimates and Forecast, 2021-2029 (USD Million)
7.6.4.1.1 By Type
7.6.4.1.2 By Application
7.6.4.1.3 By End User
7.6.4.2 Argentina Softwarization in Semiconductor Market Estimates and Forecast, 2021-2029 (USD Million)
7.6.4.2.1 By Type
7.6.4.2.2 By Application
7.6.4.2.3 By End User
7.6.4.3 Chile Softwarization in Semiconductor Market Estimates and Forecast, 2021-2029 (USD Million)
7.6.4.3.1 By Type
7.6.4.3.2 By Application
7.6.4.3.3 By End User
7.6.4.4 Rest of Central and South America Softwarization in Semiconductor Market Estimates and Forecast, 2021-2029 (USD Million)
7.6.4.4.1 By Type
7.6.4.4.2 By Application
7.6.4.4.3 By End User
8 COMPETITIVE LANDCAPE
8.1 Company Market Share Analysis
8.2 Four Quadrant Positioning Matrix
8.2.1 Market Leaders
8.2.2 Market Visionaries
8.2.3 Market Challengers
8.2.4 Niche Market Players
8.3 Vendor Landscape
8.3.1 North America
8.3.2 Europe
8.3.3 Asia Pacific
8.3.4 Rest of the World
8.4 Company Profiles
8.4.1 Accenture
8.4.1.1 Business Description & Financial Analysis
8.4.1.2 SWOT Analysis
8.4.1.3 Products & Services Offered
8.4.1.4 Strategic Alliances between Business Partners
8.4.2 AT&T
8.4.2.1 Business Description & Financial Analysis
8.4.2.2 SWOT Analysis
8.4.2.3 Products & Services Offered
8.4.2.4 Strategic Alliances between Business Partners
8.4.3 Brocade
8.4.3.1 Business Description & Financial Analysis
8.4.3.2 SWOT Analysis
8.4.3.3 Products & Services Offered
8.4.3.4 Strategic Alliances between Business Partners
8.4.4 Cisco
8.4.4.1 Business Description & Financial Analysis
8.4.4.2 SWOT Analysis
8.4.4.3 Products & Services Offered
8.4.4.4 Strategic Alliances between Business Partners
8.4.5 Dell EMC
8.4.5.1 Business Description & Financial Analysis
8.4.5.2 SWOT Analysis
8.4.5.3 Products & Services Offered
8.4.5.4 Strategic Alliances between Business Partners
8.4.6 ERICSSON
8.4.6.1 Business Description & Financial Analysis
8.4.6.2 SWOT Analysis
8.4.6.3 Products & Services Offered
8.4.6.4 Strategic Alliances between Business Partners
8.4.7 Hewlett-Packard Enterprise
8.4.7.1 Business Description & Financial Analysis
8.4.7.2 SWOT Analysis
8.4.7.3 Products & Services Offered
8.4.8.4 Strategic Alliances between Business Partners
8.4.8 Huawei
8.4.8.1 Business Description & Financial Analysis
8.4.8.2 SWOT Analysis
8.4.8.3 Products & Services Offered
8.4.8.4 Strategic Alliances between Business Partners
8.4.9 Microsoft
8.4.9.1 Business Description & Financial Analysis
8.4.9.2 SWOT Analysis
8.4.9.3 Products & Services Offered
8.4.9.4 Strategic Alliances between Business Partners
8.4.10 Facebook
8.4.10.1 Business Description & Financial Analysis
8.4.10.2 SWOT Analysis
8.4.10.3 Products & Services Offered
8.4.10.4 Strategic Alliances between Business Partners
8.4.11 Google
8.4.11.1 Business Description & Financial Analysis
8.4.11.2 SWOT Analysis
8.4.11.3 Products & Services Offered
8.4.11.4 Strategic Alliances between Business Partners
8.4.12 IBM
8.4.12.1 Business Description & Financial Analysis
8.4.12.2 SWOT Analysis
8.4.12.3 Products & Services Offered
8.4.12.4 Strategic Alliances between Business Partners
8.4.13 Other Companies
8.4.13.1 Business Description & Financial Analysis
8.4.13.2 SWOT Analysis
8.4.13.3 Products & Services Offered
8.4.13.4 Strategic Alliances between Business Partners
9 RESEARCH METHODOLOGY
9.1 Market Introduction
9.1.1 Market Definition
9.1.2 Market Scope & Segmentation
9.2 Information Procurement
9.2.1 Secondary Research
9.2.1.1 Purchased Databases
9.2.1.2 GMEs Internal Data Repository
9.2.1.3 Secondary Resources & Third Party Perspectives
9.2.1.4 Company Information Sources
9.2.2 Primary Research
9.2.2.1 Various Types of Respondents for Primary Interviews
9.2.2.2 Number of Interviews Conducted throughout the Research Process
9.2.2.3 Primary Stakeholders
9.2.2.4 Discussion Guide for Primary Participants
9.2.3 Expert Panels
9.2.3.1 Expert Panels Across 30+ Industry
9.2.4 Paid Local Experts
9.2.4.1 Paid Local Experts Across 30+ Industry Across each Region
9.3 Market Estimation
9.3.1 Top-Down Approach
9.3.1.1 Macro-Economic Indicators Considered
9.3.1.2 Micro-Economic Indicators Considered
9.3.2 Bottom Up Approach
9.3.2.1 Company Share Analysis Approach
9.3.2.2 Estimation of Potential Type Sales
9.4 Data Triangulation
9.4.1 Data Collection
9.4.2 Time Series, Cross Sectional & Panel Data Analysis
9.4.3 Cluster Analysis
9.5 Analysis and Output
9.5.1 Inhouse AI Based Real Time Analytics Tool
9.5.2 Output From Desk & Primary Research
9.6 Research Assumptions & Limitations
9.7.1 Research Assumptions
9.7.2 Research Limitations
LIST OF TABLES
1 Global Softwarization in Semiconductor Market, By Type, 2021-2029 (USD Mllion)
2 Data-Center Market, By Region, 2021-2029 (USD Mllion)
3 Desktop Market, By Region, 2021-2029 (USD Mllion)
4 App/Software Market, By Region, 2021-2029 (USD Mllion)
5 Network Market, By Region, 2021-2029 (USD Mllion)
6 Global Softwarization in Semiconductor Market, By Application, 2021-2029 (USD Mllion)
7 Virtual Appliance Market, By Region, 2021-2029 (USD Mllion)
8 Core Network Market, By Region, 2021-2029 (USD Mllion)
9 Global Softwarization in Semiconductor Market, By End User, 2021-2029 (USD Mllion)
10 Enterprise Market, By Region, 2021-2029 (USD Mllion)
11 Data Centers Market, By Region, 2021-2029 (USD Mllion)
12 Service Providers Market, By Region, 2021-2029 (USD Mllion)
13 Regional Analysis, 2021-2029 (USD Mllion)
14 North America Softwarization in Semiconductor Market, By Type, 2021-2029 (USD Million)
15 North America Softwarization in Semiconductor Market, By Application, 2021-2029 (USD Million)
16 North America Softwarization in Semiconductor Market, By End User, 2021-2029 (USD Million)
17 North America Softwarization in Semiconductor Market, By Country, 2021-2029 (USD Million)
18 U.S Softwarization in Semiconductor Market, By Type, 2021-2029 (USD Million)
19 U.S Softwarization in Semiconductor Market, By Application, 2021-2029 (USD Million)
20 U.S Softwarization in Semiconductor Market, By End User, 2021-2029 (USD Million)
21 Canada Softwarization in Semiconductor Market, By Type, 2021-2029 (USD Million)
22 Canada Softwarization in Semiconductor Market, By Application, 2021-2029 (USD Million)
23 Canada Softwarization in Semiconductor Market, By End User, 2021-2029 (USD Million)
24 Mexico Softwarization in Semiconductor Market, By Type, 2021-2029 (USD Million)
25 Mexico Softwarization in Semiconductor Market, By Application, 2021-2029 (USD Million)
26 Mexico Softwarization in Semiconductor Market, By End User, 2021-2029 (USD Million)
27 Europe Softwarization in Semiconductor Market, By Type, 2021-2029 (USD Million)
28 Europe Softwarization in Semiconductor Market, By Application, 2021-2029 (USD Million)
29 Europe Softwarization in Semiconductor Market, By End User, 2021-2029 (USD Million)
30 Europe Softwarization in Semiconductor Market, By Country 2021-2029 (USD Million)
31 Germany Softwarization in Semiconductor Market, By Type, 2021-2029 (USD Million)
32 Germany Softwarization in Semiconductor Market, By Application, 2021-2029 (USD Million)
33 Germany Softwarization in Semiconductor Market, By End User, 2021-2029 (USD Million)
34 U.K Softwarization in Semiconductor Market, By Type, 2021-2029 (USD Million)
35 U.K Softwarization in Semiconductor Market, By Application, 2021-2029 (USD Million)
36 U.K Softwarization in Semiconductor Market, By End User, 2021-2029 (USD Million)
37 France Softwarization in Semiconductor Market, By Type, 2021-2029 (USD Million)
38 France Softwarization in Semiconductor Market, By Application, 2021-2029 (USD Million)
39 France Softwarization in Semiconductor Market, By End User, 2021-2029 (USD Million)
40 Italy Softwarization in Semiconductor Market, By Type, 2021-2029 (USD Million)
41 Italy Softwarization in Semiconductor Market, By Application, 2021-2029 (USD Million)
42 Italy Softwarization in Semiconductor Market, By End User, 2021-2029 (USD Million)
43 Spain Softwarization in Semiconductor Market, By Type, 2021-2029 (USD Million)
44 Spain Softwarization in Semiconductor Market, By Application, 2021-2029 (USD Million)
45 Spain Softwarization in Semiconductor Market, By End User, 2021-2029 (USD Million)
46 Netherlands Softwarization in Semiconductor Market, By Type, 2021-2029 (USD Million)
47 Netherlands Softwarization in Semiconductor Market, By Application, 2021-2029 (USD Million)
48 Netherlands Softwarization in Semiconductor Market, By End User, 2021-2029 (USD Million)
49 Rest Of Europe Softwarization in Semiconductor Market, By Type, 2021-2029 (USD Million)
50 Rest Of Europe Softwarization in Semiconductor Market, By Application, 2021-2029 (USD Million)
51 Rest of Europe Softwarization in Semiconductor Market, By End User, 2021-2029 (USD Million)
52 Asia Pacific Softwarization in Semiconductor Market, By Type, 2021-2029 (USD Million)
53 Asia Pacific Softwarization in Semiconductor Market, By Application, 2021-2029 (USD Million)
54 Asia Pacific Softwarization in Semiconductor Market, By End User, 2021-2029 (USD Million)
55 Asia Pacific Softwarization in Semiconductor Market, By Country, 2021-2029 (USD Million)
56 China Softwarization in Semiconductor Market, By Type, 2021-2029 (USD Million)
57 China Softwarization in Semiconductor Market, By Application, 2021-2029 (USD Million)
58 China Softwarization in Semiconductor Market, By End User, 2021-2029 (USD Million)
59 India Softwarization in Semiconductor Market, By Type, 2021-2029 (USD Million)
60 India Softwarization in Semiconductor Market, By Application, 2021-2029 (USD Million)
61 India Softwarization in Semiconductor Market, By End User, 2021-2029 (USD Million)
62 Japan Softwarization in Semiconductor Market, By Type, 2021-2029 (USD Million)
63 Japan Softwarization in Semiconductor Market, By Application, 2021-2029 (USD Million)
64 Japan Softwarization in Semiconductor Market, By End User, 2021-2029 (USD Million)
65 South Korea Softwarization in Semiconductor Market, By Type, 2021-2029 (USD Million)
66 South Korea Softwarization in Semiconductor Market, By Application, 2021-2029 (USD Million)
67 South Korea Softwarization in Semiconductor Market, By End User, 2021-2029 (USD Million)
68 malaysia Softwarization in Semiconductor Market, By Type, 2021-2029 (USD Million)
69 malaysia Softwarization in Semiconductor Market, By Application, 2021-2029 (USD Million)
70 malaysia Softwarization in Semiconductor Market, By End User, 2021-2029 (USD Million)
71 Thailand Softwarization in Semiconductor Market, By Type, 2021-2029 (USD Million)
72 Thailand Softwarization in Semiconductor Market, By Application, 2021-2029 (USD Million)
73 Thailand Softwarization in Semiconductor Market, By End User, 2021-2029 (USD Million)
74 Indonesia Softwarization in Semiconductor Market, By Type, 2021-2029 (USD Million)
75 Indonesia Softwarization in Semiconductor Market, By Application, 2021-2029 (USD Million)
76 Indonesia Softwarization in Semiconductor Market, By End User, 2021-2029 (USD Million)
77 Vietnam Softwarization in Semiconductor Market, By Type, 2021-2029 (USD Million)
78 Vietnam Softwarization in Semiconductor Market, By Application, 2021-2029 (USD Million)
79 Vietnam Softwarization in Semiconductor Market, By End User, 2021-2029 (USD Million)
80 Taiwan Softwarization in Semiconductor Market, By Type, 2021-2029 (USD Million)
81 Taiwan Softwarization in Semiconductor Market, By Application, 2021-2029 (USD Million)
82 Taiwan Softwarization in Semiconductor Market, By End User, 2021-2029 (USD Million)
83 Rest of Asia Pacific Softwarization in Semiconductor Market, By Type, 2021-2029 (USD Million)
84 Rest of Asia Pacific Softwarization in Semiconductor Market, By Application, 2021-2029 (USD Million)
85 Rest of Asia Pacific Softwarization in Semiconductor Market, By End User, 2021-2029 (USD Million)
86 Middle East and Africa Softwarization in Semiconductor Market, By Type, 2021-2029 (USD Million)
87 Middle East and Africa Softwarization in Semiconductor Market, By Application, 2021-2029 (USD Million)
88 Middle East and Africa Softwarization in Semiconductor Market, By End User, 2021-2029 (USD Million)
89 Middle East and Africa Softwarization in Semiconductor Market, By Country, 2021-2029 (USD Million)
90 Saudi Arabia Softwarization in Semiconductor Market, By Type, 2021-2029 (USD Million)
91 Saudi Arabia Softwarization in Semiconductor Market, By Application, 2021-2029 (USD Million)
92 Saudi Arabia Softwarization in Semiconductor Market, By End User, 2021-2029 (USD Million)
93 UAE Softwarization in Semiconductor Market, By Type, 2021-2029 (USD Million)
94 UAE Softwarization in Semiconductor Market, By Application, 2021-2029 (USD Million)
95 UAE Softwarization in Semiconductor Market, By End User, 2021-2029 (USD Million)
96 Israel Softwarization in Semiconductor Market, By Type, 2021-2029 (USD Million)
97 Israel Softwarization in Semiconductor Market, By Application, 2021-2029 (USD Million)
98 Israel Softwarization in Semiconductor Market, By End User, 2021-2029 (USD Million)
99 South Africa Softwarization in Semiconductor Market, By Type, 2021-2029 (USD Million)
100 South Africa Softwarization in Semiconductor Market, By Application, 2021-2029 (USD Million)
101 South Africa Softwarization in Semiconductor Market, By End User, 2021-2029 (USD Million)
102 Rest of Middle East and Africa Softwarization in Semiconductor Market, By Type, 2021-2029 (USD Million)
103 Rest of Middle East and Africa Softwarization in Semiconductor Market, By Application, 2021-2029 (USD Million)
104 Rest of Middle East and Africa Softwarization in Semiconductor Market, By End User, 2021-2029 (USD Million)
105 Central and South America Softwarization in Semiconductor Market, By Type, 2021-2029 (USD Million)
106 Central and South America Softwarization in Semiconductor Market, By Application, 2021-2029 (USD Million)
107 Central and South America Softwarization in Semiconductor Market, By End User, 2021-2029 (USD Million)
108 Central and South America Softwarization in Semiconductor Market, By Country, 2021-2029 (USD Million)
109 Brazil Softwarization in Semiconductor Market, By Type, 2021-2029 (USD Million)
110 Brazil Softwarization in Semiconductor Market, By Application, 2021-2029 (USD Million)
111 Brazil Softwarization in Semiconductor Market, By End User, 2021-2029 (USD Million)
112 Argentina Softwarization in Semiconductor Market, By Type, 2021-2029 (USD Million)
113 Argentina Softwarization in Semiconductor Market, By Application, 2021-2029 (USD Million)
114 Argentina Softwarization in Semiconductor Market, By End User, 2021-2029 (USD Million)
115 Chile Softwarization in Semiconductor Market, By Type, 2021-2029 (USD Million)
116 Chile Softwarization in Semiconductor Market, By Application, 2021-2029 (USD Million)
117 Chile Softwarization in Semiconductor Market, By End User, 2021-2029 (USD Million)
118 Rest of Central and South America Softwarization in Semiconductor Market, By Type, 2021-2029 (USD Million)
119 Rest of Central and South America Softwarization in Semiconductor Market, By Application, 2021-2029 (USD Million)
120 Rest of Central and South America Softwarization in Semiconductor Market, By End User, 2021-2029 (USD Million)
121 Accenture: Products & Services Offering
122 AT&T: Products & Services Offering
123 Brocade: Products & Services Offering
124 Cisco: Products & Services Offering
125 Dell EMC: Products & Services Offering
126 ERICSSON: Products & Services Offering
127 Hewlett-Packard Enterprise : Products & Services Offering
128 Huawei: Products & Services Offering
129 Microsoft, Inc: Products & Services Offering
130 FACEBOOK: Products & Services Offering
131 GOOGLE: Products & Services Offering
132 IBM: Products & Services Offering
133 Other Companies: Products & Services Offering
LIST OF FIGURES
1 Global Softwarization in Semiconductor Market Overview
2 Global Softwarization in Semiconductor Market Value From 2021-2029 (USD Mllion)
3 Global Softwarization in Semiconductor Market Share, By Type (2023)
4 Global Softwarization in Semiconductor Market Share, By Application (2023)
5 Global Softwarization in Semiconductor Market Share, By End User (2023)
6 Global Softwarization in Semiconductor Market, By Region (Asia Pacific Market)
7 Technological Trends In Global Softwarization in Semiconductor Market
8 Four Quadrant Competitor Positioning Matrix
9 Impact Of Macro & Micro Indicators On The Market
10 Impact Of Key Drivers On The Global Softwarization in Semiconductor Market
11 Impact Of Challenges On The Global Softwarization in Semiconductor Market
12 Porter’s Five Forces Analysis
13 Global Softwarization in Semiconductor Market: By Type Scope Key Takeaways
14 Global Softwarization in Semiconductor Market, By Type Segment: Revenue Growth Analysis
15 Data-Center Market, By Region, 2021-2029 (USD Mllion)
16 Desktop Market, By Region, 2021-2029 (USD Mllion)
17 App/Software Market, By Region, 2021-2029 (USD Mllion)
18 Network Market, By Region, 2021-2029 (USD Mllion)
19 Global Softwarization in Semiconductor Market: By Application Scope Key Takeaways
20 Global Softwarization in Semiconductor Market, By Application Segment: Revenue Growth Analysis
21 Virtual Appliance Market, By Region, 2021-2029 (USD Mllion)
22 Core Network Market, By Region, 2021-2029 (USD Mllion)
23 Global Softwarization in Semiconductor Market: By End User Scope Key Takeaways
24 Global Softwarization in Semiconductor Market, By End User Segment: Revenue Growth Analysis
25 Enterprise Market, By Region, 2021-2029 (USD Mllion)
26 Data Centers Market, By Region, 2021-2029 (USD Mllion)
27 Service Providers Market, By Region, 2021-2029 (USD Mllion)
28 Regional Segment: Revenue Growth Analysis
29 Global Softwarization in Semiconductor Market: Regional Analysis
30 North America Softwarization in Semiconductor Market Overview
31 North America Softwarization in Semiconductor Market, By Type
32 North America Softwarization in Semiconductor Market, By Application
33 North America Softwarization in Semiconductor Market, By End User
34 North America Softwarization in Semiconductor Market, By Country
35 U.S. Softwarization in Semiconductor Market, By Type
36 U.S. Softwarization in Semiconductor Market, By Application
37 U.S. Softwarization in Semiconductor Market, By End User
38 Canada Softwarization in Semiconductor Market, By Type
39 Canada Softwarization in Semiconductor Market, By Application
40 Canada Softwarization in Semiconductor Market, By End User
41 Mexico Softwarization in Semiconductor Market, By Type
42 Mexico Softwarization in Semiconductor Market, By Application
43 Mexico Softwarization in Semiconductor Market, By End User
44 Four Quadrant Positioning Matrix
45 Company Market Share Analysis
46 Accenture: Company Snapshot
47 Accenture: SWOT Analysis
48 Accenture: Geographic Presence
49 AT&T: Company Snapshot
50 AT&T: SWOT Analysis
51 AT&T: Geographic Presence
52 Brocade: Company Snapshot
53 Brocade: SWOT Analysis
54 Brocade: Geographic Presence
55 Cisco: Company Snapshot
56 Cisco: Swot Analysis
57 Cisco: Geographic Presence
58 Dell EMC: Company Snapshot
59 Dell EMC: SWOT Analysis
60 Dell EMC: Geographic Presence
61 ERICSSON: Company Snapshot
62 ERICSSON: SWOT Analysis
63 ERICSSON: Geographic Presence
64 Hewlett-Packard Enterprise : Company Snapshot
65 Hewlett-Packard Enterprise : SWOT Analysis
66 Hewlett-Packard Enterprise : Geographic Presence
67 Huawei: Company Snapshot
68 Huawei: SWOT Analysis
69 Huawei: Geographic Presence
70 Microsoft, Inc.: Company Snapshot
71 Microsoft, Inc.: SWOT Analysis
72 Microsoft, Inc.: Geographic Presence
73 Facebook: Company Snapshot
74 Facebook: SWOT Analysis
75 Facebook: Geographic Presence
76 Google: Company Snapshot
77 Google: SWOT Analysis
78 Google: Geographic Presence
79 IBM: Company Snapshot
80 IBM: SWOT Analysis
81 IBM: Geographic Presence
82 Other Companies: Company Snapshot
83 Other Companies: SWOT Analysis
84 Other Companies: Geographic Presence
The Global Softwarization in Semiconductor Market has been studied from the year 2019 till 2029. However, the CAGR provided in the report is from the year 2024 to 2029. The research methodology involved three stages: Desk research, Primary research, and Analysis & Output from the entire research process.

The desk research involved a robust background study which meant referring to paid and unpaid databases to understand the market dynamics; mapping contracts from press releases; identifying the key players in the market, studying their product portfolio, competition level, annual reports/SEC filings & investor presentations; and learning the demand and supply-side analysis for the Softwarization in Semiconductor Market.

The primary research activity included telephonic conversations with more than 50 tier 1 industry consultants, distributors, and end-use product manufacturers.

Finally, based on the above thorough research process, an in-depth analysis was carried out considering the following aspects: market attractiveness, current & future market trends, market share analysis, SWOT analysis of the company and customer analytics.

Frequently Asked Questions

This FREE sample includes market data points, ranging from trend analyses to market estimates & forecasts. See for yourself.
Or view our licence options:
Tailor made solutions just for you
80% of our clients seek made-to-order reports. How do you want us to tailor yours?
OUR CLIENTS


