This report was recently updated on August 20 2025 with the latest and most recent
market numbers
Global Spinal Muscular Atrophy Treatment Market Size, Trends & Analysis - Forecasts to 2026 By Type (Type I, Type II, Type III and Type IV), Treatment (Gene Replacement Therapy and Drug Therapy), Route of Administration (Oral, Intrathecal and Others), Distribution Channel (Hospitals & Clinics, Pharmacies, Drug stores, Others), Competitive Landscape, Company Market Share Analysis, and Competitor Analysis
The global spinal muscular atrophy treatment market is projected to grow from USD 1.91 billion in 2021 to USD 15.01 billion by 2026 at a CAGR value of 30.6% from 2021 to 2026. Spinal muscular atrophy treatment is a condition that affects muscle functioning due to inherited/genetic disorders. The disease is triggered by the absence of a motor nerve that is responsible for walking, sitting, crawling, swallowing, and other brain functions as it connects to the brain and spinal cord.
The increasing incidence of spinal muscular atrophy, degenerative illnesses, and extensive awareness regarding SMA diagnoses and therapy amongst healthcare providers across the globe, the SMA treatment market is expected to increase exponentially. Moreover, rapidly evolving healthcare infrastructure across developing regions, as well as the increasing number of biologics and gene research activities, rising demand for novel drugs, are few of the drivers for the spinal muscular atrophy treatment market.
On the other hand, innovative therapeutic strategies for treating SMA are boosting the market growth. For instance, in May 2019, AveXis got regulatory approval in the United States for Zolgensma, a very effective gene immunotherapy for the cure of muscular dystrophy in children under age of two.
Due to the outbreak of COVID-19, many elective procedures have been cancelled or were postponed due to priority pandemic management. This has had a negative impact on the market’s growth. As per a study published in the British Journal of Surgical procedure, about 28.4 billion elective surgeries were cancelled or rescheduled internationally in May 2020, owing to COVID-19. However, many hospitals in developed countries have resumed elective procedures as the lockdowns were lifted. This trend acts as a promising factor for the market growth exponentially during the forecast period.
The rising acceptance rate of minimally invasive spinal operations, as well as the increasing technological breakthroughs in spinal surgery, are the major market drivers, especially post COVID-19 pandemic.
Nonetheless, the market is constrained by reasons such as higher healthcare prices and a scarcity of experienced experts for surgical operations and rehabilitation regimens in developing nations.
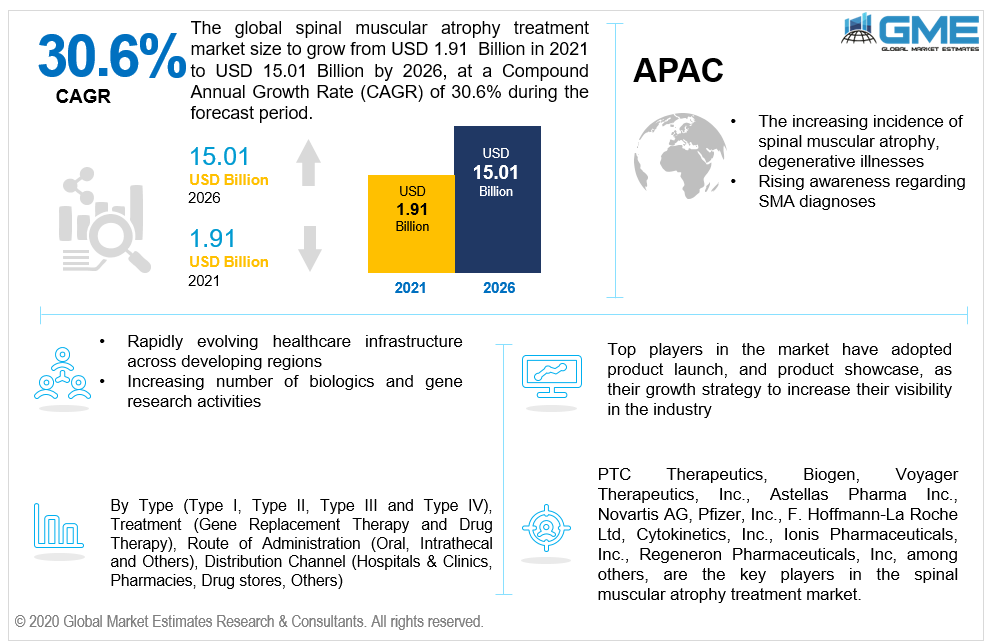
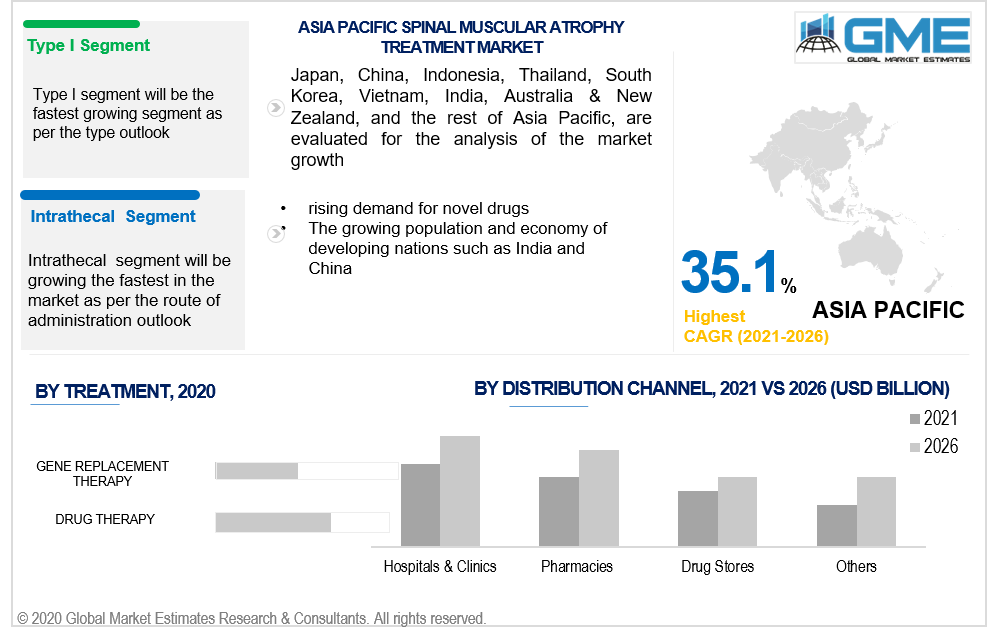
Based on the type, the market is segmented into Type I, Type II, Type III and Type IV. The market for the Type I segment is estimated to grow the largest during the forecast period. This segment's expansion is attributed to the high prevalence of Type 1 Spinal Muscular Atrophy in pediatric patients in developed and developing countries.
Increased awareness, acceptance of therapy modalities, and growing technological developments and R&D activities are all expected to contribute to segment expansion throughout the forecast period of 2021 to 2026.
Based on treatment, the market is segmented into gene replacement therapy and drug therapy. The drug therapy segment is expected to have the largest share in the market during the forecast period of 2021 to 2026. The rising adoption of pharmacological therapy and evolving healthcare infrastructure in developing regions are some of the prime factors driving the segment in the market.
Based on the route of administration, the market is segmented into oral, intrathecal and others. The market for the intrathecal segment is estimated to have the largest share during the forecast period of 2021 to 2026. Intrathecal therapy has a number of advantages over other routes of administration, including improved analgesia with fewer side effects and requirement of lower therapeutic dose. Intrathecal drug administration is when a therapeutic material is injected into the cerebrospinal fluid through the spinal cords subarachnoid space, bypassing the blood-brain barrier.
Based on distribution channel, the market is segmented into hospitals & clinics, pharmacies, drug stores, and others. The market for hospitals & clinics segment is estimated to have the largest during the forecast period from 2021 to 2026. The rising prevalence of gene related disorders, increasing need for early diagnosis, growing patient pool, and increasing research & development funding from the government hospitals, are some of the drivers of the segment in the market. Moreover, the availability of advanced equipment and technology in hospital, presence of trained and skilled healthcare professionals rising healthcare expenditure, enhanced health consciousness and increased health awareness amongst healthcare providers are propelling the segment to grow.
As per the geographical analysis, the spinal muscular atrophy treatment market can be classified into North America (the US, Canada, and Mexico), Asia Pacific (India, China, Japan, Malaysia, Singapore, and Rest of Asia Pacific), Europe (Germany, United Kingdom, Italy, France, Spain, Netherlands, and Rest of Europe), Middle East & Africa and Central South America.
During the forecast period, North America is expected to hold the largest share of the market. The dominant presence of top players of spinal muscular atrophy treatment devices, strong adoption rate of sophisticated technologies for genetic disorders for pediatric patients (the US public and private sector stakeholders are capitalizing on R&D for launching advanced therapeutic technologies), support from government, and rising awareness regarding SMAT are propelling the region’s market.
Owing to rising trend of the off shore research activities and the increasing number of innovative companies in the Asian region are some of the trends responsible for the highest CAGR of Asia Pacific market.
PTC Therapeutics, Biogen, Voyager Therapeutics, Inc., Astellas Pharma Inc., Novartis AG, Pfizer, Inc., F. Hoffmann-La Roche Ltd, CYTOKINETICS, INC., Ionis Pharmaceuticals, Inc., Regeneron Pharmaceuticals, Inc are the top players in spinal muscular atrophy treatment market.
Please note: This is not an exhaustive list of companies profiled in the report.
Chapter 1 Methodology
1.1 Market Scope & Definitions
1.2 Estimates & Forecast Calculation
1.3 Historical Data Overview and Validation
1.4 Data Sources
1.4.1 Secondary
1.4.2 Primary
Chapter 2 Report Outlook
2.1 Spinal Muscular Atrophy Treatment Industry Overview, 2020-2026
2.1.1 Industry Overview
2.1.2 Type Overview
2.1.3 Treatment Overview
2.1.4 Route of AdministrationOverview
2.1.5 Distribution Channel Overview
2.1.6 Regional Overview
Chapter 3 Spinal Muscular Atrophy Treatment Market Trends
3.1 Market Segmentation
3.2 Industry Background, 2020-2026
3.3 Market Key Trends
3.3.1 Positive Trends
3.3.1.1 Increasing prevalence of SMT
3.3.2 Industry Challenges
3.3.2.1 Expensive therapeutic techniques and a scarcity of experienced experts in developing nations
3.4 Prospective Growth Scenario
3.4.1 Type Growth Scenario
3.4.2 Route of AdministrationGrowth Scenario
3.4.3 Treatment Growth Scenario
3.4.4 Distribution Channel Growth Scenario
3.5 COVID-19 Influence over Industry Growth
3.6 Porter’s Analysis
3.7 PESTEL Analysis
3.8 Value Chain & Supply Chain Analysis
3.9 Regulatory Framework
3.9.1 North America
3.9.2 Europe
3.9.3 APAC
3.9.4 LATAM
3.9.5 MEA
3.10 End-User Overview
3.11 Market Share Analysis, 2020
3.11.1 Company Positioning Overview, 2020
Chapter 4 Spinal Muscular Atrophy Treatment Market, By Type
4.1 Type Outlook
4.2 Type I
4.2.1 Market Size, By Region, 2020-2026 (USD Billion)
4.3 Type II
4.3.1 Market Size, By Region, 2020-2026 (USD Billion)
4.4 Type III
4.4.1 Market Size, By Region, 2020-2026 (USD Billion)
4.5 Type IV
4.5.1 Market Size, By Region, 2020-2026 (USD Billion)
Chapter 5 Spinal Muscular Atrophy Treatment Market, By Treatment
5.1 Treatment Outlook
5.2 Gene Replacement Therapy
5.2.1 Market Size, By Region, 2020-2026 (USD Billion)
5.3 Drug Therapy
5.3.1 Market Size, By Region, 2020-2026 (USD Billion)
Chapter 6 Spinal Muscular Atrophy Treatment Market, By Route of Administration
6.1 Oral
6.1.1 Market Size, By Region, 2020-2026 (USD Billion)
6.2 Intrathecal
6.2.1 Market Size, By Region, 2020-2026 (USD Billion)
6.3 Others
6.3.1 Market Size, By Region, 2020-2026 (USD Billion)
Chapter 7 Spinal Muscular Atrophy Treatment Market, By Distribution Channel
7.1 Hospitals & Clinics, Pharmacies, Drug stores, Others
7.1.1 Market Size, By Region, 2020-2026 (USD Billion)
7.2 Pharmacies
7.2.1 Market Size, By Region, 2020-2026 (USD Billion)
7.3 Drug stores
7.3.1 Market Size, By Region, 2020-2026 (USD Billion)
7.4 Others
7.4.1 Market Size, By Region, 2020-2026 (USD Billion)
Chapter 8 Spinal Muscular Atrophy Treatment Market, By Region
8.1 Regional outlook
8.2 North America
8.2.1 Market Size, By Country 2020-2026 (USD Billion)
8.2.2 Market Size, By Type, 2020-2026 (USD Billion)
8.2.3 Market Size, By Treatment, 2020-2026 (USD Billion)
8.2.4 Market Size, By Route of Administration, 2020-2026 (USD Billion)
8.2.5 Market Size, By Distribution Channel, 2020-2026 (USD Billion)
8.2.6 U.S.
8.2.6.1 Market Size, By Type, 2020-2026 (USD Billion)
8.2.4.2 Market Size, By Treatment, 2020-2026 (USD Billion)
8.2.4.3 Market Size, By Route of Administration, 2020-2026 (USD Billion)
Market Size, By Distribution Channel, 2020-2026 (USD Billion)
8.2.7 Canada
8.2.7.1 Market Size, By Type, 2020-2026 (USD Billion)
8.2.7.2 Market Size, By Treatment, 2020-2026 (USD Billion)
8.2.7.3 Market Size, By Route of Administration, 2020-2026 (USD Billion)
8.2.7.4 Market Size, By Distribution Channel, 2020-2026 (USD Billion)
8.3 Europe
8.3.1 Market Size, By Country 2020-2026 (USD Billion)
8.3.2 Market Size, By Type, 2020-2026 (USD Billion)
8.3.3 Market Size, By Treatment, 2020-2026 (USD Billion)
8.3.4 Market Size, By Route of Administration, 2020-2026 (USD Billion)
8.3.5 Market Size, By Distribution Channel, 2020-2026 (USD Billion)
8.3.6 Germany
8.3.6.1 Market Size, By Type, 2020-2026 (USD Billion)
8.3.6.2 Market Size, By Treatment, 2020-2026 (USD Billion)
8.3.6.3 Market Size, By Route of Administration, 2020-2026 (USD Billion)
8.3.6.4 Market Size, By Distribution Channel, 2020-2026 (USD Billion)
8.3.7 UK
8.3.7.1 Market Size, By Type, 2020-2026 (USD Billion)
8.3.7.2 Market Size, By Treatment, 2020-2026 (USD Billion)
8.3.7.3 Market Size, By Route of Administration, 2020-2026 (USD Billion)
8.3.7.4 Market Size, By Distribution Channel, 2020-2026 (USD Billion)
8.3.8 France
8.3.8.1 Market Size, By Type, 2020-2026 (USD Billion)
8.3.8.2 Market Size, By Treatment, 2020-2026 (USD Billion)
8.3.8.3 Market Size, By Route of Administration, 2020-2026 (USD Billion)
8.3.8.4 Market Size, By Distribution Channel, 2020-2026 (USD Billion)
8.3.9 Italy
8.3.9.1 Market Size, By Type, 2020-2026 (USD Billion)
8.3.9.2 Market Size, By Treatment, 2020-2026 (USD Billion)
8.3.9.3 Market Size, By Route of Administration, 2020-2026 (USD Billion)
8.3.9.4 Market Size, By Distribution Channel, 2020-2026 (USD Billion)
8.3.10 Spain
8.3.10.1 Market Size, By Type, 2020-2026 (USD Billion)
8.3.10.2 Market Size, By Treatment, 2020-2026 (USD Billion)
8.3.10.3 Market Size, By Route of Administration, 2020-2026 (USD Billion)
8.3.10.4 Market Size, By Distribution Channel, 2020-2026 (USD Billion)
8.3.11 Russia
8.3.11.1 Market Size, By Type, 2020-2026 (USD Billion)
8.3.11.2 Market Size, By Treatment, 2020-2026 (USD Billion)
8.3.11.3 Market Size, By Route of Administration, 2020-2026 (USD Billion)
8.3.11.4 Market Size, By Distribution Channel, 2020-2026 (USD Billion)
8.4 Asia Pacific
8.4.1 Market Size, By Country 2020-2026 (USD Billion)
8.4.2 Market Size, By Type, 2020-2026 (USD Billion)
8.4.3 Market Size, By Treatment, 2020-2026 (USD Billion)
8.4.4 Market Size, By Route of Administration, 2020-2026 (USD Billion)
8.4.5 Market Size, By Distribution Channel, 2020-2026 (USD Billion)
8.4.6 China
8.4.6.1 Market Size, By Type, 2020-2026 (USD Billion)
8.4.6.2 Market Size, By Treatment, 2020-2026 (USD Billion)
8.4.6.3 Market Size, By Route of Administration, 2020-2026 (USD Billion)
8.4.6.4 Market Size, By Distribution Channel, 2020-2026 (USD Billion)
8.4.7 India
8.4.7.1 Market Size, By Type, 2020-2026 (USD Billion)
8.4.7.2 Market Size, By Treatment, 2020-2026 (USD Billion)
8.4.7.3 Market Size, By Route of Administration, 2020-2026 (USD Billion)
8.4.7.4 Market Size, By Distribution Channel, 2020-2026 (USD Billion)
8.4.8 Japan
8.4.8.1 Market Size, By Type, 2020-2026 (USD Billion)
8.4.8.2 Market Size, By Treatment, 2020-2026 (USD Billion)
8.4.8.3 Market Size, By Route of Administration, 2020-2026 (USD Billion)
8.4.8.4 Market Size, By Distribution Channel, 2020-2026 (USD Billion)
8.4.9 Australia
8.4.9.1 Market Size, By Type, 2020-2026 (USD Billion)
8.4.9.2 Market size, By Treatment, 2020-2026 (USD Billion)
8.4.9.3 Market Size, By Route of Administration, 2020-2026 (USD Billion)
8.4.9.4 Market Size, By Distribution Channel, 2020-2026 (USD Billion)
8.4.10 South Korea
8.4.10.1 Market Size, By Type, 2020-2026 (USD Billion)
8.4.10.2 Market Size, By Treatment, 2020-2026 (USD Billion)
8.4.10.3 Market Size, By Route of Administration, 2020-2026 (USD Billion)
8.4.10.4 Market Size, By Distribution Channel, 2020-2026 (USD Billion)
8.5 Latin America
8.5.1 Market Size, By Country 2020-2026 (USD Billion)
8.5.2 Market Size, By Type, 2020-2026 (USD Billion)
8.5.3 Market Size, By Treatment, 2020-2026 (USD Billion)
8.5.4 Market Size, By Route of Administration, 2020-2026 (USD Billion)
8.5.5 Market Size, By Distribution Channel, 2020-2026 (USD Billion)
8.5.6 Brazil
8.5.6.1 Market Size, By Type, 2020-2026 (USD Billion)
8.5.6.2 Market Size, By Treatment, 2020-2026 (USD Billion)
8.5.6.3 Market Size, By Route of Administration, 2020-2026 (USD Billion)
8.5.6.4 Market Size, By Distribution Channel, 2020-2026 (USD Billion)
8.5.7 Mexico
8.5.7.1 Market Size, By Type, 2020-2026 (USD Billion)
8.5.7.2 Market Size, By Treatment, 2020-2026 (USD Billion)
8.5.7.3 Market Size, By Route of Administration, 2020-2026 (USD Billion)
8.5.7.4 Market Size, By Distribution Channel, 2020-2026 (USD Billion)
8.5.8 Argentina
8.5.8.1 Market Size, By Type, 2020-2026 (USD Billion)
8.5.8.2 Market Size, By Treatment, 2020-2026 (USD Billion)
8.5.8.3 Market Size, By Route of Administration, 2020-2026 (USD Billion)
8.5.8.4 Market Size, By Distribution Channel, 2020-2026 (USD Billion)
8.6 MEA
8.6.1 Market Size, By Country 2020-2026 (USD Billion)
8.6.2 Market Size, By Type, 2020-2026 (USD Billion)
8.6.3 Market Size, By Treatment, 2020-2026 (USD Billion)
8.6.4 Market Size, By Route of Administration, 2020-2026 (USD Billion)
8.6.5 Market Size, By Distribution Channel, 2020-2026 (USD Billion)
8.6.6 Saudi Arabia
8.6.6.1 Market Size, By Type, 2020-2026 (USD Billion)
8.6.6.2 Market Size, By Treatment, 2020-2026 (USD Billion)
8.6.6.3 Market Size, By Route of Administration, 2020-2026 (USD Billion)
8.6.6.4 Market Size, By Distribution Channel, 2020-2026 (USD Billion)
8.6.7 UAE
8.6.7.1 Market Size, By Type, 2020-2026 (USD Billion)
8.6.7.2 Market Size, By Treatment, 2020-2026 (USD Billion)
8.6.7.3 Market Size, By Route of Administration, 2020-2026 (USD Billion)
8.6.7.4 Market Size, By Distribution Channel, 2020-2026 (USD Billion)
8.6.8 South Africa
8.6.8.1 Market Size, By Type, 2020-2026 (USD Billion)
8.6.8.2 Market Size, By Treatment, 2020-2026 (USD Billion)
8.6.8.3 Market Size, By Route of Administration, 2020-2026 (USD Billion)
8.6.8.4 Market Size, By Distribution Channel , 2020-2026 (USD Billion)
Chapter 9 Company Landscape
9.1 Competitive Analysis, 2020
9.2 PTC Therapeutics
9.2.1 Company Overview
9.2.2 Financial Analysis
9.2.3 Strategic Positioning
9.2.4 Info Graphic Analysis
9.3 Biogen
9.3.1 Company Overview
9.3.2 Financial Analysis
9.3.3 Strategic Positioning
9.3.4 Info Graphic Analysis
9.4 Voyager Therapeutics, Inc
9.4.1 Company Overview
9.4.2 Financial Analysis
9.4.3 Strategic Positioning
9.4.4 Info Graphic Analysis
9.5 Astellas Pharma Inc
9.5.1 Company Overview
9.5.2 Financial Analysis
9.5.3 Strategic Positioning
9.5.4 Info Graphic Analysis
9.6 Novartis AG
9.6.1 Company Overview
9.6.2 Financial Analysis
9.6.3 Strategic Positioning
9.6.4 Info Graphic Analysis
9.7 Pfizer, Inc
9.7.1 Company Overview
9.7.2 Financial Analysis
9.7.3 Strategic Positioning
9.7.4 Info Graphic Analysis
9.8 F. Hoffmann-La Roche Ltd
9.8.1 Company Overview
9.8.2 Financial Analysis
9.8.3 Strategic Positioning
9.8.4 Info Graphic Analysis
9.9 Cytokinetics, Inc
9.9.1 Company Overview
9.9.2 Financial Analysis
9.9.3 Strategic Positioning
9.9.4 Info Graphic Analysis
9.10 Ionis Pharmaceuticals, Inc
9.10.1 Company Overview
9.10.2 Financial Analysis
9.10.3 Strategic Positioning
9.10.4 Info Graphic Analysis
9.10 Other Companies
9.10.1 Company Overview
9.10.2 Financial Analysis
9.10.3 Strategic Positioning
9.10.4 Info Graphic Analysis
The Global Spinal Muscular Atrophy Treatment Market has been studied from the year 2019 till 2026. However, the CAGR provided in the report is from the year 2021 to 2026. The research methodology involved three stages: Desk research, Primary research, and Analysis & Output from the entire research process.

The desk research involved a robust background study which meant referring to paid and unpaid databases to understand the market dynamics; mapping contracts from press releases; identifying the key players in the market, studying their product portfolio, competition level, annual reports/SEC filings & investor presentations; and learning the demand and supply-side analysis for the Spinal Muscular Atrophy Treatment Market.

The primary research activity included telephonic conversations with more than 50 tier 1 industry consultants, distributors, and end-use product manufacturers.

Finally, based on the above thorough research process, an in-depth analysis was carried out considering the following aspects: market attractiveness, current & future market trends, market share analysis, SWOT analysis of the company and customer analytics.

Frequently Asked Questions

This FREE sample includes market data points, ranging from trend analyses to market estimates & forecasts. See for yourself.
Or view our licence options:
Tailor made solutions just for you
80% of our clients seek made-to-order reports. How do you want us to tailor yours?
OUR CLIENTS


