This report was recently updated on August 14 2025 with the latest and most recent
market numbers
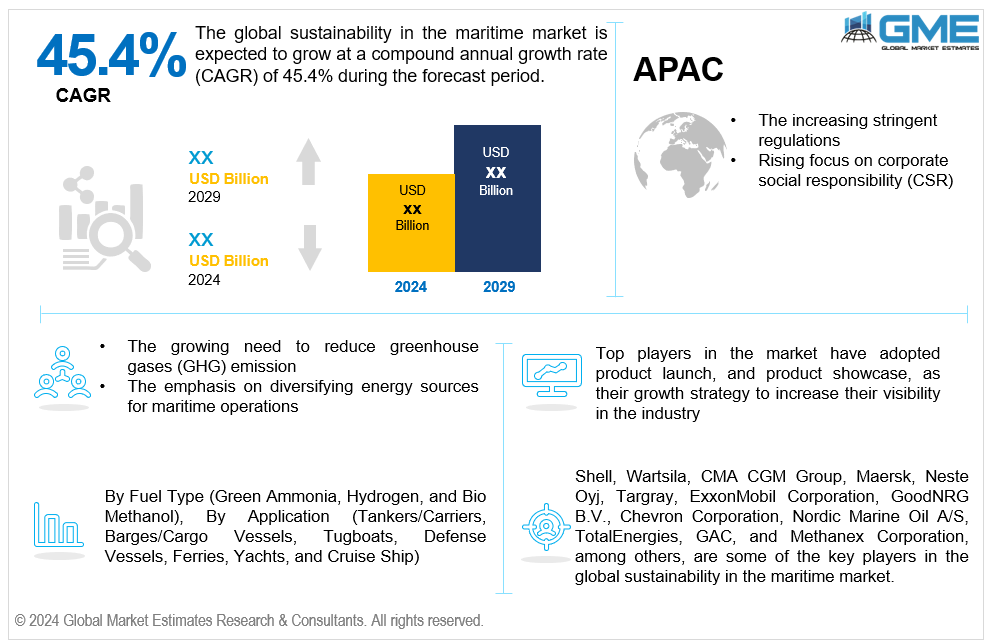
Global Sustainability in the Maritime Market Size, Trends & Analysis - Forecasts to 2029 By Fuel Type (Green Ammonia, Hydrogen, and Biomethanol), By Application (Tankers/Carriers, Barges/Cargo Vessels, Tugboats, Defense Vessels, Ferries, Yachts, and Cruise Ship), and By Region (North America, Asia Pacific, Central and South America, Europe, and Middle East and Africa), Competitive Landscape, Company Market Share Analysis, and End User Analysis
The global sustainability in the maritime market is estimated to exhibit a CAGR of 45.4% from 2024 to 2029.
The primary factors propelling the market growth are the increasing stringent regulations and rising focus on corporate social responsibility (CSR). Global entities, like the International Maritime Organization (IMO), have set guidelines mandating ships to curb their release of particulate matter, sulfur oxides, nitrogen oxides, and greenhouse gases. These directives compel firms to diminish their footprint by adopting eco-friendly fuels and technologies, like hydrogen, LNG (liquefied natural gas), low-sulfur fuels, and electric propulsion systems. For instance, due to the IMO 2020 sulfur cap regulation, which required a decrease in the amount of sulfur in marine fuels, sulfur emissions from ships were reportedly reduced by over 70%.
The growing need to reduce greenhouse gas (GHG) emissions and the emphasis on diversifying energy sources for maritime operations are expected to support the market growth. Using GHG emission reduction measures typically saves marine companies' expenses over the long run. The financial performance of shipping operations can be enhanced by reducing fuel consumption and operating expenses through investments in energy-efficient technologies, alternative fuels, and operational optimizations. Additionally, innovation and technical progress are driven by the requirement to reduce greenhouse gas emissions within the maritime sector. Companies spend money on R&D to create energy-efficient technology, alternative fuels, and cleaner propulsion systems, which advances the development of more environmentally friendly shipping methods. For instance, nearly 3% of global greenhouse gas emissions in 2022 were caused by international shipping alone, according to the maritime data solutions company Sinay.
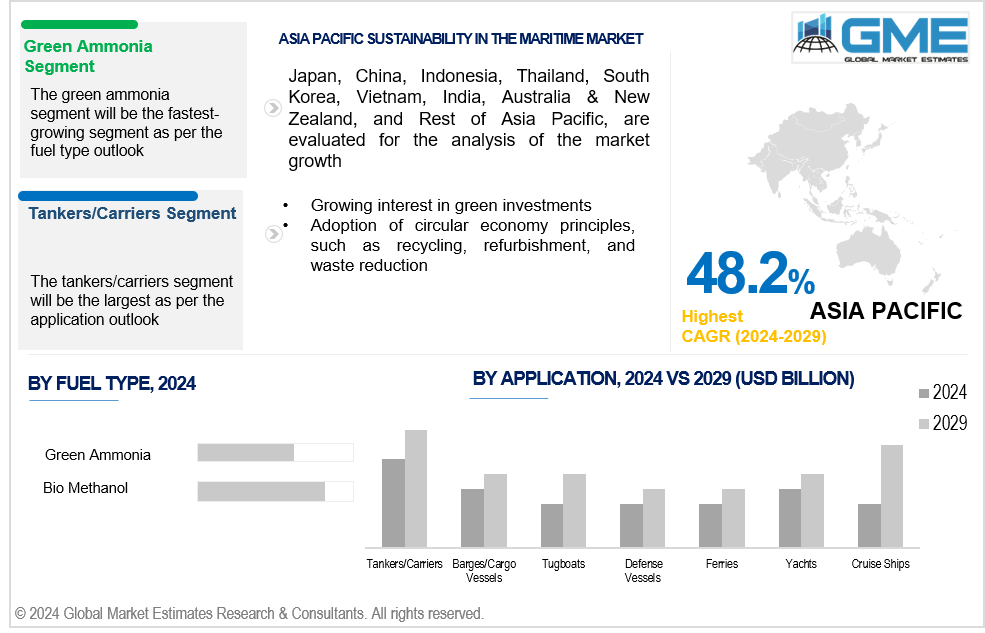
Growing interest in green investments and the adoption of circular economy principles, such as recycling, refurbishment, and waste reduction, propel market growth. The circular economy emphasizes resource conservation through the extension of product and material lifespans. Reusing materials is made possible by refurbishing and maintaining shipboard machinery and components, which lessens the demand for the extraction and creation of new resources. Additionally, recycling and disposing of waste responsibly also help keep marine habitats clean. Circular economy strategies reduce the amount of toxic substances released into the environment, which helps to preserve biodiversity and save delicate marine environments.
There is a growing demand for green port infrastructure and facilities equipped with shore power connections, LNG bunkering stations, waste management systems, and renewable energy installations, which creates opportunities in the market. Moreover, clean energy solutions can be integrated into maritime operations through the use of renewable energy sources such as hydrokinetic, solar, and wind power.
However, resistance to change within the maritime industry and inadequate infrastructure, such as limited availability of shore power facilities and others, hinder market growth.
The bio methanol segment is expected to hold the largest share of the market over the forecast period. Renewable biomass feedstocks, such as waste products, woody biomass, and agricultural residues, are used to make bio methanol. Since the carbon dioxide absorbed during the feedstock's growth balances out the carbon dioxide emitted after burning, bio methanol provides a sustainable and carbon-neutral alternative to fossil fuels. Additionally, with minimal disruption to current engine systems and infrastructure, bio methanol can be mixed with conventional methanol or utilized as a drop-in substitute for conventional maritime fuels. Due to this compatibility, switching to bio methanol for maritime companies is made simpler and requires less expensive new equipment purchases or major retrofitting.
The green ammonia segment is expected to be the fastest-growing segment in the market from 2024-2029. Green ammonia is more economically feasible due to advancements in ammonia production technology, such as electrolyzers and Haber-Bosch reactors, which have increased efficiency and decreased prices. The increasing competitiveness of green ammonia as a marine fuel is attributed to ongoing innovation and the scaling up of these technologies.
The tankers/carriers segment is expected to hold the largest share of the market over the forecast period. Bulk goods, including oil, liquefied natural gas (LNG), chemicals, and dry bulk cargoes like coal, ores, and grains, are mostly transported by tankers and carriers. These vessels handle a significant portion of global trade, carrying large volumes of goods across long distances, making them essential components of the maritime transportation system.
The cruise ship segment is anticipated to be the fastest-growing segment in the market from 2024-2029. Travelers looking for eco-friendly travel options are increasingly demanding experiences related to sustainable tourism. In order to remain competitive in the market and draw in environmentally concerned passengers, cruise companies are investing in sustainability efforts in response to this demand.
North America is expected to be the largest region in the global market. Law enforcement agencies in North America enforce regulations aimed at reducing ship emissions of pollutants such as sulfur oxides (SOx), nitrogen oxides (NOx), and particulate matter. These agencies include the Environmental Protection Agency (EPA) and the International Maritime Organization (IMO). Compliance with these regulations drives the adoption of cleaner fuels and technologies.
Asia Pacific is anticipated to witness rapid growth during the forecast period. The need for sustainability in the marine industry is being driven by rising shipping exports from the Asia Pacific region. The impact of maritime transportation on the environment increases with increased cargo volumes. Growing demands for sustainable practices in the marine sector result from concerns about greenhouse gas emissions, air and water pollution, and marine ecology destruction. For instance, in 2023, Asian ports loaded nearly 4.6 billion tons of commodities, or almost 42% of all goods carried in ports worldwide, according to the United Nations Conference on Trade and Development (UNCTAD).
Shell, Wartsila, CMA CGM Group, Maersk, Neste Oyj, Targray, ExxonMobil Corporation, GoodNRG B.V., Chevron Corporation, Nordic Marine Oil A/S, TotalEnergies, GAC, and Methanex Corporation, among others, are some of the key players in the global sustainability in the maritime market.
Please note: This is not an exhaustive list of companies profiled in the report.
In March 2024, CMA CGM and Nike established a partnership to lessen the carbon footprint of their marine transportation. By taking this step, Nike will cut their CO2 emissions by 25,000 tonnes, a significant step toward greener operations.
In February 2024, Shell and Hapag-Lloyd collaborated on marine fuel decarbonisation and signed a multi-year agreement to supply LNG (liquefied natural gas) to Hapag-Lloyd's ultra-large dual-fuel container vessels, which have a capacity of over 23,500 twenty-foot equivalent units (TEU).
1 STRATEGIC INSIGHTS ON NEW REVENUE POCKETS
1.1 Strategic Opportunity & Attractiveness Analysis
1.1.1 Hot Revenue Pockets
1.1.2 Market Attractiveness Score
1.1.3 Revenue Impacting Opportunity
1.1.4 High Growing Region/Country
1.1.5 Competitor Analysis
1.1.6 Consumer Analysis
1.2 Global Market Estimates' View
1.3 Strategic Insights across Business Functions
1.3.1 For Chief Executive Officers
1.3.2 For Chief Marketing Officers
1.3.3 For Chief Strategy Officers
1.4 Evaluate the Potential of your Existing Business Lines vs. New Lines to Enter Into
2 TECHNOLOGICAL TRENDS
2.1 Technological Adoption Rate
2.2 Current Trend Impact Analysis
2.3 Future Trend Impact Analysis
3 GLOBAL MARKET OUTLOOK
3.1 Market Pyramid Analysis
3.1.1 Introduction
3.1.2 Adjacent Market Opportunities
3.1.3 Ancillary Market Opportunities
3.2 Demand Side Analysis
3.2.1 Market Drivers: Impact Analysis
3.2.2 Market Restraints: Impact Analysis
3.2.3 Market Opportunities: Impact Analysis
3.2.4 Market Challenges: Impact Analysis
3.3 Supply Side Analysis
3.3.1 Porter’s Five Forces Analysis
3.3.1.1 Threat of New Entrants
3.3.1.2 Threat of New Substitutes
3.3.1.3 Bargaining Power of Suppliers
3.3.1.4 Bargaining Power of Buyers
3.3.1.5 Intensity of Competitive Rivalry
3.3.2 SWOT Analysis; By Factor (Political & Legal, Economic, and Technological)
3.3.2.1 Political Landscape
3.3.2.2 Economic Landscape
3.3.2.3 Social Landscape
3.3.2.4 Technology Landscape
3.3.3 Value Chain Analysis
3.3.4 Trend Analysis
3.3.5 Gap Analysis
3.3.6 Cost Analysis
4 GLOBAL SUSTAINABILITY IN THE MARITIME MARKET, BY FUEL TYPE
4.1 Introduction
4.2 Sustainability in the Maritime Market: Fuel Type Scope Key Takeaways
4.3 Revenue Growth Analysis, 2023 & 2029
4.4 Green Ammonia
4.4.1 Green Ammonia Market Estimates and Forecast, 2021-2029 (USD Million)
4.5 Hydrogen
4.5.1 Hydrogen Market Estimates and Forecast, 2021-2029 (USD Million)
4.6 Biomethanol
4.6.1 Biomethanol Market Estimates and Forecast, 2021-2029 (USD Million)
5 GLOBAL SUSTAINABILITY IN THE MARITIME MARKET, BY APPLICATION
5.1 Introduction
5.2 Sustainability in the Maritime Market: Type Scope Key Takeaways
5.3 Revenue Growth Analysis, 2023 & 2029
5.4 Tankers/Carriers
5.4.1 Tankers/Carriers Market Estimates and Forecast, 2021-2029 (USD Million)
5.5 Barges/Cargo Vessels
5.5.1 Barges/Cargo Vessels Market Estimates and Forecast, 2021-2029 (USD Million)
5.6 Tugboats
5.6.1 Tugboats Market Estimates and Forecast, 2021-2029 (USD Million)
5.7 Defense Vessels
5.7.1 Defense Vessels Market Estimates and Forecast, 2021-2029 (USD Million)
5.8 Ferries
5.8.1 Ferries Market Estimates and Forecast, 2021-2029 (USD Million)
5.9 Yachts
5.9.1 Yachts Market Estimates and Forecast, 2021-2029 (USD Million)
5.10 Cruise Ship
5.10.1 Cruise Ship Market Estimates and Forecast, 2021-2029 (USD Million)
6 GLOBAL SUSTAINABILITY IN THE MARITIME MARKET, BY REGION
6.1 Introduction
6.2 North America Sustainability in the Maritime Market Estimates and Forecast, 2021-2029 (USD Million)
6.2.1 By Fuel Type
6.2.2 By Application
6.2.3 By Country
6.2.3.1 U.S. Sustainability in the Maritime Market Estimates and Forecast, 2021-2029 (USD Million)
6.2.3.1.1 By Fuel Type
6.2.3.1.2 By Application
6.2.3.2 Canada Sustainability in the Maritime Market Estimates and Forecast, 2021-2029 (USD Million)
6.2.3.2.1 By Fuel Type
6.2.3.2.2 By Application
6.2.3.3 Mexico Sustainability in the Maritime Market Estimates and Forecast, 2021-2029 (USD Million)
6.2.3.3.1 By Fuel Type
6.2.3.3.2 By Application
6.3 Europe Sustainability in the Maritime Market Estimates and Forecast, 2021-2029 (USD Million)
6.3.1 By Fuel Type
6.3.2 By Application
6.3.3 By Country
6.3.3.1 Germany Sustainability in the Maritime Market Estimates and Forecast, 2021-2029 (USD Million)
6.3.3.1.1 By Fuel Type
6.3.3.1.2 By Application
6.3.3.2 U.K. Sustainability in the Maritime Market Estimates and Forecast, 2021-2029 (USD Million)
6.3.3.2.1 By Fuel Type
6.3.3.2.2 By Application
6.3.3.3 France Sustainability in the Maritime Market Estimates and Forecast, 2021-2029 (USD Million)
6.3.3.3.1 By Fuel Type
6.3.3.3.2 By Application
6.3.3.4 Italy Sustainability in the Maritime Market Estimates and Forecast, 2021-2029 (USD Million)
6.3.3.4.1 By Fuel Type
6.3.3.4.2 By Application
6.3.3.5 Spain Sustainability in the Maritime Market Estimates and Forecast, 2021-2029 (USD Million)
6.3.3.5.1 By Fuel Type
6.3.3.5.2 By Application
6.3.3.6 Netherlands Sustainability in the Maritime Market Estimates and Forecast, 2021-2029 (USD Million)
6.3.3.6.1 By Fuel Type
6.3.3.6.2 By Application
6.3.3.7 Rest of Europe Sustainability in the Maritime Market Estimates and Forecast, 2021-2029 (USD Million)
6.3.3.6.1 By Fuel Type
6.3.3.6.2 By Application
6.4 Asia Pacific Sustainability in the Maritime Market Estimates and Forecast, 2021-2029 (USD Million)
6.4.1 By Fuel Type
6.4.2 By Application
6.4.3 By Country
6.4.3.1 China Sustainability in the Maritime Market Estimates and Forecast, 2021-2029 (USD Million)
6.4.3.1.1 By Fuel Type
6.4.3.1.2 By Application
6.4.3.2 Japan Sustainability in the Maritime Market Estimates and Forecast, 2021-2029 (USD Million)
6.4.3.2.1 By Fuel Type
6.4.3.2.2 By Application
6.4.3.3 India Sustainability in the Maritime Market Estimates and Forecast, 2021-2029 (USD Million)
6.4.3.3.1 By Fuel Type
6.4.3.3.2 By Application
6.4.3.4 South Korea Sustainability in the Maritime Market Estimates and Forecast, 2021-2029 (USD Million)
6.4.3.4.1 By Fuel Type
6.4.3.4.2 By Application
6.4.3.5 Singapore Sustainability in the Maritime Market Estimates and Forecast, 2021-2029 (USD Million)
6.4.3.5.1 By Fuel Type
6.4.3.5.2 By Application
6.4.3.6 Malaysia Sustainability in the Maritime Market Estimates and Forecast, 2021-2029 (USD Million)
6.4.3.6.1 By Fuel Type
6.4.3.6.2 By Application
6.4.3.7 Thailand Sustainability in the Maritime Market Estimates and Forecast, 2021-2029 (USD Million)
6.4.3.6.1 By Fuel Type
6.4.3.6.2 By Application
6.4.3.8 Indonesia Sustainability in the Maritime Market Estimates and Forecast, 2021-2029 (USD Million)
6.4.3.7.1 By Fuel Type
6.4.3.7.2 By Application
6.4.3.9 Vietnam Sustainability in the Maritime Market Estimates and Forecast, 2021-2029 (USD Million)
6.4.3.8.1 By Fuel Type
6.4.3.8.2 By Application
6.4.3.10 Taiwan Sustainability in the Maritime Market Estimates and Forecast, 2021-2029 (USD Million)
6.4.3.10.1 By Fuel Type
6.4.3.10.2 By Application
6.4.3.11 Rest of Asia Pacific Sustainability in the Maritime Market Estimates and Forecast, 2021-2029 (USD Million)
6.4.3.11.1 By Fuel Type
6.4.3.11.2 By Application
6.5 Middle East and Africa Sustainability in the Maritime Market Estimates and Forecast, 2021-2029 (USD Million)
6.5.1 By Fuel Type
6.5.2 By Application
6.5.3 By Country
6.5.3.1 Saudi Arabia Sustainability in the Maritime Market Estimates and Forecast, 2021-2029 (USD Million)
6.5.3.1.1 By Fuel Type
6.5.3.1.2 By Application
6.5.3.2 U.A.E. Sustainability in the Maritime Market Estimates and Forecast, 2021-2029 (USD Million)
6.5.3.2.1 By Fuel Type
6.5.3.2.2 By Application
6.5.3.3 Israel Sustainability in the Maritime Market Estimates and Forecast, 2021-2029 (USD Million)
6.5.3.3.1 By Fuel Type
6.5.3.3.2 By Application
6.5.3.4 South Africa Sustainability in the Maritime Market Estimates and Forecast, 2021-2029 (USD Million)
6.5.3.4.1 By Fuel Type
6.5.3.4.2 By Application
6.5.3.5 Rest of Middle East and Africa Sustainability in the Maritime Market Estimates and Forecast, 2021-2029 (USD Million)
6.5.3.5.1 By Fuel Type
6.5.3.5.2 By Application
6.6 Central and South America Sustainability in the Maritime Market Estimates and Forecast, 2021-2029 (USD Million)
6.6.1 By Fuel Type
6.6.2 By Application
6.6.3 By Country
6.6.3.1 Brazil Sustainability in the Maritime Market Estimates and Forecast, 2021-2029 (USD Million)
6.6.3.1.1 By Fuel Type
6.6.3.1.2 By Application
6.6.3.2 Argentina Sustainability in the Maritime Market Estimates and Forecast, 2021-2029 (USD Million)
6.6.3.2.1 By Fuel Type
6.6.3.2.2 By Application
6.6.3.3 Chile Sustainability in the Maritime Market Estimates and Forecast, 2021-2029 (USD Million)
6.6.3.3.1 By Fuel Type
6.6.3.3.2 By Application
6.6.3.3 Rest of Central and South America Sustainability in the Maritime Market Estimates and Forecast, 2021-2029 (USD Million)
6.6.3.3.1 By Fuel Type
6.6.3.3.2 By Application
7 COMPETITIVE LANDCAPE
7.1 Company Market Share Analysis
7.2 Four Quadrant Positioning Matrix
7.2.1 Market Leaders
7.2.2 Market Visionaries
7.2.3 Market Challengers
7.2.4 Niche Market Players
7.3 Vendor Landscape
7.3.1 North America
7.3.2 Europe
7.3.3 Asia Pacific
7.3.4 Rest of the World
7.4 Company Profiles
7.4.1 Shell
7.4.1.1 Business Description & Financial Analysis
7.4.1.2 SWOT Analysis
7.4.1.3 Products & Services Offered
7.4.1.4 Strategic Alliances between Business Partners
7.4.2 Wartsilla
7.4.2.1 Business Description & Financial Analysis
7.4.2.2 SWOT Analysis
7.4.2.3 Products & Services Offered
7.4.2.4 Strategic Alliances between Business Partners
7.4.3 CMA CGM Group
7.4.3.1 Business Description & Financial Analysis
7.4.3.2 SWOT Analysis
7.4.3.3 Products & Services Offered
7.4.3.4 Strategic Alliances between Business Partners
7.4.4 Maersk
7.4.4.1 Business Description & Financial Analysis
7.4.4.2 SWOT Analysis
7.4.4.3 Products & Services Offered
7.4.4.4 Strategic Alliances between Business Partners
7.4.5 Neste Oyj
7.4.5.1 Business Description & Financial Analysis
7.4.5.2 SWOT Analysis
7.4.5.3 Products & Services Offered
7.4.5.4 Strategic Alliances between Business Partners
7.4.6 TARGRAY
7.4.6.1 Business Description & Financial Analysis
7.4.6.2 SWOT Analysis
7.4.6.3 Products & Services Offered
7.4.6.4 Strategic Alliances between Business Partners
7.4.7 ExxonMobil Corporation
7.4.7.1 Business Description & Financial Analysis
7.4.7.2 SWOT Analysis
7.4.7.3 Products & Services Offered
7.4.7.4 Strategic Alliances between Business Partners
7.4.8 GoodNRG B.V.
7.4.8.1 Business Description & Financial Analysis
7.4.8.2 SWOT Analysis
7.4.8.3 Products & Services Offered
7.4.8.4 Strategic Alliances between Business Partners
7.4.9 Chevron Corporation
7.4.9.1 Business Description & Financial Analysis
7.4.9.2 SWOT Analysis
7.4.9.3 Products & Services Offered
7.4.9.4 Strategic Alliances between Business Partners
7.4.10 Nordic Marine Oil A/S
7.4.10.1 Business Description & Financial Analysis
7.4.10.2 SWOT Analysis
7.4.10.3 Products & Services Offered
7.4.10.4 Strategic Alliances between Business Partners
7.4.11 TotalEnergies
7.4.11.1 Business Description & Financial Analysis
7.4.11.2 SWOT Analysis
7.4.11.3 Products & Services Offered
7.4.11.4 Strategic Alliances between Business Partners
7.4.12 GAC
7.4.12.1 Business Description & Financial Analysis
7.4.12.2 SWOT Analysis
7.4.12.3 Products & Services Offered
7.4.12.4 Strategic Alliances between Business Partners
7.4.13 Methanex Corporation
7.4.13.1 Business Description & Financial Analysis
7.4.13.2 SWOT Analysis
7.4.13.3 Products & Services Offered
7.4.13.4 Strategic Alliances between Business Partners
7.4.14 Other Companies
7.4.14.1 Business Description & Financial Analysis
7.4.14.2 SWOT Analysis
7.4.14.3 Products & Services Offered
7.4.14.4 Strategic Alliances between Business Partners
8 RESEARCH METHODOLOGY
8.1 Market Introduction
8.1.1 Market Definition
8.1.2 Market Scope & Segmentation
8.2 Information Procurement
8.2.1 Secondary Research
8.2.1.1 Purchased Databases
8.2.1.2 GMEs Internal Data Repository
8.2.1.3 Secondary Resources & Third Party Perspectives
8.2.1.4 Company Information Sources
8.2.2 Primary Research
8.2.2.1 Various Types of Respondents for Primary Interviews
8.2.2.2 Number of Interviews Conducted throughout the Research Process
8.2.2.3 Primary Stakeholders
8.2.2.4 Discussion Guide for Primary Participants
8.2.3 Expert Panels
8.2.3.1 Expert Panels Across 30+ Industry
8.2.4 Paid Local Experts
8.2.4.1 Paid Local Experts Across 30+ Industry Across each Region
8.3 Market Estimation
8.3.1 Top-Down Approach
8.3.1.1 Macro-Economic Indicators Considered
8.3.1.2 Micro-Economic Indicators Considered
8.3.2 Bottom Up Approach
8.3.2.1 Company Share Analysis Approach
8.3.2.2 Estimation of Potential Product Sales
8.4 Data Triangulation
8.4.1 Data Collection
8.4.2 Time Series, Cross Sectional & Panel Data Analysis
8.4.3 Cluster Analysis
8.5 Analysis and Output
8.5.1 Inhouse AI Based Real Time Analytics Tool
8.5.2 Output From Desk & Primary Research
8.6 Research Assumptions & Limitations
8.6.1 Research Assumptions
8.6.2 Research Limitations
LIST OF TABLES
1 Global Sustainability in the Maritime Market, By Fuel Type, 2021-2029 (USD Mllion)
2 Green Ammonia Market, By Region, 2021-2029 (USD Mllion)
3 Hydrogen Market, By Region, 2021-2029 (USD Mllion)
4 Biomethanol Market, By Region, 2021-2029 (USD Mllion)
5 Global Sustainability in the Maritime Market, By Application, 2021-2029 (USD Mllion)
6 Tankers/Carriers Market, By Region, 2021-2029 (USD Mllion)
7 Barges/Cargo Vessels Market, By Region, 2021-2029 (USD Mllion)
8 Tugboats Market, By Region, 2021-2029 (USD Mllion)
9 Defense Vessels Market, By Region, 2021-2029 (USD Mllion)
10 Ferries Market, By Region, 2021-2029 (USD Mllion)
11 Yachts Market, By Region, 2021-2029 (USD Mllion)
12 Cruise Ships Market, By Region, 2021-2029 (USD Mllion)
13 Regional Analysis, 2021-2029 (USD Mllion)
14 North America Sustainability in the Maritime Market, By Fuel Type, 2021-2029 (USD Mllion)
15 North America Sustainability in the Maritime Market, By Application, 2021-2029 (USD Mllion)
16 North America Sustainability in the Maritime Market, By COUNTRY, 2021-2029 (USD Mllion)
17 U.S. Sustainability in the Maritime Market, By Fuel Type, 2021-2029 (USD Mllion)
18 U.S. Sustainability in the Maritime Market, By Application, 2021-2029 (USD Mllion)
19 Canada Sustainability in the Maritime Market, By Fuel Type, 2021-2029 (USD Mllion)
20 Canada Sustainability in the Maritime Market, By Application, 2021-2029 (USD Mllion)
21 Mexico Sustainability in the Maritime Market, By Fuel Type, 2021-2029 (USD Mllion)
22 Mexico Sustainability in the Maritime Market, By Application, 2021-2029 (USD Mllion)
23 Europe Sustainability in the Maritime Market, By Fuel Type, 2021-2029 (USD Mllion)
24 Europe Sustainability in the Maritime Market, By Application, 2021-2029 (USD Mllion)
25 EUROPE Sustainability in the Maritime Market, By COUNTRY, 2021-2029 (USD Mllion)
26 Germany Sustainability in the Maritime Market, By Fuel Type, 2021-2029 (USD Mllion)
27 Germany Sustainability in the Maritime Market, By Application, 2021-2029 (USD Mllion)
28 U.K. Sustainability in the Maritime Market, By Fuel Type, 2021-2029 (USD Mllion)
29 U.K. Sustainability in the Maritime Market, By Application, 2021-2029 (USD Mllion)
30 France Sustainability in the Maritime Market, By Fuel Type, 2021-2029 (USD Mllion)
31 France Sustainability in the Maritime Market, By Application, 2021-2029 (USD Mllion)
32 Italy Sustainability in the Maritime Market, By Fuel Type, 2021-2029 (USD Mllion)
33 Italy Sustainability in the Maritime Market, By Application, 2021-2029 (USD Mllion)
34 Spain Sustainability in the Maritime Market, By Fuel Type, 2021-2029 (USD Mllion)
35 Spain Sustainability in the Maritime Market, By Application, 2021-2029 (USD Mllion)
36 Netherlands Sustainability in the Maritime Market, By Fuel Type, 2021-2029 (USD Mllion)
37 Netherlands Sustainability in the Maritime Market, By Application, 2021-2029 (USD Mllion)
38 Rest Of Europe Sustainability in the Maritime Market, By Fuel Type, 2021-2029 (USD Mllion)
39 Rest Of Europe Sustainability in the Maritime Market, By Application, 2021-2029 (USD Mllion)
40 Asia Pacific Sustainability in the Maritime Market, By Fuel Type, 2021-2029 (USD Mllion)
41 Asia Pacific Sustainability in the Maritime Market, By Application, 2021-2029 (USD Mllion)
42 ASIA PACIFIC Sustainability in the Maritime Market, By COUNTRY, 2021-2029 (USD Mllion)
43 China Sustainability in the Maritime Market, By Fuel Type, 2021-2029 (USD Mllion)
44 China Sustainability in the Maritime Market, By Application, 2021-2029 (USD Mllion)
45 Japan Sustainability in the Maritime Market, By Fuel Type, 2021-2029 (USD Mllion)
46 Japan Sustainability in the Maritime Market, By Application, 2021-2029 (USD Mllion)
47 India Sustainability in the Maritime Market, By Fuel Type, 2021-2029 (USD Mllion)
48 India Sustainability in the Maritime Market, By Application, 2021-2029 (USD Mllion)
49 South Korea Sustainability in the Maritime Market, By Fuel Type, 2021-2029 (USD Mllion)
50 South Korea Sustainability in the Maritime Market, By Application, 2021-2029 (USD Mllion)
51 Singapore Sustainability in the Maritime Market, By Fuel Type, 2021-2029 (USD Mllion)
52 Singapore Sustainability in the Maritime Market, By Application, 2021-2029 (USD Mllion)
53 Thailand Sustainability in the Maritime Market, By Fuel Type, 2021-2029 (USD Mllion)
54 Thailand Sustainability in the Maritime Market, By Application, 2021-2029 (USD Mllion)
55 Malaysia Sustainability in the Maritime Market, By Fuel Type, 2021-2029 (USD Mllion)
56 Malaysia Sustainability in the Maritime Market, By Application, 2021-2029 (USD Mllion)
57 Indonesia Sustainability in the Maritime Market, By Fuel Type, 2021-2029 (USD Mllion)
58 Indonesia Sustainability in the Maritime Market, By Application, 2021-2029 (USD Mllion)
59 Vietnam Sustainability in the Maritime Market, By Fuel Type, 2021-2029 (USD Mllion)
60 Vietnam Sustainability in the Maritime Market, By Application, 2021-2029 (USD Mllion)
61 Taiwan Sustainability in the Maritime Market, By Fuel Type, 2021-2029 (USD Mllion)
62 Taiwan Sustainability in the Maritime Market, By Application, 2021-2029 (USD Mllion)
63 Rest of APAC Sustainability in the Maritime Market, By Fuel Type, 2021-2029 (USD Mllion)
64 Rest of APAC Sustainability in the Maritime Market, By Application, 2021-2029 (USD Mllion)
65 Middle East and Africa Sustainability in the Maritime Market, By Fuel Type, 2021-2029 (USD Mllion)
66 Middle East and Africa Sustainability in the Maritime Market, By Application, 2021-2029 (USD Mllion)
67 MIDDLE EAST & ADRICA Sustainability in the Maritime Market, By COUNTRY, 2021-2029 (USD Mllion)
68 Saudi Arabia Sustainability in the Maritime Market, By Fuel Type, 2021-2029 (USD Mllion)
69 Saudi Arabia Sustainability in the Maritime Market, By Application, 2021-2029 (USD Mllion)
70 UAE Sustainability in the Maritime Market, By Fuel Type, 2021-2029 (USD Mllion)
71 UAE Sustainability in the Maritime Market, By Application, 2021-2029 (USD Mllion)
72 Israel Sustainability in the Maritime Market, By Fuel Type, 2021-2029 (USD Mllion)
73 Israel Sustainability in the Maritime Market, By Application, 2021-2029 (USD Mllion)
74 South Africa Sustainability in the Maritime Market, By Fuel Type, 2021-2029 (USD Mllion)
75 South Africa Sustainability in the Maritime Market, By Application, 2021-2029 (USD Mllion)
76 Rest Of Middle East and Africa Sustainability in the Maritime Market, By Fuel Type, 2021-2029 (USD Mllion)
77 Rest Of Middle East and Africa Sustainability in the Maritime Market, By Application, 2021-2029 (USD Mllion)
78 Central and South America Sustainability in the Maritime Market, By Fuel Type, 2021-2029 (USD Mllion)
79 Central and South America Sustainability in the Maritime Market, By Application, 2021-2029 (USD Mllion)
80 CENTRAL AND SOUTH AMERICA Sustainability in the Maritime Market, By COUNTRY, 2021-2029 (USD Mllion)
81 Brazil Sustainability in the Maritime Market, By Fuel Type, 2021-2029 (USD Mllion)
82 Brazil Sustainability in the Maritime Market, By Application, 2021-2029 (USD Mllion)
83 Chile Sustainability in the Maritime Market, By Fuel Type, 2021-2029 (USD Mllion)
84 Chile Sustainability in the Maritime Market, By Application, 2021-2029 (USD Mllion)
85 Argentina Sustainability in the Maritime Market, By Fuel Type, 2021-2029 (USD Mllion)
86 Argentina Sustainability in the Maritime Market, By Application, 2021-2029 (USD Mllion)
87 Rest Of Central and South America Sustainability in the Maritime Market, By Fuel Type, 2021-2029 (USD Mllion)
88 Rest Of Central and South America Sustainability in the Maritime Market, By Application, 2021-2029 (USD Mllion)
89 Shell: Products & Services Offering
90 Wartsilla: Products & Services Offering
91 CMA CGM Group: Products & Services Offering
92 Maersk: Products & Services Offering
93 Neste Oyj: Products & Services Offering
94 TARGRAY: Products & Services Offering
95 ExxonMobil Corporation: Products & Services Offering
96 GoodNRG B.V.: Products & Services Offering
97 Chevron Corporation, Inc: Products & Services Offering
98 Nordic Marine Oil A/S: Products & Services Offering
99 TotalEnergies: Products & Services Offering
100 GAC: Products & Services Offering
101 Methanex Corporation: Products & Services Offering
102 Other Companies: Products & Services Offering
LIST OF FIGURES
1 Global Sustainability in the Maritime Market Overview
2 Global Sustainability in the Maritime Market Value From 2021-2029 (USD Mllion)
3 Global Sustainability in the Maritime Market Share, By Fuel Type (2023)
4 Global Sustainability in the Maritime Market Share, By Application (2023)
5 Global Sustainability in the Maritime Market, By Region (Asia Pacific Market)
6 Technological Trends In Global Sustainability in the Maritime Market
7 Four Quadrant Competitor Positioning Matrix
8 Impact Of Macro & Micro Indicators On The Market
9 Impact Of Key Drivers On The Global Sustainability in the Maritime Market
10 Impact Of Challenges On The Global Sustainability in the Maritime Market
11 Porter’s Five Forces Analysis
12 Global Sustainability in the Maritime Market: By Fuel Type Scope Key Takeaways
13 Global Sustainability in the Maritime Market, By Fuel Type Segment: Revenue Growth Analysis
14 Green Ammonia Market, By Region, 2021-2029 (USD Mllion)
15 Hydrogen Market, By Region, 2021-2029 (USD Mllion)
16 Biomethanol Market, By Region, 2021-2029 (USD Mllion)
17 Global Sustainability in the Maritime Market: By Application Scope Key Takeaways
18 Global Sustainability in the Maritime Market, By Application Segment: Revenue Growth Analysis
19 Tankers/Carriers Market, By Region, 2021-2029 (USD Mllion)
20 Barges/Cargo Vessels Market, By Region, 2021-2029 (USD Mllion)
21 Tugboats Market, By Region, 2021-2029 (USD Mllion)
22 Defense Vessels Market, By Region, 2021-2029 (USD Mllion)
23 Ferries Market, By Region, 2021-2029 (USD Mllion)
24 Yachts Market, By Region, 2021-2029 (USD Mllion)
25 Cruise Ships Market, By Region, 2021-2029 (USD Mllion)
26 Regional Segment: Revenue Growth Analysis
27 Global Sustainability in the Maritime Market: Regional Analysis
28 North America Sustainability in the Maritime Market Overview
29 North America Sustainability in the Maritime Market, By Fuel Type
30 North America Sustainability in the Maritime Market, By Application
31 North America Sustainability in the Maritime Market, By Country
32 U.S. Sustainability in the Maritime Market, By Fuel Type
33 U.S. Sustainability in the Maritime Market, By Application
34 Canada Sustainability in the Maritime Market, By Fuel Type
35 Canada Sustainability in the Maritime Market, By Application
36 Mexico Sustainability in the Maritime Market, By Fuel Type
37 Mexico Sustainability in the Maritime Market, By Application
38 Four Quadrant Positioning Matrix
39 Company Market Share Analysis
40 Shell: Company Snapshot
41 Shell: SWOT Analysis
42 Shell: Geographic Presence
43 Wartsilla: Company Snapshot
44 Wartsilla: SWOT Analysis
45 Wartsilla: Geographic Presence
46 CMA CGM Group: Company Snapshot
47 CMA CGM Group: SWOT Analysis
48 CMA CGM Group: Geographic Presence
49 Maersk: Company Snapshot
50 Maersk: Swot Analysis
51 Maersk: Geographic Presence
52 Neste Oyj: Company Snapshot
53 Neste Oyj: SWOT Analysis
54 Neste Oyj: Geographic Presence
55 TARGRAY: Company Snapshot
56 TARGRAY: SWOT Analysis
57 TARGRAY: Geographic Presence
58 ExxonMobil Corporation: Company Snapshot
59 ExxonMobil Corporation: SWOT Analysis
60 ExxonMobil Corporation: Geographic Presence
61 GoodNRG B.V.: Company Snapshot
62 GoodNRG B.V.: SWOT Analysis
63 GoodNRG B.V.: Geographic Presence
64 Chevron Corporation, Inc.: Company Snapshot
65 Chevron Corporation, Inc.: SWOT Analysis
66 Chevron Corporation, Inc.: Geographic Presence
67 Nordic Marine Oil A/S: Company Snapshot
68 Nordic Marine Oil A/S: SWOT Analysis
69 Nordic Marine Oil A/S: Geographic Presence
70 TotalEnergies: Company Snapshot
71 TotalEnergies: SWOT Analysis
72 TotalEnergies: Geographic Presence
73 GAC: Company Snapshot
74 GAC: SWOT Analysis
75 GAC: Geographic Presence
76 Methanex Corporation: Company Snapshot
77 Methanex Corporation: SWOT Analysis
78 Methanex Corporation: Geographic Presence
79 Other Companies: Company Snapshot
80 Other Companies: SWOT Analysis
81 Other Companies: Geographic Presence
The Sustainability in the Maritime Market has been studied from the year 2019 till 2029. However, the CAGR provided in the report is from the year 2024 to 2029. The research methodology involved three stages: Desk research, Primary research, and Analysis & Output from the entire research process.

The desk research involved a robust background study which meant referring to paid and unpaid databases to understand the market dynamics; mapping contracts from press releases; identifying the key players in the market, studying their product portfolio, competition level, annual reports/SEC filings & investor presentations; and learning the demand and supply-side analysis for the Sustainability in the Maritime Market.

The primary research activity included telephonic conversations with more than 50 tier 1 industry consultants, distributors, and end-use product manufacturers.

Finally, based on the above thorough research process, an in-depth analysis was carried out considering the following aspects: market attractiveness, current & future market trends, market share analysis, SWOT analysis of the company and customer analytics.

Frequently Asked Questions

This FREE sample includes market data points, ranging from trend analyses to market estimates & forecasts. See for yourself.
Or view our licence options:
Tailor made solutions just for you
80% of our clients seek made-to-order reports. How do you want us to tailor yours?
OUR CLIENTS


