This report was recently updated on August 27 2025 with the latest and most recent
market numbers
Global Sustainable and Efficient Infrastructure Market Size, Trends & Analysis - Forecasts to 2029 By Type of Infrastructure (Renewable Energy Infrastructure, Green Buildings, Sustainable Transportation, and Water and Wastewater Management), By Application (Residential Buildings, Commercial & Industrial Buildings, Transportation, and Utilities), and By Region (North America, Asia Pacific, Central & South America, Europe, and Middle East and Africa), Competitive Landscape, Company Market Share Analysis, and End User Analysis
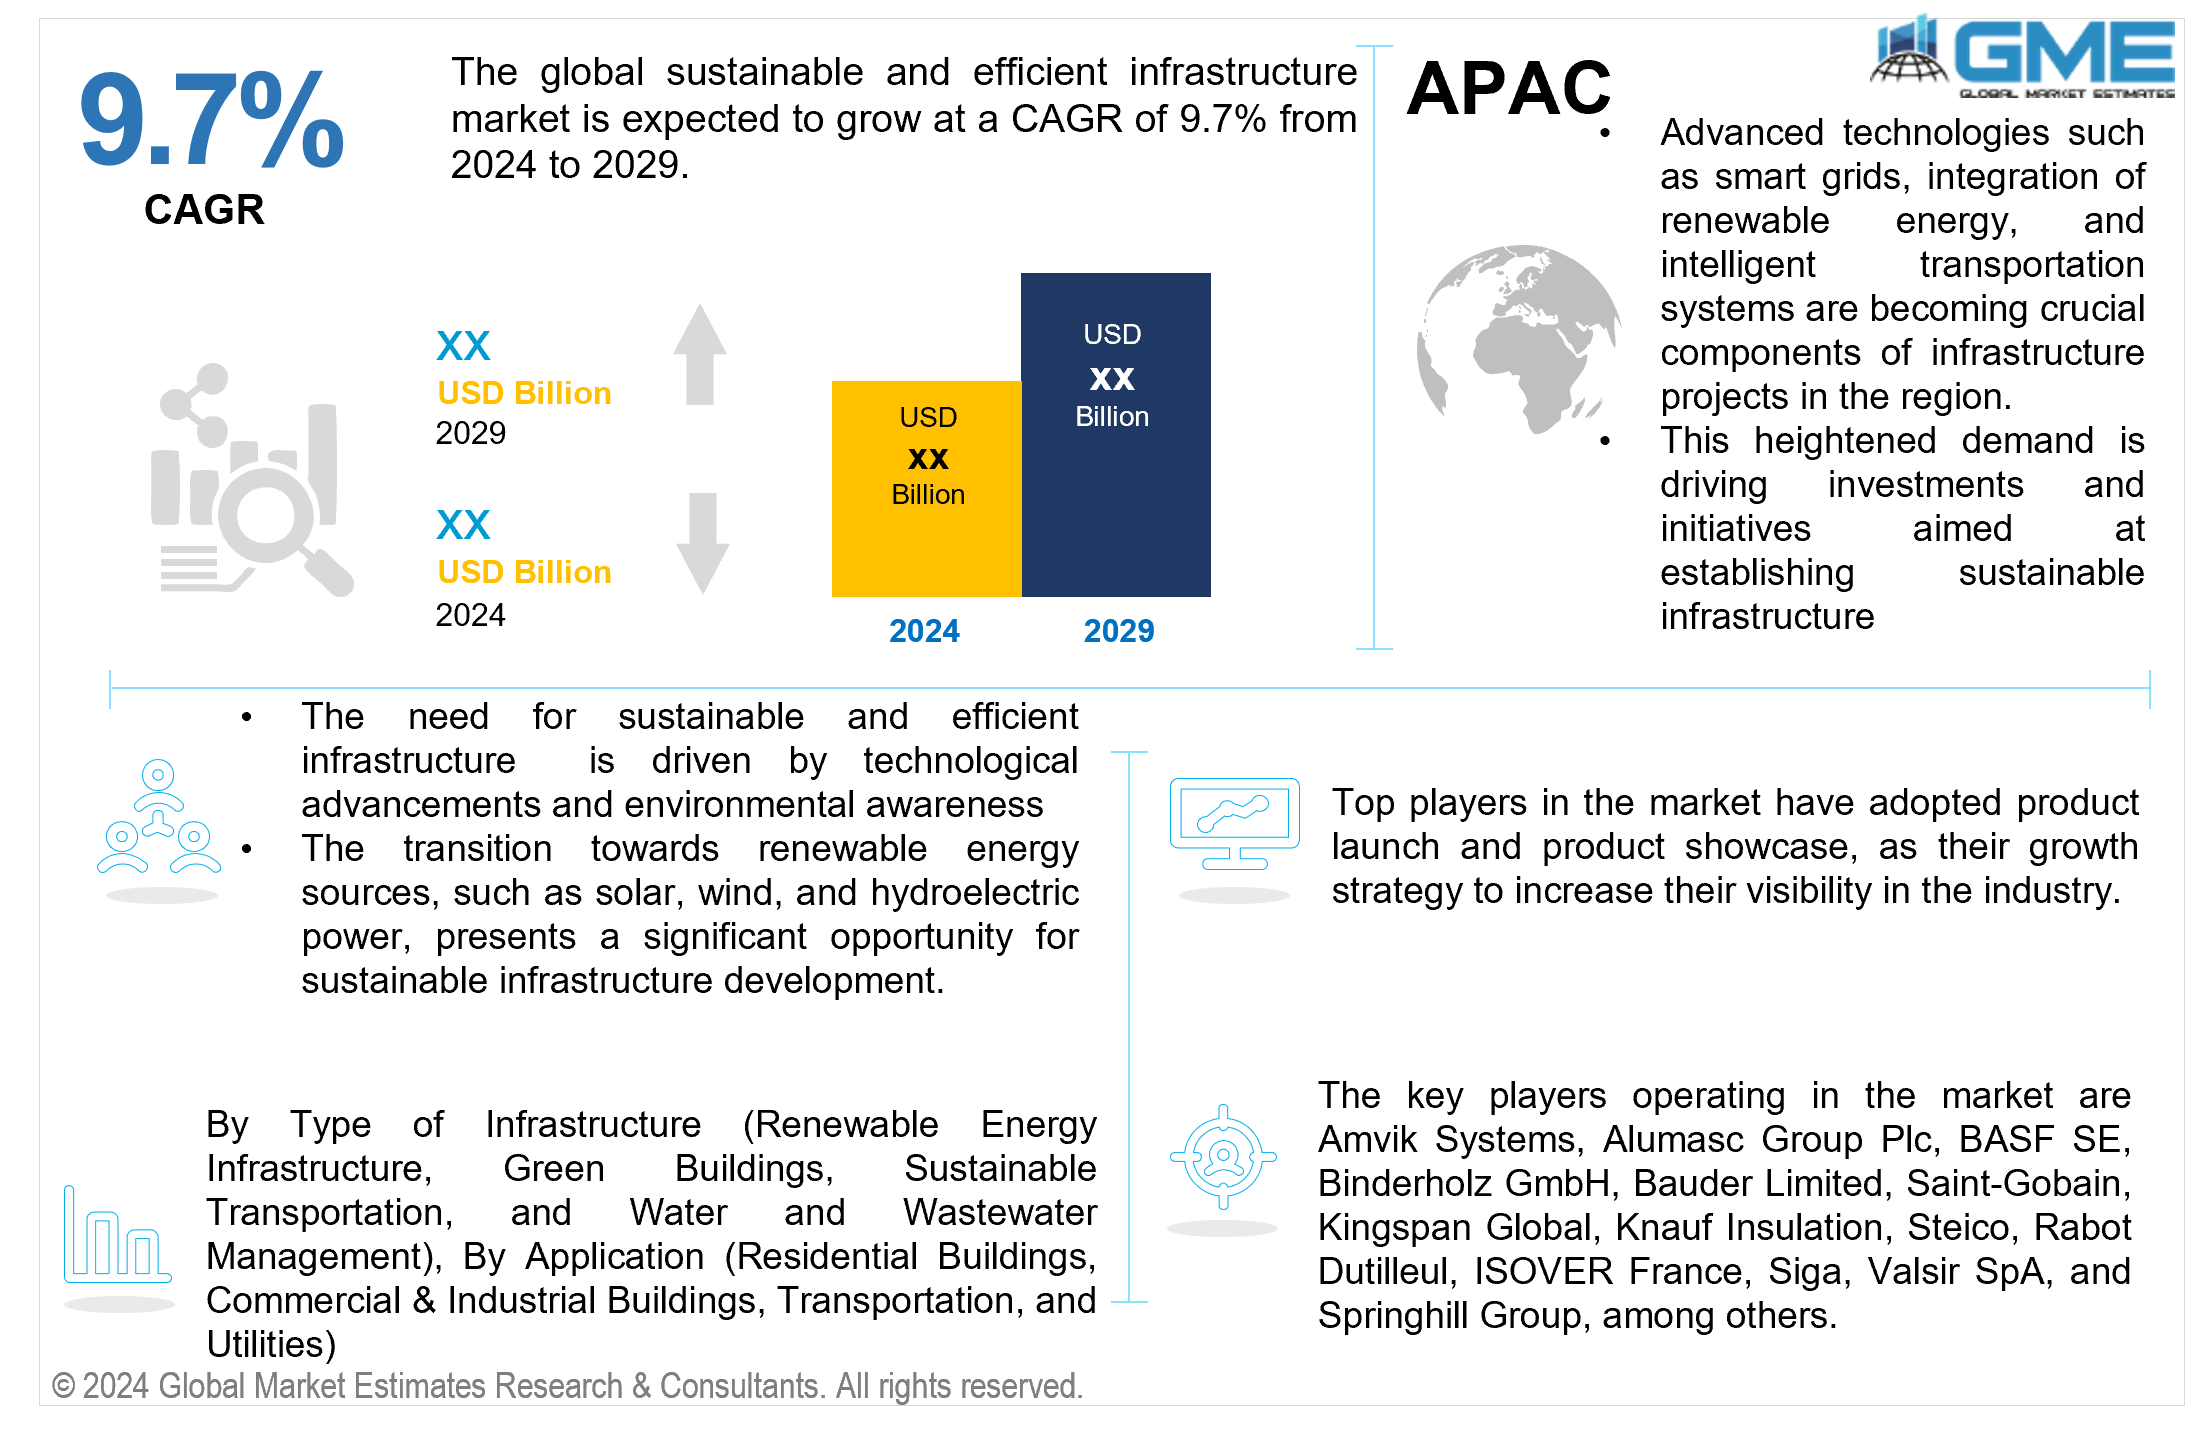
The global sustainable and efficient infrastructure market is expected to grow at a CAGR of 9.7% from 2024 to 2029. Sustainable and efficient infrastructure is necessary for project planning and is commissioned in a manner that ensures economic, social, and environmental sustainability.
The market is driven by technological advancements and environmental awareness. Concerns regarding climate change and environmental decline are prompting governments and organizations to prioritize the development of sustainable infrastructure. Regulations and policies targeting carbon emission reduction, promoting renewable energy, and enhancing energy efficiency are spurring investments in sustainable infrastructure projects globally. Technological advancements, like smart sensors, the Internet of Things (IoT), and data analytics, are facilitating the creation of more effective and sustainable infrastructure solutions. These technologies allow for real-time monitoring, optimization of resource usage, and predictive maintenance, resulting in enhanced operational efficiency and minimized environmental impact. The shift towards renewable energy sources such as solar, wind, and hydroelectric power offers a significant opportunity for sustainable infrastructure development.
One of the major restraints against the market is the high initial costs. High initial costs of raw materials often deter investors and companies from making the initial investment, thereby preventing developers from pursuing sustainable infrastructure projects. The International Monetary Fund (IMF) projects that meeting the Sustainable Development Goals (SDGs) by 2030 would necessitate an investment of approximately USD 2.6 trillion in sustainable infrastructure. This accounts for about 2.5% of the projected global GDP for 2030 and targets 121 emerging-market economies and low-income developing nations.
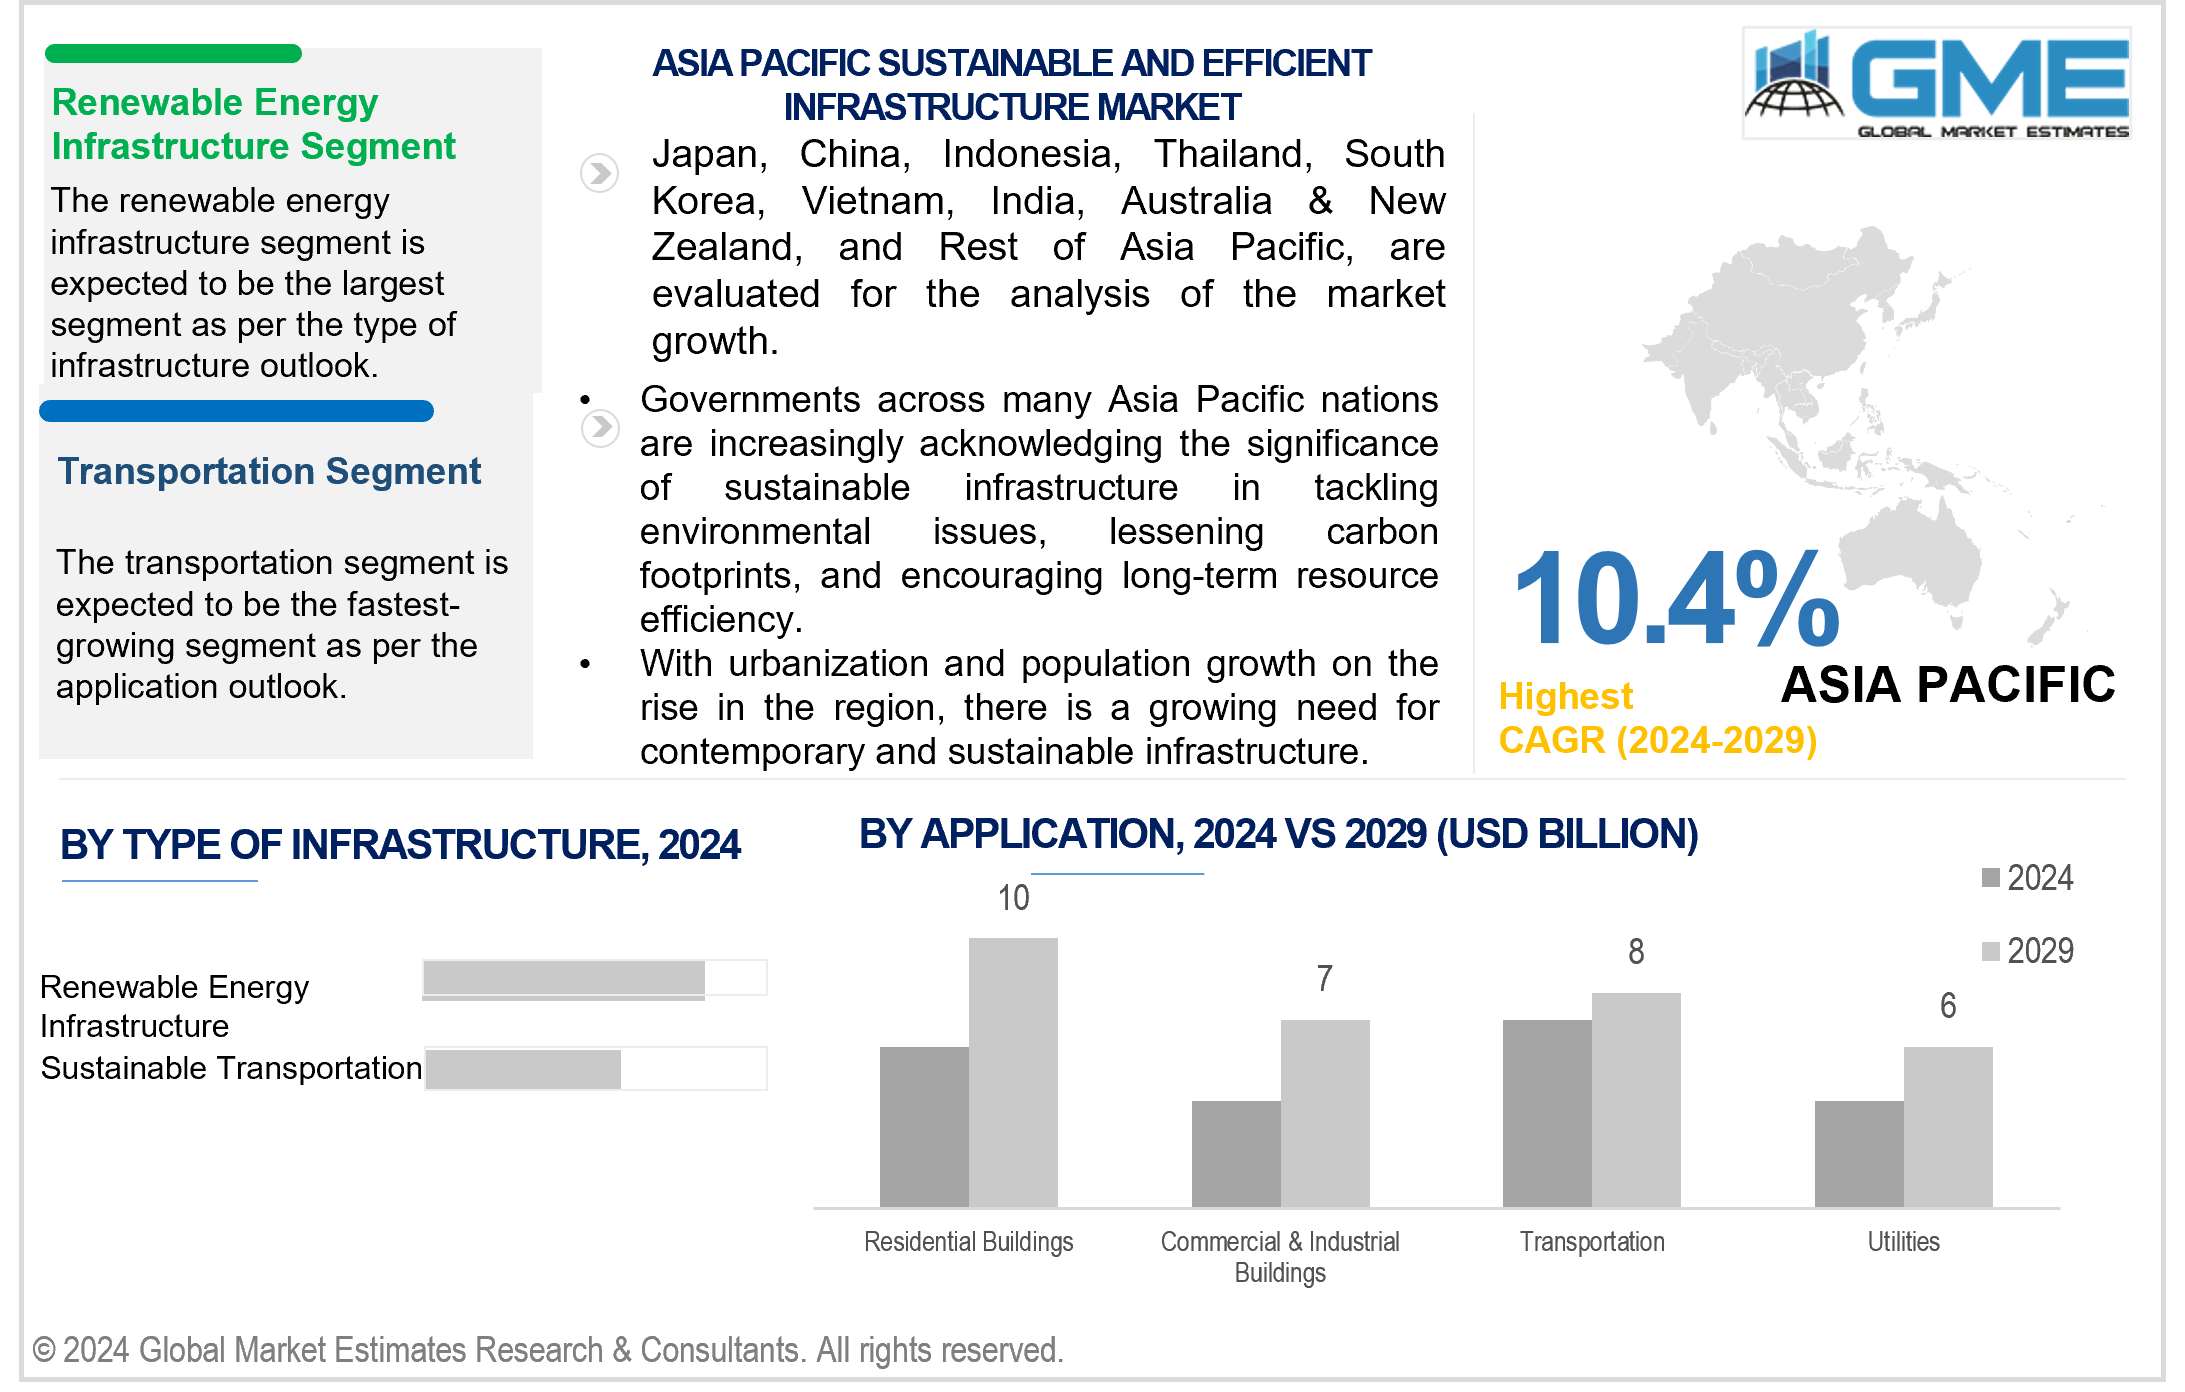
Based on type of infrastructure, the market is segmented into renewable energy infrastructure, green buildings, sustainable transportation, and water and wastewater management. The renewable energy infrastructure segment is expected to hold the largest share of the market during the forecast period. Renewable energy forms such as wind, solar, hydro, tidal, and geothermal are actively tapped by economies worldwide. They cater to the region's geographical conditions, making them inherently sustainable in nature.
The sustainable transportation segment is projected to grow fastest during the forecast period. The transition towards sustainable transportation solutions, including electric vehicles, public transit systems, and infrastructure for walking and cycling, is gaining momentum worldwide as governments and organizations prioritize efforts to reduce carbon emissions and improve air quality. This trend is driven by increasing urbanization, concerns about air pollution, and advancements in electric vehicle technology.
Based on application, the market is segmented into residential buildings, commercial & industrial buildings, transportation, and utilities. The utilities segment is expected to hold the largest share of the market during the forecast period. This segment encompasses infrastructure projects related to water supply, wastewater treatment, energy generation and distribution, and telecommunications networks, which are essential for supporting urbanization and economic development.
The transportation segment is projected to grow fastest during the forecast period. The transportation sector is undergoing massive growth. This can be attributed to the rapid pace of urbanization and population growth. This is responsible for driving the demand for efficient mobility solutions. Sustainable transportation infrastructure projects, such as public transit systems, electric vehicle charging stations, and bike-sharing programs, are gaining momentum as cities seek to reduce traffic congestion, air pollution, and carbon emissions. As per the UN Habitat, urban areas utilize 78% of global energy and generate over 60% of greenhouse gas emissions. Infrastructure development and utilization, including power plants, structures, and transportation, significantly contribute to this statistic. Moreover, approximately 90% of cities are located near coastlines, rendering them particularly vulnerable to the anticipated increase in sea levels.
North America is analyzed to be the largest region in the global sustainable and efficient infrastructure market during the forecast period. In North America, governments, businesses, and organizations are increasingly investing in sustainable infrastructure projects to address environmental challenges, meet regulatory requirements, and achieve long-term economic and social benefits.
Asia Pacific is analyzed to be the fastest-growing region in the global sustainable and efficient infrastructure market during the forecast period. Governments across many Asia Pacific nations are increasingly acknowledging the significance of sustainable infrastructure in tackling environmental issues, lessening carbon footprints, and encouraging long-term resource efficiency. With urbanization and population growth in the region, there is a growing need for contemporary and sustainable infrastructure in various sectors like transportation, energy, utilities, and commercial constructions. Advanced technologies such as smart grids, the integration of renewable energy, and intelligent transportation systems are becoming crucial components of infrastructure projects in the area. This heightened demand is driving investments and initiatives aimed at establishing infrastructure systems that are more resilient and environmentally friendly.
Amvik Systems, Alumasc Group Plc, BASF SE, Binderholz GmbH, Bauder Limited, E. I. du Pont de Nemours and Company, Interface Inc., Forbo International SA, Owens Corning, LafargeHolcim, Cemex, Saint-Gobain, Kingspan Global, Knauf Insulation, Steico, Rabot Dutilleul, ISOVER France, Siga, Valsir SpA, and Springhill Group, among others, are some of the key players operating in the global market.
Please note: This is not an exhaustive list of companies profiled in the report.
In January 2024, BASF SE announced a new collaboration with Envision Energy, a leading green technology provider of comprehensive net zero solutions. The collaboration aims to further develop the conversion of green hydrogen and CO2 into e-methanol through an advanced, dynamic process design.
1 STRATEGIC INSIGHTS ON NEW REVENUE POCKETS
1.1 Strategic Opportunity & Attractiveness Analysis
1.1.1 Hot Revenue Pockets
1.1.2 Market Attractiveness Score
1.1.3 Revenue Impacting Opportunity
1.1.4 High Growing Region/Country
1.1.5 Competitor Analysis
1.1.6 Consumer Analysis
1.2 Global Market Estimates' View
1.3 Strategic Insights across Business Functions
1.3.1 For Chief Executive Officers
1.3.2 For Chief Marketing Officers
1.3.3 For Chief Strategy Officers
1.4 Evaluate the Potential of your Existing Business Lines vs. New Lines to Enter Into
2 TECHNOLOGICAL TRENDS
2.1 Technological Adoption Rate
2.2 Current Trend Impact Analysis
2.3 Future Trend Impact Analysis
3 GLOBAL MARKET OUTLOOK
3.1 Market Pyramid Analysis
3.1.1 Introduction
3.1.2 Adjacent Market Opportunities
3.1.3 Ancillary Market Opportunities
3.2 Demand Side Analysis
3.2.1 Market Drivers: Impact Analysis
3.2.2 Market Restraints: Impact Analysis
3.2.3 Market Opportunities: Impact Analysis
3.2.4 Market Challenges: Impact Analysis
3.3 Supply Side Analysis
3.3.1 Porter’s Five Forces Analysis
3.3.1.1 Threat of New Entrants
3.3.1.2 Threat of New Substitutes
3.3.1.3 Bargaining Power of Suppliers
3.3.1.4 Bargaining Power of Buyers
3.3.1.5 Intensity of Competitive Rivalry
3.3.2 SWOT Analysis; By Factor (Political & Legal, Economic, and Technological)
3.3.2.1 Political Landscape
3.3.2.2 Economic Landscape
3.3.2.3 Social Landscape
3.3.2.4 Technology Landscape
3.3.3 Value Chain Analysis
3.3.4 Trend Analysis
3.3.5 Gap Analysis
3.3.6 Cost Analysis
4 GLOBAL SUSTAINABLE AND EFFICIENT INFRASTRUCTURE MARKET, BY TYPE OF INFRASTRUCTURE
4.1 Introduction
4.2 Sustainable and Efficient Infrastructure Market: Material Scope Key Takeaways
4.3 Revenue Growth Analysis, 2023 & 2029
4.4 Renewable Energy Infrastructure
4.4.1 Renewable Energy Infrastructure Market Estimates and Forecast, 2021-2029 (USD Million)
4.5 Green Buildings
4.5.1 Green Buildings Market Estimates and Forecast, 2021-2029 (USD Million)
4.6 Sustainable Transportation
4.6.1 Sustainable Transportation Market Estimates and Forecast, 2021-2029 (USD Million)
4.7 Water and Wastewater Management
4.7.1 Water and Wastewater Management Market Estimates and Forecast, 2021-2029 (USD Million)
5 GLOBAL SUSTAINABLE AND EFFICIENT INFRASTRUCTURE MARKET, BY APPLICATION
5.1 Introduction
5.2 Sustainable and Efficient Infrastructure Market: End Use Scope Key Takeaways
5.3 Revenue Growth Analysis, 2023 & 2029
5.4 Residential Buildings
5.4.1 Residential Buildings Market Estimates and Forecast, 2021-2029 (USD Million)
5.5 Commercial & Industrial Buildings
5.5.1 Commercial & Industrial Buildings Market Estimates and Forecast, 2021-2029 (USD Million)
5.6 Transportation
5.6.1 Transportation Market Estimates and Forecast, 2021-2029 (USD Million)
5.7 Utilities
5.7.1 Utilities Market Estimates and Forecast, 2021-2029 (USD Million)
6 GLOBAL SUSTAINABLE AND EFFICIENT INFRASTRUCTURE MARKET, BY REGION
6.1 Introduction
6.2 North America Sustainable and Efficient Infrastructure Market Estimates and Forecast, 2021-2029 (USD Million)
6.2.1 By Type of Infrastructure
6.2.2 By Application
6.2.3 By Country
6.2.3.1 U.S. Sustainable and Efficient Infrastructure Market Estimates and Forecast, 2021-2029 (USD Million)
6.2.3.1.1 By Type of Infrastructure
6.2.3.1.2 By Application
6.2.3.2 Canada Sustainable and Efficient Infrastructure Market Estimates and Forecast, 2021-2029 (USD Million)
6.2.3.2.1 By Type of Infrastructure
6.2.3.2.2 By Application
6.2.3.3 Mexico Sustainable and Efficient Infrastructure Market Estimates and Forecast, 2021-2029 (USD Million)
6.2.3.3.1 By Type of Infrastructure
6.2.3.3.2 By Application
6.3 Europe Sustainable and Efficient Infrastructure Market Estimates and Forecast, 2021-2029 (USD Million)
6.3.1 By Type of Infrastructure
6.3.2 By Application
6.3.3 By Country
6.3.3.1 Germany Sustainable and Efficient Infrastructure Market Estimates and Forecast, 2021-2029 (USD Million)
6.3.3.1.1 By Type of Infrastructure
6.3.3.1.2 By Application
6.3.3.2 U.K. Sustainable and Efficient Infrastructure Market Estimates and Forecast, 2021-2029 (USD Million)
6.3.3.2.1 By Type of Infrastructure
6.3.3.2.2 By Application
6.3.3.3 France Sustainable and Efficient Infrastructure Market Estimates and Forecast, 2021-2029 (USD Million)
6.3.3.3.1 By Type of Infrastructure
6.3.3.3.2 By Application
6.3.3.4 Italy Sustainable and Efficient Infrastructure Market Estimates and Forecast, 2021-2029 (USD Million)
6.3.3.4.1 By Type of Infrastructure
6.3.3.4.2 By Application
6.3.3.5 Spain Sustainable and Efficient Infrastructure Market Estimates and Forecast, 2021-2029 (USD Million)
6.3.3.5.1 By Type of Infrastructure
6.3.3.5.2 By Application
6.3.3.6 Netherlands Sustainable and Efficient Infrastructure Market Estimates and Forecast, 2021-2029 (USD Million)
6.3.3.6.1 By Type of Infrastructure
6.3.3.6.2 By Application
6.3.3.7 Rest of Europe Sustainable and Efficient Infrastructure Market Estimates and Forecast, 2021-2029 (USD Million)
6.3.3.6.1 By Type of Infrastructure
6.3.3.6.2 By Application
6.4 Asia Pacific Sustainable and Efficient Infrastructure Market Estimates and Forecast, 2021-2029 (USD Million)
6.4.1 By Type of Infrastructure
6.4.2 By Application
6.4.3 By Country
6.4.3.1 China Sustainable and Efficient Infrastructure Market Estimates and Forecast, 2021-2029 (USD Million)
6.4.3.1.1 By Type of Infrastructure
6.4.3.1.2 By Application
6.4.3.2 Japan Sustainable and Efficient Infrastructure Market Estimates and Forecast, 2021-2029 (USD Million)
6.4.3.2.1 By Type of Infrastructure
6.4.3.2.2 By Application
6.4.3.3 India Sustainable and Efficient Infrastructure Market Estimates and Forecast, 2021-2029 (USD Million)
6.4.3.3.1 By Type of Infrastructure
6.4.3.3.2 By Application
6.4.3.4 South Korea Sustainable and Efficient Infrastructure Market Estimates and Forecast, 2021-2029 (USD Million)
6.4.3.4.1 By Type of Infrastructure
6.4.3.4.2 By Application
6.4.3.5 Singapore Sustainable and Efficient Infrastructure Market Estimates and Forecast, 2021-2029 (USD Million)
6.4.3.5.1 By Type of Infrastructure
6.4.3.5.2 By Application
6.4.3.6 Malaysia Sustainable and Efficient Infrastructure Market Estimates and Forecast, 2021-2029 (USD Million)
6.4.3.6.1 By Type of Infrastructure
6.4.3.6.2 By Application
6.4.3.7 Thailand Sustainable and Efficient Infrastructure Market Estimates and Forecast, 2021-2029 (USD Million)
6.4.3.6.1 By Type of Infrastructure
6.4.3.6.2 By Application
6.4.3.8 Indonesia Sustainable and Efficient Infrastructure Market Estimates and Forecast, 2021-2029 (USD Million)
6.4.3.7.1 By Type of Infrastructure
6.4.3.7.2 By Application
6.4.3.9 Vietnam Sustainable and Efficient Infrastructure Market Estimates and Forecast, 2021-2029 (USD Million)
6.4.3.8.1 By Type of Infrastructure
6.4.3.8.2 By Application
6.4.3.10 Taiwan Sustainable and Efficient Infrastructure Market Estimates and Forecast, 2021-2029 (USD Million)
6.4.3.10.1 By Type of Infrastructure
6.4.3.10.2 By Application
6.4.3.11 Rest of Asia Pacific Sustainable and Efficient Infrastructure Market Estimates and Forecast, 2021-2029 (USD Million)
6.4.3.11.1 By Type of Infrastructure
6.4.3.11.2 By Application
6.5 Middle East and Africa Sustainable and Efficient Infrastructure Market Estimates and Forecast, 2021-2029 (USD Million)
6.5.1 By Type of Infrastructure
6.5.2 By Application
6.5.3 By Country
6.5.3.1 Saudi Arabia Sustainable and Efficient Infrastructure Market Estimates and Forecast, 2021-2029 (USD Million)
6.5.3.1.1 By Type of Infrastructure
6.5.3.1.2 By Application
6.5.3.2 U.A.E. Sustainable and Efficient Infrastructure Market Estimates and Forecast, 2021-2029 (USD Million)
6.5.3.2.1 By Type of Infrastructure
6.5.3.2.2 By Application
6.5.3.3 Israel Sustainable and Efficient Infrastructure Market Estimates and Forecast, 2021-2029 (USD Million)
6.5.3.3.1 By Type of Infrastructure
6.5.3.3.2 By Application
6.5.3.4 South Africa Sustainable and Efficient Infrastructure Market Estimates and Forecast, 2021-2029 (USD Million)
6.5.3.4.1 By Type of Infrastructure
6.5.3.4.2 By Application
6.5.3.5 Rest of Middle East and Africa Sustainable and Efficient Infrastructure Market Estimates and Forecast, 2021-2029 (USD Million)
6.5.3.5.1 By Type of Infrastructure
6.5.3.5.2 By Application
6.6 Central & South America Sustainable and Efficient Infrastructure Market Estimates and Forecast, 2021-2029 (USD Million)
6.6.1 By Type of Infrastructure
6.6.2 By Application
6.6.3 By Country
6.6.3.1 Brazil Sustainable and Efficient Infrastructure Market Estimates and Forecast, 2021-2029 (USD Million)
6.6.3.1.1 By Type of Infrastructure
6.6.3.1.2 By Application
6.6.3.2 Argentina Sustainable and Efficient Infrastructure Market Estimates and Forecast, 2021-2029 (USD Million)
6.6.3.2.1 By Type of Infrastructure
6.6.3.2.2 By Application
6.6.3.3 Chile Sustainable and Efficient Infrastructure Market Estimates and Forecast, 2021-2029 (USD Million)
6.6.3.3.1 By Type of Infrastructure
6.6.3.3.2 By Application
6.6.3.3 Rest of Central & South America Sustainable and Efficient Infrastructure Market Estimates and Forecast, 2021-2029 (USD Million)
6.6.3.3.1 By Type of Infrastructure
6.6.3.3.2 By Application
7 COMPETITIVE LANDCAPE
7.1 Company Market Share Analysis
7.2 Four Quadrant Positioning Matrix
7.2.1 Market Leaders
7.2.2 Market Visionaries
7.2.3 Market Challengers
7.2.4 Niche Market Players
7.3 Vendor Landscape
7.3.1 North America
7.3.2 Europe
7.3.3 Asia Pacific
7.3.4 Rest of the World
7.4 Company Profiles
7.4.1 Amvik Systems
7.4.1.1 Business Description & Financial Analysis
7.4.1.2 SWOT Analysis
7.4.1.3 Products & Services Offered
7.4.1.4 Strategic Alliances between Business Partners
7.4.2 BASF SE
7.4.2.1 Business Description & Financial Analysis
7.4.2.2 SWOT Analysis
7.4.2.3 Products & Services Offered
7.4.2.4 Strategic Alliances between Business Partners
7.4.3 Alumasc Group Plc
7.4.3.1 Business Description & Financial Analysis
7.4.3.2 SWOT Analysis
7.4.3.3 Products & Services Offered
7.4.3.4 Strategic Alliances between Business Partners
7.4.4 Binderholz GmbH
7.4.4.1 Business Description & Financial Analysis
7.4.4.2 SWOT Analysis
7.4.4.3 Products & Services Offered
7.4.4.4 Strategic Alliances between Business Partners
7.4.5 Bauder Limited
7.4.5.1 Business Description & Financial Analysis
7.4.5.2 SWOT Analysis
7.4.5.3 Products & Services Offered
7.4.5.4 Strategic Alliances between Business Partners
7.4.6 E. I. DU PONT DE NEMOURS AND COMPANY
7.4.6.1 Business Description & Financial Analysis
7.4.6.2 SWOT Analysis
7.4.6.3 Products & Services Offered
7.4.6.4 Strategic Alliances between Business Partners
7.4.7 Interface Inc.
7.4.7.1 Business Description & Financial Analysis
7.4.7.2 SWOT Analysis
7.4.7.3 Products & Services Offered
7.4.7.4 Strategic Alliances between Business Partners
7.4.8 Forbo International SA
7.4.8.1 Business Description & Financial Analysis
7.4.8.2 SWOT Analysis
7.4.8.3 Products & Services Offered
7.4.8.4 Strategic Alliances between Business Partners
7.4.9 Owens Corning
7.4.9.1 Business Description & Financial Analysis
7.4.9.2 SWOT Analysis
7.4.9.3 Products & Services Offered
7.4.9.4 Strategic Alliances between Business Partners
7.4.10 LafargeHolcim
7.4.10.1 Business Description & Financial Analysis
7.4.10.2 SWOT Analysis
7.4.10.3 Products & Services Offered
7.4.10.4 Strategic Alliances between Business Partners
7.4.11 Cemex
7.4.11.1 Business Description & Financial Analysis
7.4.11.2 SWOT Analysis
7.4.11.3 Products & Services Offered
7.4.11.4 Strategic Alliances between Business Partners
7.4.12 Saint-Gobain
7.4.12.1 Business Description & Financial Analysis
7.4.12.2 SWOT Analysis
7.4.12.3 Products & Services Offered
7.4.12.4 Strategic Alliances between Business Partners
7.4.13 Kingspan Global
7.4.13.1 Business Description & Financial Analysis
7.4.13.2 SWOT Analysis
7.4.13.3 Products & Services Offered
7.4.13.4 Strategic Alliances between Business Partners
7.4.14 Knauf Insulation
7.4.14.1 Business Description & Financial Analysis
7.4.14.2 SWOT Analysis
7.4.14.3 Products & Services Offered
7.4.14.4 Strategic Alliances between Business Partners
7.4.15 Steico
7.4.15.1 Business Description & Financial Analysis
7.4.15.2 SWOT Analysis
7.4.15.3 Products & Services Offered
7.4.15.4 Strategic Alliances between Business Partners
7.4.16 Rabot Dutilleul
7.4.16.1 Business Description & Financial Analysis
7.4.16.2 SWOT Analysis
7.4.16.3 Products & Services Offered
7.4.16.4 Strategic Alliances between Business Partners
7.4.17 ISOVER France
7.4.17.1 Business Description & Financial Analysis
7.4.17.2 SWOT Analysis
7.4.17.3 Products & Services Offered
7.4.17.4 Strategic Alliances between Business Partners
7.4.18 Siga
7.4.18.1 Business Description & Financial Analysis
7.4.18.2 SWOT Analysis
7.4.18.3 Products & Services Offered
7.4.18.4 Strategic Alliances between Business Partners
7.4.19 Valsir SpA
7.4.19.1 Business Description & Financial Analysis
7.4.19.2 SWOT Analysis
7.4.19.3 Products & Services Offered
7.4.19.4 Strategic Alliances between Business Partners
7.4.20 Springhill Group
7.4.20.1 Business Description & Financial Analysis
7.4.20.2 SWOT Analysis
7.4.20.3 Products & Services Offered
7.4.20.4 Strategic Alliances between Business Partners
7.4.21 Other Companies
7.4.21.1 Business Description & Financial Analysis
7.4.21.2 SWOT Analysis
7.4.21.3 Products & Services Offered
7.4.21.4 Strategic Alliances between Business Partners
8 RESEARCH METHODOLOGY
8.1 Market Introduction
8.1.1 Market Definition
8.1.2 Market Scope & Segmentation
8.2 Information Procurement
8.2.1 Secondary Research
8.2.1.1 Purchased Databases
8.2.1.2 GMEs Internal Data Repository
8.2.1.3 Secondary Resources & Third Party Perspectives
8.2.1.4 Company Information Sources
8.2.2 Primary Research
8.2.2.1 Various Types of Respondents for Primary Interviews
8.2.2.2 Number of Interviews Conducted throughout the Research Process
8.2.2.3 Primary Stakeholders
8.2.2.4 Discussion Guide for Primary Participants
8.2.3 Expert Panels
8.2.3.1 Expert Panels Across 30+ Industry
8.2.4 Paid Local Experts
8.2.4.1 Paid Local Experts Across 30+ Industry Across each Region
8.3 Market Estimation
8.3.1 Top-Down Approach
8.3.1.1 Macro-Economic Indicators Considered
8.3.1.2 Micro-Economic Indicators Considered
8.3.2 Bottom Up Approach
8.3.2.1 Company Share Analysis Approach
8.3.2.2 Estimation of Potential Product Sales
8.4 Data Triangulation
8.4.1 Data Collection
8.4.2 Time Series, Cross Sectional & Panel Data Analysis
8.4.3 Cluster Analysis
8.5 Analysis and Output
8.5.1 Inhouse AI Based Real Time Analytics Tool
8.5.2 Output From Desk & Primary Research
8.6 Research Assumptions & Limitations
8.6.1 Research Assumptions
8.6.2 Research Limitations
LIST OF TABLES
1 Global Sustainable and Efficient Infrastructure Market, By Type of Infrastructure, 2021-2029 (USD Mllion)
2 Renewable Energy Infrastructure Market, By Region, 2021-2029 (USD Mllion)
3 Green Buildings Market, By Region, 2021-2029 (USD Mllion)
4 Sustainable Transportation Market, By Region, 2021-2029 (USD Mllion)
5 Water and Wastewater Management Market, By Region, 2021-2029 (USD Mllion)
6 Global Sustainable and Efficient Infrastructure Market, By Application, 2021-2029 (USD Mllion)
7 Residential Buildings Market, By Region, 2021-2029 (USD Mllion)
8 Commercial & Industrial Buildings Market, By Region, 2021-2029 (USD Mllion)
9 Transportation Market, By Region, 2021-2029 (USD Mllion)
10 Utilities Market, By Region, 2021-2029 (USD Mllion)
11 Regional Analysis, 2021-2029 (USD Mllion)
12 North America Sustainable and Efficient Infrastructure Market, By Type of Infrastructure, 2021-2029 (USD Mllion)
13 North America Sustainable and Efficient Infrastructure Market, By Application, 2021-2029 (USD Mllion)
14 North America Sustainable and Efficient Infrastructure Market, By Country, 2021-2029 (USD Mllion)
15 U.S. Sustainable and Efficient Infrastructure Market, By Type of Infrastructure, 2021-2029 (USD Mllion)
16 U.S. Sustainable and Efficient Infrastructure Market, By Application, 2021-2029 (USD Mllion)
17 Canada Sustainable and Efficient Infrastructure Market, By Type of Infrastructure, 2021-2029 (USD Mllion)
18 Canada Sustainable and Efficient Infrastructure Market, By Application, 2021-2029 (USD Mllion)
19 Mexico Sustainable and Efficient Infrastructure Market, By Type of Infrastructure, 2021-2029 (USD Mllion)
20 Mexico Sustainable and Efficient Infrastructure Market, By Application, 2021-2029 (USD Mllion)
21 Europe Sustainable and Efficient Infrastructure Market, By Type of Infrastructure, 2021-2029 (USD Mllion)
22 Europe Sustainable and Efficient Infrastructure Market, By Application, 2021-2029 (USD Mllion)
23 Europe Sustainable and Efficient Infrastructure Market, By Country, 2021-2029 (USD Mllion)
24 Germany Sustainable and Efficient Infrastructure Market, By Type of Infrastructure, 2021-2029 (USD Mllion)
25 Germany Sustainable and Efficient Infrastructure Market, By Application, 2021-2029 (USD Mllion)
26 U.K. Sustainable and Efficient Infrastructure Market, By Type of Infrastructure, 2021-2029 (USD Mllion)
27 U.K. Sustainable and Efficient Infrastructure Market, By Application, 2021-2029 (USD Mllion)
28 France Sustainable and Efficient Infrastructure Market, By Type of Infrastructure, 2021-2029 (USD Mllion)
29 France Sustainable and Efficient Infrastructure Market, By Application, 2021-2029 (USD Mllion)
30 Italy Sustainable and Efficient Infrastructure Market, By Type of Infrastructure, 2021-2029 (USD Mllion)
31 Italy Sustainable and Efficient Infrastructure Market, By Application, 2021-2029 (USD Mllion)
32 Spain Sustainable and Efficient Infrastructure Market, By Type of Infrastructure, 2021-2029 (USD Mllion)
33 Spain Sustainable and Efficient Infrastructure Market, By Application, 2021-2029 (USD Mllion)
34 Netherlands Sustainable and Efficient Infrastructure Market, By Type of Infrastructure, 2021-2029 (USD Mllion)
35 Netherlands Sustainable and Efficient Infrastructure Market, By Application, 2021-2029 (USD Mllion)
36 Rest Of Europe Sustainable and Efficient Infrastructure Market, By Type of Infrastructure, 2021-2029 (USD Mllion)
37 Rest Of Europe Sustainable and Efficient Infrastructure Market, By Application, 2021-2029 (USD Mllion)
38 Asia Pacific Sustainable and Efficient Infrastructure Market, By Type of Infrastructure, 2021-2029 (USD Mllion)
39 Asia Pacific Sustainable and Efficient Infrastructure Market, By Application, 2021-2029 (USD Mllion)
40 Asia Pacific Sustainable and Efficient Infrastructure Market, By Country, 2021-2029 (USD Mllion)
41 China Sustainable and Efficient Infrastructure Market, By Type of Infrastructure, 2021-2029 (USD Mllion)
42 China Sustainable and Efficient Infrastructure Market, By Application, 2021-2029 (USD Mllion)
43 Japan Sustainable and Efficient Infrastructure Market, By Type of Infrastructure, 2021-2029 (USD Mllion)
44 Japan Sustainable and Efficient Infrastructure Market, By Application, 2021-2029 (USD Mllion)
45 India Sustainable and Efficient Infrastructure Market, By Type of Infrastructure, 2021-2029 (USD Mllion)
46 India Sustainable and Efficient Infrastructure Market, By Application, 2021-2029 (USD Mllion)
47 South Korea Sustainable and Efficient Infrastructure Market, By Type of Infrastructure, 2021-2029 (USD Mllion)
48 South Korea Sustainable and Efficient Infrastructure Market, By Application, 2021-2029 (USD Mllion)
49 Singapore Sustainable and Efficient Infrastructure Market, By Type of Infrastructure, 2021-2029 (USD Mllion)
50 Singapore Sustainable and Efficient Infrastructure Market, By Application, 2021-2029 (USD Mllion)
51 Thailand Sustainable and Efficient Infrastructure Market, By Type of Infrastructure, 2021-2029 (USD Mllion)
52 Thailand Sustainable and Efficient Infrastructure Market, By Application, 2021-2029 (USD Mllion)
53 Malaysia Sustainable and Efficient Infrastructure Market, By Type of Infrastructure, 2021-2029 (USD Mllion)
54 Malaysia Sustainable and Efficient Infrastructure Market, By Application, 2021-2029 (USD Mllion)
55 Indonesia Sustainable and Efficient Infrastructure Market, By Type of Infrastructure, 2021-2029 (USD Mllion)
56 Indonesia Sustainable and Efficient Infrastructure Market, By Application, 2021-2029 (USD Mllion)
57 Vietnam Sustainable and Efficient Infrastructure Market, By Type of Infrastructure, 2021-2029 (USD Mllion)
58 Vietnam Sustainable and Efficient Infrastructure Market, By Application, 2021-2029 (USD Mllion)
59 Taiwan Sustainable and Efficient Infrastructure Market, By Type of Infrastructure, 2021-2029 (USD Mllion)
60 Taiwan Sustainable and Efficient Infrastructure Market, By Application, 2021-2029 (USD Mllion)
61 Rest of APAC Sustainable and Efficient Infrastructure Market, By Type of Infrastructure, 2021-2029 (USD Mllion)
62 Rest of APAC Sustainable and Efficient Infrastructure Market, By Application, 2021-2029 (USD Mllion)
63 Middle East and Africa Sustainable and Efficient Infrastructure Market, By Type of Infrastructure, 2021-2029 (USD Mllion)
64 Middle East and Africa Sustainable and Efficient Infrastructure Market, By Application, 2021-2029 (USD Mllion)
65 Middle East and Africa Sustainable and Efficient Infrastructure Market, By country, 2021-2029 (USD Mllion)
66 Saudi Arabia Sustainable and Efficient Infrastructure Market, By Type of Infrastructure, 2021-2029 (USD Mllion)
67 Saudi Arabia Sustainable and Efficient Infrastructure Market, By Application, 2021-2029 (USD Mllion)
68 UAE Sustainable and Efficient Infrastructure Market, By Type of Infrastructure, 2021-2029 (USD Mllion)
69 UAE Sustainable and Efficient Infrastructure Market, By Application, 2021-2029 (USD Mllion)
70 Israel Sustainable and Efficient Infrastructure Market, By Type of Infrastructure, 2021-2029 (USD Mllion)
71 Israel Sustainable and Efficient Infrastructure Market, By Application, 2021-2029 (USD Mllion)
72 South Africa Sustainable and Efficient Infrastructure Market, By Type of Infrastructure, 2021-2029 (USD Mllion)
73 South Africa Sustainable and Efficient Infrastructure Market, By Application, 2021-2029 (USD Mllion)
74 Rest Of Middle East and Africa Sustainable and Efficient Infrastructure Market, By Type of Infrastructure, 2021-2029 (USD Mllion)
75 Rest Of Middle East and Africa Sustainable and Efficient Infrastructure Market, By Application, 2021-2029 (USD Mllion)
76 Central & South America Sustainable and Efficient Infrastructure Market, By Type of Infrastructure, 2021-2029 (USD Mllion)
77 Central & South America Sustainable and Efficient Infrastructure Market, By Application, 2021-2029 (USD Mllion)
78 Central & South America Sustainable and Efficient Infrastructure Market, By Country, 2021-2029 (USD Mllion)
79 Brazil Sustainable and Efficient Infrastructure Market, By Type of Infrastructure, 2021-2029 (USD Mllion)
80 Brazil Sustainable and Efficient Infrastructure Market, By Application, 2021-2029 (USD Mllion)
81 Chile Sustainable and Efficient Infrastructure Market, By Type of Infrastructure, 2021-2029 (USD Mllion)
82 Chile Sustainable and Efficient Infrastructure Market, By Application, 2021-2029 (USD Mllion)
83 Argentina Sustainable and Efficient Infrastructure Market, By Type of Infrastructure, 2021-2029 (USD Mllion)
84 Argentina Sustainable and Efficient Infrastructure Market, By Application, 2021-2029 (USD Mllion)
85 Rest Of Central & South America Sustainable and Efficient Infrastructure Market, By Type of Infrastructure, 2021-2029 (USD Mllion)
86 Rest Of Central & South America Sustainable and Efficient Infrastructure Market, By Application, 2021-2029 (USD Mllion)
87 Amvik Systems: Products & Services Offering
88 BASF SE: Products & Services Offering
89 Alumasc Group Plc: Products & Services Offering
90 Binderholz GmbH: Products & Services Offering
91 Bauder Limited: Products & Services Offering
92 E. I. DU PONT DE NEMOURS AND COMPANY: Products & Services Offering
93 Interface Inc.: Products & Services Offering
94 Forbo International SA: Products & Services Offering
95 Owens Corning: Products & Services Offering
96 LafargeHolcim: Products & Services Offering
97 Cemex: Products & Services Offering
98 Saint-Gobain: Products & Services Offering
99 Kingspan Global: Products & Services Offering
100 Knauf Insulation: Products & Services Offering
101 Steico: Products & Services Offering
102 Rabot Dutilleul: Products & Services Offering
103 ISOVER France: Products & Services Offering
104 Siga: Products & Services Offering
105 Valsir SpA: Products & Services Offering
106 Springhill Group: Products & Services Offering
107 Other Companies: Products & Services Offering
LIST OF FIGURES
1 Global Sustainable and Efficient Infrastructure Market Overview
2 Global Sustainable and Efficient Infrastructure Market Value From 2021-2029 (USD Mllion)
3 Global Sustainable and Efficient Infrastructure Market Share, By Type of Infrastructure (2023)
4 Global Sustainable and Efficient Infrastructure Market Share, By Application (2023)
5 Global Sustainable and Efficient Infrastructure Market, By Region (Asia Pacific Market)
6 Technological Trends In Global Sustainable and Efficient Infrastructure Market
7 Four Quadrant Competitor Positioning Matrix
8 Impact Of Macro & Micro Indicators On The Market
9 Impact Of Key Drivers On The Global Sustainable and Efficient Infrastructure Market
10 Impact Of Challenges On The Global Sustainable and Efficient Infrastructure Market
11 Porter’s Five Forces Analysis
12 Global Sustainable and Efficient Infrastructure Market: By Type of Infrastructure Scope Key Takeaways
13 Global Sustainable and Efficient Infrastructure Market, By Type of Infrastructure Segment: Revenue Growth Analysis
14 Renewable Energy Infrastructure Market, By Region, 2021-2029 (USD Mllion)
15 Green Buildings Market, By Region, 2021-2029 (USD Mllion)
16 Sustainable Transportation Market, By Region, 2021-2029 (USD Mllion)
17 Water and Wastewater Management Market, By Region, 2021-2029 (USD Mllion)
18 Global Sustainable and Efficient Infrastructure Market: By Application Scope Key Takeaways
19 Global Sustainable and Efficient Infrastructure Market, By Application Segment: Revenue Growth Analysis
20 Residential Buildings Market, By Region, 2021-2029 (USD Mllion)
21 Commercial & Industrial Buildings Market, By Region, 2021-2029 (USD Mllion)
22 Transportation Market, By Region, 2021-2029 (USD Mllion)
23 Utilities Market, By Region, 2021-2029 (USD Mllion)
24 Regional Segment: Revenue Growth Analysis
25 Global Sustainable and Efficient Infrastructure Market: Regional Analysis
26 North America Sustainable and Efficient Infrastructure Market Overview
27 North America Sustainable and Efficient Infrastructure Market, By Type of Infrastructure
28 North America Sustainable and Efficient Infrastructure Market, By Application
29 North America Sustainable and Efficient Infrastructure Market, By Country
30 U.S. Sustainable and Efficient Infrastructure Market, By Type of Infrastructure
31 U.S. Sustainable and Efficient Infrastructure Market, By Application
32 Canada Sustainable and Efficient Infrastructure Market, By Type of Infrastructure
33 Canada Sustainable and Efficient Infrastructure Market, By Application
34 Mexico Sustainable and Efficient Infrastructure Market, By Type of Infrastructure
35 Mexico Sustainable and Efficient Infrastructure Market, By Application
36 Four Quadrant Positioning Matrix
37 Company Market Share Analysis
38 Amvik Systems: Company Snapshot
39 Amvik Systems: SWOT Analysis
40 Amvik Systems: Geographic Presence
41 BASF SE: Company Snapshot
42 BASF SE: SWOT Analysis
43 BASF SE: Geographic Presence
44 Alumasc Group Plc: Company Snapshot
45 Alumasc Group Plc: SWOT Analysis
46 Alumasc Group Plc: Geographic Presence
47 Binderholz GmbH: Company Snapshot
48 Binderholz GmbH: Swot Analysis
49 Binderholz GmbH: Geographic Presence
50 Bauder Limited: Company Snapshot
51 Bauder Limited: SWOT Analysis
52 Bauder Limited: Geographic Presence
53 E. I. DU PONT DE NEMOURS AND COMPANY: Company Snapshot
54 E. I. DU PONT DE NEMOURS AND COMPANY: SWOT Analysis
55 E. I. DU PONT DE NEMOURS AND COMPANY: Geographic Presence
56 Interface Inc.: Company Snapshot
57 Interface Inc.: SWOT Analysis
58 Interface Inc.: Geographic Presence
59 Forbo International SA: Company Snapshot
60 Forbo International SA: SWOT Analysis
61 Forbo International SA: Geographic Presence
62 Owens Corning.: Company Snapshot
63 Owens Corning.: SWOT Analysis
64 Owens Corning.: Geographic Presence
65 LafargeHolcim: Company Snapshot
66 LafargeHolcim: SWOT Analysis
67 LafargeHolcim: Geographic Presence
68 Cemex: Company Snapshot
69 Cemex: SWOT Analysis
70 Cemex: Geographic Presence
71 Saint-Gobain: Company Snapshot
72 Saint-Gobain: SWOT Analysis
73 Saint-Gobain: Geographic Presence
74 Kingspan Global: Company Snapshot
75 Kingspan Global: SWOT Analysis
76 Kingspan Global: Geographic Presence
77 Knauf Insulation: Company Snapshot
78 Knauf Insulation: SWOT Analysis
79 Knauf Insulation: Geographic Presence
80 Steico: Company Snapshot
81 Steico: SWOT Analysis
82 Steico: Geographic Presence
83 Rabot Dutilleul: Company Snapshot
84 Rabot Dutilleul: SWOT Analysis
85 Rabot Dutilleul: Geographic Presence
86 ISOVER France: Company Snapshot
87 ISOVER France: SWOT Analysis
88 ISOVER France: Geographic Presence
89 Siga: Company Snapshot
90 Siga: SWOT Analysis
91 Siga: Geographic Presence
92 Valsir SpA: Company Snapshot
93 Valsir SpA: SWOT Analysis
94 Valsir SpA: Geographic Presence
95 Springhill Group: Company Snapshot
96 Springhill Group: SWOT Analysis
97 Springhill Group: Geographic Presence
98 Other Companies: Company Snapshot
99 Other Companies: SWOT Analysis
100 Other Companies: Geographic Presence
The Global Sustainable and Efficient Infrastructure Market has been studied from the year 2019 till 2029. However, the CAGR provided in the report is from the year 2024 to 2029. The research methodology involved three stages: Desk research, Primary research, and Analysis & Output from the entire research process.

The desk research involved a robust background study which meant referring to paid and unpaid databases to understand the market dynamics; mapping contracts from press releases; identifying the key players in the market, studying their product portfolio, competition level, annual reports/SEC filings & investor presentations; and learning the demand and supply-side analysis for the Sustainable and Efficient Infrastructure Market.

The primary research activity included telephonic conversations with more than 50 tier 1 industry consultants, distributors, and end-use product manufacturers.

Finally, based on the above thorough research process, an in-depth analysis was carried out considering the following aspects: market attractiveness, current & future market trends, market share analysis, SWOT analysis of the company and customer analytics.

Frequently Asked Questions

This FREE sample includes market data points, ranging from trend analyses to market estimates & forecasts. See for yourself.
Or view our licence options:
Tailor made solutions just for you
80% of our clients seek made-to-order reports. How do you want us to tailor yours?
OUR CLIENTS


