This report was recently updated on August 22 2025 with the latest and most recent
market numbers
Global Tech-enabled REITs Market Size, Trends & Analysis - Forecasts to 2029 By Property Type (Residential REITs, Commercial REITs, Industrial REITs, Retail REITs, Healthcare REITs, Hospitality REITs, and Mixed-use REITs), By Technology Integration (Artificial Intelligence (AI), Big Data Analytics, Internet of Things (IoT), Blockchain, Automation and Robotics, Augmented Reality/Virtual Reality (AR/VR), Cloud Computing, and Cybersecurity), and By Region (North America, Asia Pacific, Central and South America, Europe, and Middle East and Africa), Competitive Landscape, Company Market Share Analysis, and End User Analysis
The global tech-enabled real estate investment trusts (REITs) market is estimated to exhibit a CAGR of 6.4% from 2024 to 2029.
The primary factors propelling the market growth are the rise of coworking spaces, government initiatives, and private sector investments in infrastructure projects. Coworking spaces serve the expanding needs of small enterprises, freelancers, entrepreneurs, and those seeking flexible office solutions. By investing in buildings that provide flexible lease periods, scalable office layouts, and shared amenities catered to the demands of contemporary tenants, tech-enabled REITs benefit from this trend. Additionally, coworking spaces draw various tenants from different sectors, such as professional, creative, and technology services. A varied tenant base helps tech-enabled REITs minimize sector-specific risks and vacancies while optimizing occupancy rates and stable rental income. For instance, Statista reports that there are over 18,700 coworking spaces worldwide.
The increased demand for logistics and warehousing facilities and the growing adoption of smart building technologies are expected to support the market growth. The demand for logistics and warehousing facilities to support the storage, fulfillment, and distribution of items ordered online has increased dramatically due to the rapid growth of e-commerce. Tech-enabled REITs can profit from this trend by investing in well-located assets that act as last-mile delivery hubs or regional distribution centers for e-commerce retailers. For instance, the Warehousing and Fulfillment (2024) report states that the United States has a vast network of warehouses with a combined total area of around 15.5 billion square feet.
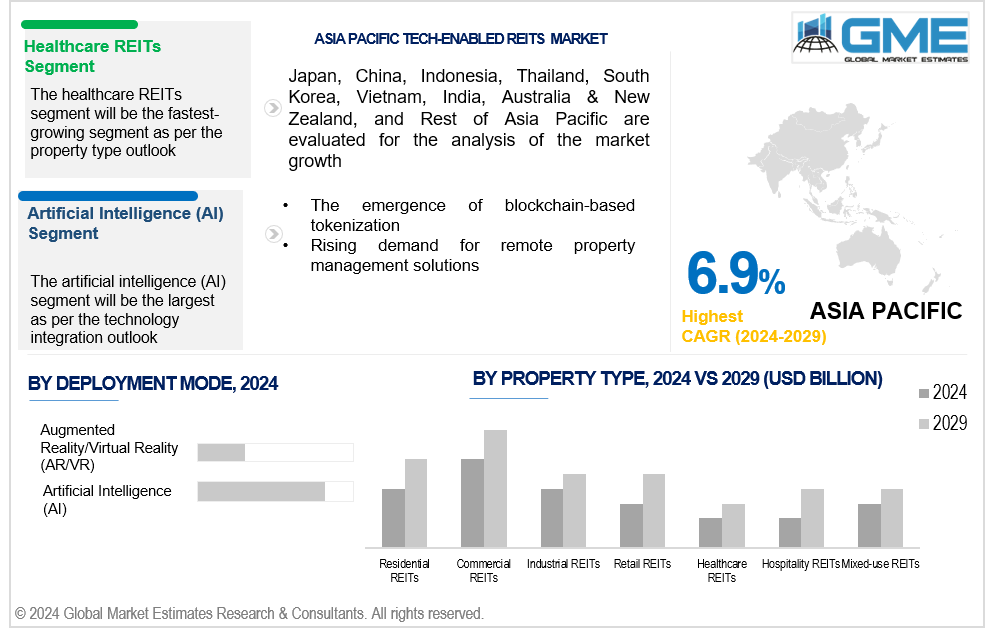
The emergence of blockchain-based tokenization and rising demand for remote property management solutions propel market growth. Blockchain-based tokenization makes fractional ownership of real estate assets possible, letting investors buy and trade tokens that reflect ownership shares in properties. By improving real estate market liquidity, this fractional ownership model makes it easier and more efficient for investors to exchange tokens on digital asset exchanges. Tech-enabled REITs leverage tokenization to unlock previously illiquid real estate assets, democratize access to investment opportunities, and attract a broader base of investors.
By integrating property technology (proptech), tech-enabled REITs have opportunities to improve asset performance, tenant experience, and operational efficiency. Investing in IoT devices, advanced analytics, artificial intelligence, and smart building technology can maximize value creation, lower operating expenses, and improve property management. Moreover, tech-enabled REITs can identify market patterns, make well-informed investment decisions, and maximize portfolio performance by utilizing data analytics and predictive modeling.
However, interest rate sensitivity and regulatory oversight and compliance requirements hinder market growth.
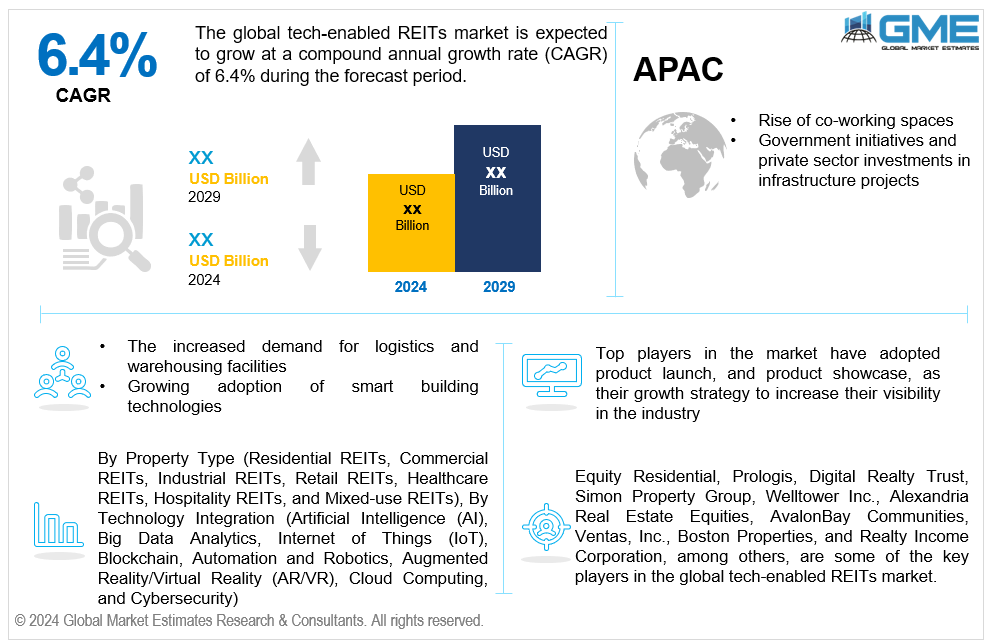
The commercial REITs segment is expected to hold the largest share of the market over the forecast period. The commercial REITs area includes various property types, including office buildings, retail stores, industrial warehouses, and mixed-use complexes. Commercial REITs can distribute risk throughout various asset classes and geographical areas due to this diversification, improving their portfolios' stability and resilience. In addition, there is still a constant need for office space in major cities and commercial districts, even in the face of changing workplace trends like flexible scheduling and remote work. Commercial REITs invest in cutting-edge office buildings with amenities and infrastructure that meet the needs of contemporary tenants, increasing demand for commercial office space and fostering growth in rental income.
The healthcare REITs segment is expected to be the fastest-growing segment in the market from 2024 to 2029. Senior housing, medical office buildings, and specialized care facilities are among the healthcare services and facilities in high demand due to aging populations and rising healthcare costs. Demand for healthcare REITs is being driven by the need for more real estate assets to support medical treatment, long-term care, and senior living facilities as the world's population ages.
The artificial intelligence (AI) segment is expected to hold the largest share of the market over the forecast period. With the help of artificial intelligence (AI), real estate investment trusts (REITs) can analyze massive volumes of data and derive useful insights by utilizing machine learning algorithms, predictive modeling approaches, and sophisticated analytics. AI-powered analytics improve portfolio optimization, risk assessment, asset management, and property acquisition decision-making processes, allowing real estate investment trusts (REITs) to find investment opportunities, reduce risks, and maximize profits.
The augmented reality/virtual reality (AR/VR) segment is anticipated to be the fastest-growing segment in the market from 2024 to 2029. With the use of AR and VR technology, real estate agents can create immersive experiences for prospective tenants, investors, and purchasers, enabling them to tour properties from any location in the globe virtually. Virtual property tours driven by AR and VR offer immersive walkthroughs, interactive floor plans, and accurate 3D renderings, increasing the exposure, engagement, and interest of the property among potential stakeholders.
North America is expected to be the largest region in the global market. The rise of the gig economy and remote work in North America is driving demand for coworking spaces, serviced offices, and flexible workspaces, which in turn is driving the market's growth in the region. By investing in buildings with cutting-edge technological infrastructure, collaborative workspaces, and facilities catering to contemporary tenants' demands, tech-enabled REITs take advantage of this trend and raise demand and occupancy rates in important metropolitan regions.
Asia Pacific is anticipated to witness rapid growth during the forecast period. The rise of the gig economy and remote work in APAC is driving demand for coworking spaces, serviced offices, and flexible workspaces. These factors are also driving the growth of the regional market. Capitalizing on the region's infrastructure development projects and economic potential, tech-enabled REITs invest in assets related to infrastructure, such as data centers, airports, and toll highways.
Equity Residential, Prologis, Digital Realty Trust, Simon Property Group, Welltower Inc., Alexandria Real Estate Equities, AvalonBay Communities, Ventas, Inc., Boston Properties, and Realty Income Corporation, among others, are some of the key players in the global tech-enabled REITs market.
Please note: This is not an exhaustive list of companies profiled in the report.
In March 2024, NRT12, Digital Realty's second data center, was opened at the NRT facility in Inzai City, Chiba Prefecture. NRT12 increases the campus's key IT capacity by 34 megawatts (MW) to 73 MW to satisfy the growing need in the Tokyo metropolitan area for flexible, scalable, and AI-ready data centers.
In February 2024, Affinity Living Communities ("Affinity"), a vertically integrated developer and operator of age-restricted and age-targeted Wellness Housing, and Welltower Inc. established a long-term strategic partnership.
1 STRATEGIC INSIGHTS ON NEW REVENUE POCKETS
1.1 Strategic Opportunity & Attractiveness Analysis
1.1.1 Hot Revenue Pockets
1.1.2 Market Attractiveness Score
1.1.3 Revenue Impacting Opportunity
1.1.4 High Growing Region/Country
1.1.5 Competitor Analysis
1.1.6 Consumer Analysis
1.2 Global Market Estimates' View
1.3 Strategic Insights across Business Functions
1.3.1 For Chief Executive Officers
1.3.2 For Chief Marketing Officers
1.3.3 For Chief Strategy Officers
1.4 Evaluate the Potential of your Existing Business Lines vs. New Lines to Enter Into
2 TECHNOLOGICAL TRENDS
2.1 Technological Adoption Rate
2.2 Current Trend Impact Analysis
2.3 Future Trend Impact Analysis
3 GLOBAL MARKET OUTLOOK
3.1 Market Pyramid Analysis
3.1.1 Introduction
3.1.2 Adjacent Market Opportunities
3.1.3 Ancillary Market Opportunities
3.2 Demand Side Analysis
3.2.1 Market Drivers: Impact Analysis
3.2.2 Market Restraints: Impact Analysis
3.2.3 Market Opportunities: Impact Analysis
3.2.4 Market Challenges: Impact Analysis
3.3 Supply Side Analysis
3.3.1 Porter’s Five Forces Analysis
3.3.1.1 Threat of New Entrants
3.3.1.2 Threat of New Substitutes
3.3.1.3 Bargaining Power of Suppliers
3.3.1.4 Bargaining Power of Buyers
3.3.1.5 Intensity of Competitive Rivalry
3.3.2 SWOT Analysis; By Factor (Political & Legal, Economic, and Technological)
3.3.2.1 Political Landscape
3.3.2.2 Economic Landscape
3.3.2.3 Social Landscape
3.3.2.4 Technology Landscape
3.3.3 Value Chain Analysis
3.3.4 Trend Analysis
3.3.5 Gap Analysis
3.3.6 Cost Analysis
4 GLOBAL TECH-ENABLED REITS MARKET, BY Property Type
4.1 Introduction
4.2 Tech-enabled REITs Market: Property Type Scope Key Takeaways
4.3 Revenue Growth Analysis, 2023 & 2029
4.4 Residential REITs
4.4.1 Residential REITs Market Estimates and Forecast, 2021-2029 (USD Million)
4.5 Commercial REITs
4.5.1 Commercial REITs Market Estimates and Forecast, 2021-2029 (USD Million)
4.6 Industrial REITs
4.6.1 Industrial REITs Market Estimates and Forecast, 2021-2029 (USD Million)
4.7 Retail REITs
4.7.1 Retail REITs Market Estimates and Forecast, 2021-2029 (USD Million)
4.8 Healthcare REITs
4.8.1 Healthcare REITs Market Estimates and Forecast, 2021-2029 (USD Million)
4.9 Hospitality REITs
4.9.1 Hospitality REITs Market Estimates and Forecast, 2021-2029 (USD Million)
4.10 Mixed-use REITs
4.10.1 Mixed-use REITs Market Estimates and Forecast, 2021-2029 (USD Million)
5 GLOBAL TECH-ENABLED REITS MARKET, BY TECHNOLOGY INTEGRATION
5.1 Introduction
5.2 Tech-enabled REITs Market: Technology Integration Scope Key Takeaways
5.3 Revenue Growth Analysis, 2023 & 2029
5.4 Artificial Intelligence (AI)
5.4.1 Artificial Intelligence (AI) Market Estimates and Forecast, 2021-2029 (USD Million)
5.5 Big Data Analytics
5.5.1 Big Data Analytics Market Estimates and Forecast, 2021-2029 (USD Million)
5.6 Internet of Things (IoT)
5.6.1 Internet of Things (IoT) Market Estimates and Forecast, 2021-2029 (USD Million)
5.7 Blockchain
5.7.1 Blockchain Market Estimates and Forecast, 2021-2029 (USD Million)
5.8 Automation and Robotics
5.8.1 Automation and Robotics Market Estimates and Forecast, 2021-2029 (USD Million)
5.9 Augmented Reality/Virtual Reality (AR/VR)
5.9.1 Augmented Reality/Virtual Reality (AR/VR) Market Estimates and Forecast, 2021-2029 (USD Million)
5.10 Cloud Computing
5.10.1 Cloud Computing Market Estimates and Forecast, 2021-2029 (USD Million)
5.11 Cybersecurity
5.11.1 Cybersecurity Market Estimates and Forecast, 2021-2029 (USD Million)
6 GLOBAL TECH-ENABLED REITS MARKET, BY REGION
6.1 Introduction
6.2 North America Tech-enabled REITs Market Estimates and Forecast, 2021-2029 (USD Million)
6.2.1 By Property Type
6.2.2 By Technology Integration
6.2.3 By Country
6.2.3.1 U.S. Tech-enabled REITs Market Estimates and Forecast, 2021-2029 (USD Million)
6.2.3.1.1 By Property Type
6.2.3.1.2 By Technology Integration
6.2.3.2 Canada Tech-enabled REITs Market Estimates and Forecast, 2021-2029 (USD Million)
6.2.3.2.1 By Property Type
6.2.3.2.2 By Technology Integration
6.2.3.3 Mexico Tech-enabled REITs Market Estimates and Forecast, 2021-2029 (USD Million)
6.2.3.3.1 By Property Type
6.2.3.3.2 By Technology Integration
6.3 Europe Tech-enabled REITs Market Estimates and Forecast, 2021-2029 (USD Million)
6.3.1 By Property Type
6.3.2 By Technology Integration
6.3.3 By Country
6.3.3.1 Germany Tech-enabled REITs Market Estimates and Forecast, 2021-2029 (USD Million)
6.3.3.1.1 By Property Type
6.3.3.1.2 By Technology Integration
6.3.3.2 U.K. Tech-enabled REITs Market Estimates and Forecast, 2021-2029 (USD Million)
6.3.3.2.1 By Property Type
6.3.3.2.2 By Technology Integration
6.3.3.3 France Tech-enabled REITs Market Estimates and Forecast, 2021-2029 (USD Million)
6.3.3.3.1 By Property Type
6.3.3.3.2 By Technology Integration
6.3.3.4 Italy Tech-enabled REITs Market Estimates and Forecast, 2021-2029 (USD Million)
6.3.3.4.1 By Property Type
6.3.3.4.2 By Technology Integration
6.3.3.5 Spain Tech-enabled REITs Market Estimates and Forecast, 2021-2029 (USD Million)
6.3.3.5.1 By Property Type
6.3.3.5.2 By Technology Integration
6.3.3.6 Netherlands Tech-enabled REITs Market Estimates and Forecast, 2021-2029 (USD Million)
6.3.3.6.1 By Property Type
6.3.3.6.2 By Technology Integration
6.3.3.7 Rest of Europe Tech-enabled REITs Market Estimates and Forecast, 2021-2029 (USD Million)
6.3.3.6.1 By Property Type
6.3.3.6.2 By Technology Integration
6.4 Asia Pacific Tech-enabled REITs Market Estimates and Forecast, 2021-2029 (USD Million)
6.4.1 By Property Type
6.4.2 By Technology Integration
6.4.3 By Country
6.4.3.1 China Tech-enabled REITs Market Estimates and Forecast, 2021-2029 (USD Million)
6.4.3.1.1 By Property Type
6.4.3.1.2 By Technology Integration
6.4.3.2 Japan Tech-enabled REITs Market Estimates and Forecast, 2021-2029 (USD Million)
6.4.3.2.1 By Property Type
6.4.3.2.2 By Technology Integration
6.4.3.3 India Tech-enabled REITs Market Estimates and Forecast, 2021-2029 (USD Million)
6.4.3.3.1 By Property Type
6.4.3.3.2 By Technology Integration
6.4.3.4 South Korea Tech-enabled REITs Market Estimates and Forecast, 2021-2029 (USD Million)
6.4.3.4.1 By Property Type
6.4.3.4.2 By Technology Integration
6.4.3.5 Singapore Tech-enabled REITs Market Estimates and Forecast, 2021-2029 (USD Million)
6.4.3.5.1 By Property Type
6.4.3.5.2 By Technology Integration
6.4.3.6 Malaysia Tech-enabled REITs Market Estimates and Forecast, 2021-2029 (USD Million)
6.4.3.6.1 By Property Type
6.4.3.6.2 By Technology Integration
6.4.3.7 Thailand Tech-enabled REITs Market Estimates and Forecast, 2021-2029 (USD Million)
6.4.3.6.1 By Property Type
6.4.3.6.2 By Technology Integration
6.4.3.8 Indonesia Tech-enabled REITs Market Estimates and Forecast, 2021-2029 (USD Million)
6.4.3.7.1 By Property Type
6.4.3.7.2 By Technology Integration
6.4.3.9 Vietnam Tech-enabled REITs Market Estimates and Forecast, 2021-2029 (USD Million)
6.4.3.8.1 By Property Type
6.4.3.8.2 By Technology Integration
6.4.3.10 Taiwan Tech-enabled REITs Market Estimates and Forecast, 2021-2029 (USD Million)
6.4.3.10.1 By Property Type
6.4.3.10.2 By Technology Integration
6.4.3.11 Rest of Asia Pacific Tech-enabled REITs Market Estimates and Forecast, 2021-2029 (USD Million)
6.4.3.11.1 By Property Type
6.4.3.11.2 By Technology Integration
6.5 Middle East and Africa Tech-enabled REITs Market Estimates and Forecast, 2021-2029 (USD Million)
6.5.1 By Property Type
6.5.2 By Technology Integration
6.5.3 By Country
6.5.3.1 Saudi Arabia Tech-enabled REITs Market Estimates and Forecast, 2021-2029 (USD Million)
6.5.3.1.1 By Property Type
6.5.3.1.2 By Technology Integration
6.5.3.2 U.A.E. Tech-enabled REITs Market Estimates and Forecast, 2021-2029 (USD Million)
6.5.3.2.1 By Property Type
6.5.3.2.2 By Technology Integration
6.5.3.3 Israel Tech-enabled REITs Market Estimates and Forecast, 2021-2029 (USD Million)
6.5.3.3.1 By Property Type
6.5.3.3.2 By Technology Integration
6.5.3.4 South Africa Tech-enabled REITs Market Estimates and Forecast, 2021-2029 (USD Million)
6.5.3.4.1 By Property Type
6.5.3.4.2 By Technology Integration
6.5.3.5 Rest of Middle East and Africa Tech-enabled REITs Market Estimates and Forecast, 2021-2029 (USD Million)
6.5.3.5.1 By Property Type
6.5.3.5.2 By Technology Integration
6.6 Central and South America Tech-enabled REITs Market Estimates and Forecast, 2021-2029 (USD Million)
6.6.1 By Property Type
6.6.2 By Technology Integration
6.6.3 By Country
6.6.3.1 Brazil Tech-enabled REITs Market Estimates and Forecast, 2021-2029 (USD Million)
6.6.3.1.1 By Property Type
6.6.3.1.2 By Technology Integration
6.6.3.2 Argentina Tech-enabled REITs Market Estimates and Forecast, 2021-2029 (USD Million)
6.6.3.2.1 By Property Type
6.6.3.2.2 By Technology Integration
6.6.3.3 Chile Tech-enabled REITs Market Estimates and Forecast, 2021-2029 (USD Million)
6.6.3.3.1 By Property Type
6.6.3.3.2 By Technology Integration
6.6.3.3 Rest of Central and South America Tech-enabled REITs Market Estimates and Forecast, 2021-2029 (USD Million)
6.6.3.3.1 By Property Type
6.6.3.3.2 By Technology Integration
7 COMPETITIVE LANDCAPE
7.1 Company Market Share Analysis
7.2 Four Quadrant Positioning Matrix
7.2.1 Market Leaders
7.2.2 Market Visionaries
7.2.3 Market Challengers
7.2.4 Niche Market Players
7.3 Vendor Landscape
7.3.1 North America
7.3.2 Europe
7.3.3 Asia Pacific
7.3.4 Rest of the World
7.4 Company Profiles
7.4.1 Equity Residential
7.4.1.1 Business Description & Financial Analysis
7.4.1.2 SWOT Analysis
7.4.1.3 Products & Services Offered
7.4.1.4 Strategic Alliances between Business Partners
7.4.2 Prologis
7.4.2.1 Business Description & Financial Analysis
7.4.2.2 SWOT Analysis
7.4.2.3 Products & Services Offered
7.4.2.4 Strategic Alliances between Business Partners
7.4.3 Digital Realty Trust
7.4.3.1 Business Description & Financial Analysis
7.4.3.2 SWOT Analysis
7.4.3.3 Products & Services Offered
7.4.3.4 Strategic Alliances between Business Partners
7.4.4 Simon Property Group
7.4.4.1 Business Description & Financial Analysis
7.4.4.2 SWOT Analysis
7.4.4.3 Products & Services Offered
7.4.4.4 Strategic Alliances between Business Partners
7.4.5 Welltower Inc.
7.4.5.1 Business Description & Financial Analysis
7.4.5.2 SWOT Analysis
7.4.5.3 Products & Services Offered
7.4.5.4 Strategic Alliances between Business Partners
7.4.6 ALEXANDRIA REAL ESTATE EQUITIES
7.4.6.1 Business Description & Financial Analysis
7.4.6.2 SWOT Analysis
7.4.6.3 Products & Services Offered
7.4.6.4 Strategic Alliances between Business Partners
7.4.7 AvalonBay Communities
7.4.7.1 Business Description & Financial Analysis
7.4.7.2 SWOT Analysis
7.4.7.3 Products & Services Offered
7.4.7.4 Strategic Alliances between Business Partners
7.4.8 Ventas, Inc.
7.4.8.1 Business Description & Financial Analysis
7.4.8.2 SWOT Analysis
7.4.8.3 Products & Services Offered
7.4.8.4 Strategic Alliances between Business Partners
7.4.9 Boston Properties
7.4.9.1 Business Description & Financial Analysis
7.4.9.2 SWOT Analysis
7.4.9.3 Products & Services Offered
7.4.9.4 Strategic Alliances between Business Partners
7.4.10 Realty Income Corporation
7.4.10.1 Business Description & Financial Analysis
7.4.10.2 SWOT Analysis
7.4.10.3 Products & Services Offered
7.4.10.4 Strategic Alliances between Business Partners
7.4.11 Other Companies
7.4.11.1 Business Description & Financial Analysis
7.4.11.2 SWOT Analysis
7.4.11.3 Products & Services Offered
7.4.11.4 Strategic Alliances between Business Partners
8 RESEARCH METHODOLOGY
8.1 Market Introduction
8.1.1 Market Definition
8.1.2 Market Scope & Segmentation
8.2 Information Procurement
8.2.1 Secondary Research
8.2.1.1 Purchased Databases
8.2.1.2 GMEs Internal Data Repository
8.2.1.3 Secondary Resources & Third Party Perspectives
8.2.1.4 Company Information Sources
8.2.2 Primary Research
8.2.2.1 Various Types of Respondents for Primary Interviews
8.2.2.2 Number of Interviews Conducted throughout the Research Process
8.2.2.3 Primary Stakeholders
8.2.2.4 Discussion Guide for Primary Participants
8.2.3 Expert Panels
8.2.3.1 Expert Panels Across 30+ Industry
8.2.4 Paid Local Experts
8.2.4.1 Paid Local Experts Across 30+ Industry Across each Region
8.3 Market Estimation
8.3.1 Top-Down Approach
8.3.1.1 Macro-Economic Indicators Considered
8.3.1.2 Micro-Economic Indicators Considered
8.3.2 Bottom Up Approach
8.3.2.1 Company Share Analysis Approach
8.3.2.2 Estimation of Potential Product Sales
8.4 Data Triangulation
8.4.1 Data Collection
8.4.2 Time Series, Cross Sectional & Panel Data Analysis
8.4.3 Cluster Analysis
8.5 Analysis and Output
8.5.1 Inhouse AI Based Real Time Analytics Tool
8.5.2 Output From Desk & Primary Research
8.6 Research Assumptions & Limitations
8.6.1 Research Assumptions
8.6.2 Research Limitations
LIST OF TABLES
1 Global Tech-enabled REITs Market, By Property Type, 2021-2029 (USD Mllion)
2 Residential REITs Market, By Region, 2021-2029 (USD Mllion)
3 Commercial REITs Market, By Region, 2021-2029 (USD Mllion)
4 Industrial REITs Market, By Region, 2021-2029 (USD Mllion)
5 Retail REITs Market, By Region, 2021-2029 (USD Mllion)
6 Healthcare REITs Market, By Region, 2021-2029 (USD Mllion)
7 Hospitality REITs Market, By Region, 2021-2029 (USD Mllion)
8 Mixed-use REITs Market, By Region, 2021-2029 (USD Mllion)
9 Global Tech-enabled REITs Market, By Technology Integration, 2021-2029 (USD Mllion)
10 Artificial Intelligence (AI) Market, By Region, 2021-2029 (USD Mllion)
11 Big Data Analytics Market, By Region, 2021-2029 (USD Mllion)
12 Internet of Things (IoT) Market, By Region, 2021-2029 (USD Mllion)
13 Blockchain Market, By Region, 2021-2029 (USD Mllion)
14 Automation and Robotics Market, By Region, 2021-2029 (USD Mllion)
15 Augmented Reality/Virtual Reality (AR/VR) Market, By Region, 2021-2029 (USD Mllion)
16 Cloud Computing Market, By Region, 2021-2029 (USD Mllion)
17 Cybersecurity Market, By Region, 2021-2029 (USD Mllion)
18 Regional Analysis, 2021-2029 (USD Mllion)
19 North America Tech-enabled REITs Market, By Property Type, 2021-2029 (USD Mllion)
20 North America Tech-enabled REITs Market, By Technology Integration, 2021-2029 (USD Mllion)
21 North America Tech-enabled REITs Market, By COUNTRY, 2021-2029 (USD Mllion)
22 U.S. Tech-enabled REITs Market, By Property Type, 2021-2029 (USD Mllion)
23 U.S. Tech-enabled REITs Market, By Technology Integration, 2021-2029 (USD Mllion)
24 Canada Tech-enabled REITs Market, By Property Type, 2021-2029 (USD Mllion)
25 Canada Tech-enabled REITs Market, By Technology Integration, 2021-2029 (USD Mllion)
26 Mexico Tech-enabled REITs Market, By Property Type, 2021-2029 (USD Mllion)
27 Mexico Tech-enabled REITs Market, By Technology Integration, 2021-2029 (USD Mllion)
28 Europe Tech-enabled REITs Market, By Property Type, 2021-2029 (USD Mllion)
29 Europe Tech-enabled REITs Market, By Technology Integration, 2021-2029 (USD Mllion)
30 EUROPE Tech-enabled REITs Market, By COUNTRY, 2021-2029 (USD Mllion)
31 Germany Tech-enabled REITs Market, By Property Type, 2021-2029 (USD Mllion)
32 Germany Tech-enabled REITs Market, By Technology Integration, 2021-2029 (USD Mllion)
33 U.K. Tech-enabled REITs Market, By Property Type, 2021-2029 (USD Mllion)
34 U.K. Tech-enabled REITs Market, By Technology Integration, 2021-2029 (USD Mllion)
35 France Tech-enabled REITs Market, By Property Type, 2021-2029 (USD Mllion)
36 France Tech-enabled REITs Market, By Technology Integration, 2021-2029 (USD Mllion)
37 Italy Tech-enabled REITs Market, By Property Type, 2021-2029 (USD Mllion)
38 Italy Tech-enabled REITs Market, By Technology Integration, 2021-2029 (USD Mllion)
39 Spain Tech-enabled REITs Market, By Property Type, 2021-2029 (USD Mllion)
40 Spain Tech-enabled REITs Market, By Technology Integration, 2021-2029 (USD Mllion)
41 Netherlands Tech-enabled REITs Market, By Property Type, 2021-2029 (USD Mllion)
42 Netherlands Tech-enabled REITs Market, By Technology Integration, 2021-2029 (USD Mllion)
43 Rest Of Europe Tech-enabled REITs Market, By Property Type, 2021-2029 (USD Mllion)
44 Rest Of Europe Tech-enabled REITs Market, By Technology Integration, 2021-2029 (USD Mllion)
45 Asia Pacific Tech-enabled REITs Market, By Property Type, 2021-2029 (USD Mllion)
46 Asia Pacific Tech-enabled REITs Market, By Technology Integration, 2021-2029 (USD Mllion)
47 ASIA PACIFIC Tech-enabled REITs Market, By COUNTRY, 2021-2029 (USD Mllion)
48 China Tech-enabled REITs Market, By Property Type, 2021-2029 (USD Mllion)
49 China Tech-enabled REITs Market, By Technology Integration, 2021-2029 (USD Mllion)
50 Japan Tech-enabled REITs Market, By Property Type, 2021-2029 (USD Mllion)
51 Japan Tech-enabled REITs Market, By Technology Integration, 2021-2029 (USD Mllion)
52 India Tech-enabled REITs Market, By Property Type, 2021-2029 (USD Mllion)
53 India Tech-enabled REITs Market, By Technology Integration, 2021-2029 (USD Mllion)
54 South Korea Tech-enabled REITs Market, By Property Type, 2021-2029 (USD Mllion)
55 South Korea Tech-enabled REITs Market, By Technology Integration, 2021-2029 (USD Mllion)
56 Singapore Tech-enabled REITs Market, By Property Type, 2021-2029 (USD Mllion)
57 Singapore Tech-enabled REITs Market, By Technology Integration, 2021-2029 (USD Mllion)
58 Thailand Tech-enabled REITs Market, By Property Type, 2021-2029 (USD Mllion)
59 Thailand Tech-enabled REITs Market, By Technology Integration, 2021-2029 (USD Mllion)
60 Malaysia Tech-enabled REITs Market, By Property Type, 2021-2029 (USD Mllion)
61 Malaysia Tech-enabled REITs Market, By Technology Integration, 2021-2029 (USD Mllion)
62 Indonesia Tech-enabled REITs Market, By Property Type, 2021-2029 (USD Mllion)
63 Indonesia Tech-enabled REITs Market, By Technology Integration, 2021-2029 (USD Mllion)
64 Vietnam Tech-enabled REITs Market, By Property Type, 2021-2029 (USD Mllion)
65 Vietnam Tech-enabled REITs Market, By Technology Integration, 2021-2029 (USD Mllion)
66 Taiwan Tech-enabled REITs Market, By Property Type, 2021-2029 (USD Mllion)
67 Taiwan Tech-enabled REITs Market, By Technology Integration, 2021-2029 (USD Mllion)
68 Rest of APAC Tech-enabled REITs Market, By Property Type, 2021-2029 (USD Mllion)
69 Rest of APAC Tech-enabled REITs Market, By Technology Integration, 2021-2029 (USD Mllion)
70 Middle East and Africa Tech-enabled REITs Market, By Property Type, 2021-2029 (USD Mllion)
71 Middle East and Africa Tech-enabled REITs Market, By Technology Integration, 2021-2029 (USD Mllion)
72 MIDDLE EAST & ADRICA Tech-enabled REITs Market, By COUNTRY, 2021-2029 (USD Mllion)
73 Saudi Arabia Tech-enabled REITs Market, By Property Type, 2021-2029 (USD Mllion)
74 Saudi Arabia Tech-enabled REITs Market, By Technology Integration, 2021-2029 (USD Mllion)
75 UAE Tech-enabled REITs Market, By Property Type, 2021-2029 (USD Mllion)
76 UAE Tech-enabled REITs Market, By Technology Integration, 2021-2029 (USD Mllion)
77 Israel Tech-enabled REITs Market, By Property Type, 2021-2029 (USD Mllion)
78 Israel Tech-enabled REITs Market, By Technology Integration, 2021-2029 (USD Mllion)
79 South Africa Tech-enabled REITs Market, By Property Type, 2021-2029 (USD Mllion)
80 South Africa Tech-enabled REITs Market, By Technology Integration, 2021-2029 (USD Mllion)
81 Rest Of Middle East and Africa Tech-enabled REITs Market, By Property Type, 2021-2029 (USD Mllion)
82 Rest Of Middle East and Africa Tech-enabled REITs Market, By Technology Integration, 2021-2029 (USD Mllion)
83 Central and South America Tech-enabled REITs Market, By Property Type, 2021-2029 (USD Mllion)
84 Central and South America Tech-enabled REITs Market, By Technology Integration, 2021-2029 (USD Mllion)
85 CENTRAL AND SOUTH AMERICA Tech-enabled REITs Market, By COUNTRY, 2021-2029 (USD Mllion)
86 Brazil Tech-enabled REITs Market, By Property Type, 2021-2029 (USD Mllion)
87 Brazil Tech-enabled REITs Market, By Technology Integration, 2021-2029 (USD Mllion)
88 Chile Tech-enabled REITs Market, By Property Type, 2021-2029 (USD Mllion)
89 Chile Tech-enabled REITs Market, By Technology Integration, 2021-2029 (USD Mllion)
90 Argentina Tech-enabled REITs Market, By Property Type, 2021-2029 (USD Mllion)
91 Argentina Tech-enabled REITs Market, By Technology Integration, 2021-2029 (USD Mllion)
92 Rest Of Central and South America Tech-enabled REITs Market, By Property Type, 2021-2029 (USD Mllion)
93 Rest Of Central and South America Tech-enabled REITs Market, By Technology Integration, 2021-2029 (USD Mllion)
94 Equity Residential: Products & Services Offering
95 Prologis: Products & Services Offering
96 Digital Realty Trust: Products & Services Offering
97 Simon Property Group: Products & Services Offering
98 Welltower Inc.: Products & Services Offering
99 ALEXANDRIA REAL ESTATE EQUITIES: Products & Services Offering
100 AvalonBay Communities : Products & Services Offering
101 Ventas, Inc.: Products & Services Offering
102 Boston Properties, Inc: Products & Services Offering
103 Realty Income Corporation: Products & Services Offering
104 Other Companies: Products & Services Offering
LIST OF FIGURES
1 Global Tech-enabled REITs Market Overview
2 Global Tech-enabled REITs Market Value From 2021-2029 (USD Mllion)
3 Global Tech-enabled REITs Market Share, By Property Type (2023)
4 Global Tech-enabled REITs Market Share, By Technology Integration (2023)
5 Global Tech-enabled REITs Market, By Region (Asia Pacific Market)
6 Technological Trends In Global Tech-enabled REITs Market
7 Four Quadrant Competitor Positioning Matrix
8 Impact Of Macro & Micro Indicators On The Market
9 Impact Of Key Drivers On The Global Tech-enabled REITs Market
10 Impact Of Challenges On The Global Tech-enabled REITs Market
11 Porter’s Five Forces Analysis
12 Global Tech-enabled REITs Market: By Property Type Scope Key Takeaways
13 Global Tech-enabled REITs Market, By Property Type Segment: Revenue Growth Analysis
14 Residential REITs Market, By Region, 2021-2029 (USD Mllion)
15 Commercial REITs Market, By Region, 2021-2029 (USD Mllion)
16 Industrial REITs Market, By Region, 2021-2029 (USD Mllion)
17 Retail REITs Market, By Region, 2021-2029 (USD Mllion)
18 Healthcare REITs Market, By Region, 2021-2029 (USD Mllion)
19 Hospitality REITs Market, By Region, 2021-2029 (USD Mllion)
20 Mixed-use REITs Market, By Region, 2021-2029 (USD Mllion)
21 Global Tech-enabled REITs Market: By Technology Integration Scope Key Takeaways
22 Global Tech-enabled REITs Market, By Technology Integration Segment: Revenue Growth Analysis
23 Artificial Intelligence (AI) Market, By Region, 2021-2029 (USD Mllion)
24 Big Data Analytics Market, By Region, 2021-2029 (USD Mllion)
25 Internet of Things (IoT) Market, By Region, 2021-2029 (USD Mllion)
26 Blockchain Market, By Region, 2021-2029 (USD Mllion)
27 Automation and Robotics Market, By Region, 2021-2029 (USD Mllion)
28 Augmented Reality/Virtual Reality (AR/VR) Market, By Region, 2021-2029 (USD Mllion)
29 Cloud Computing Market, By Region, 2021-2029 (USD Mllion)
30 Cybersecurity Market, By Region, 2021-2029 (USD Mllion) Regional Segment: Revenue Growth Analysis
31 Global Tech-enabled REITs Market: Regional Analysis
32 North America Tech-enabled REITs Market Overview
33 North America Tech-enabled REITs Market, By Property Type
34 North America Tech-enabled REITs Market, By Technology Integration
35 North America Tech-enabled REITs Market, By Country
36 U.S. Tech-enabled REITs Market, By Property Type
37 U.S. Tech-enabled REITs Market, By Technology Integration
38 Canada Tech-enabled REITs Market, By Property Type
39 Canada Tech-enabled REITs Market, By Technology Integration
40 Mexico Tech-enabled REITs Market, By Property Type
41 Mexico Tech-enabled REITs Market, By Technology Integration
42 Four Quadrant Positioning Matrix
43 Company Market Share Analysis
44 Equity Residential: Company Snapshot
45 Equity Residential: SWOT Analysis
46 Equity Residential: Geographic Presence
47 Prologis: Company Snapshot
48 Prologis: SWOT Analysis
49 Prologis: Geographic Presence
50 Digital Realty Trust: Company Snapshot
51 Digital Realty Trust: SWOT Analysis
52 Digital Realty Trust: Geographic Presence
53 Simon Property Group: Company Snapshot
54 Simon Property Group: Swot Analysis
55 Simon Property Group: Geographic Presence
56 Welltower Inc.: Company Snapshot
57 Welltower Inc.: SWOT Analysis
58 Welltower Inc.: Geographic Presence
59 ALEXANDRIA REAL ESTATE EQUITIES: Company Snapshot
60 ALEXANDRIA REAL ESTATE EQUITIES: SWOT Analysis
61 ALEXANDRIA REAL ESTATE EQUITIES: Geographic Presence
62 AvalonBay Communities : Company Snapshot
63 AvalonBay Communities : SWOT Analysis
64 AvalonBay Communities : Geographic Presence
65 Ventas, Inc.: Company Snapshot
66 Ventas, Inc.: SWOT Analysis
67 Ventas, Inc.: Geographic Presence
68 Boston Properties, Inc.: Company Snapshot
69 Boston Properties, Inc.: SWOT Analysis
70 Boston Properties, Inc.: Geographic Presence
71 Realty Income Corporation: Company Snapshot
72 Realty Income Corporation: SWOT Analysis
73 Realty Income Corporation: Geographic Presence
74 Other Companies: Company Snapshot
75 Other Companies: SWOT Analysis
76 Other Companies: Geographic Presence
The Global Tech-enabled REITs Market has been studied from the year 2019 till 2029. However, the CAGR provided in the report is from the year 2024 to 2029. The research methodology involved three stages: Desk research, Primary research, and Analysis & Output from the entire research process.

The desk research involved a robust background study which meant referring to paid and unpaid databases to understand the market dynamics; mapping contracts from press releases; identifying the key players in the market, studying their product portfolio, competition level, annual reports/SEC filings & investor presentations; and learning the demand and supply-side analysis for the Tech-enabled REITs Market.

The primary research activity included telephonic conversations with more than 50 tier 1 industry consultants, distributors, and end-use product manufacturers.

Finally, based on the above thorough research process, an in-depth analysis was carried out considering the following aspects: market attractiveness, current & future market trends, market share analysis, SWOT analysis of the company and customer analytics.

Frequently Asked Questions

This FREE sample includes market data points, ranging from trend analyses to market estimates & forecasts. See for yourself.
Or view our licence options:
Tailor made solutions just for you
80% of our clients seek made-to-order reports. How do you want us to tailor yours?
OUR CLIENTS


