This report was recently updated on August 15 2025 with the latest and most recent
market numbers
Global Vanillic Acid Market Size, Trends & Analysis - Forecasts to 2028 By Purity (Purity 99%, Purity 98%, and Others), By Application (Pharmaceutical Intermediates, Flavors and Fragrances, and Other Applications), and By Region (North America, Asia Pacific, Central & South America, Europe, and Middle East and Africa), Competitive Landscape, Company Market Share Analysis, and Competitor Analysis
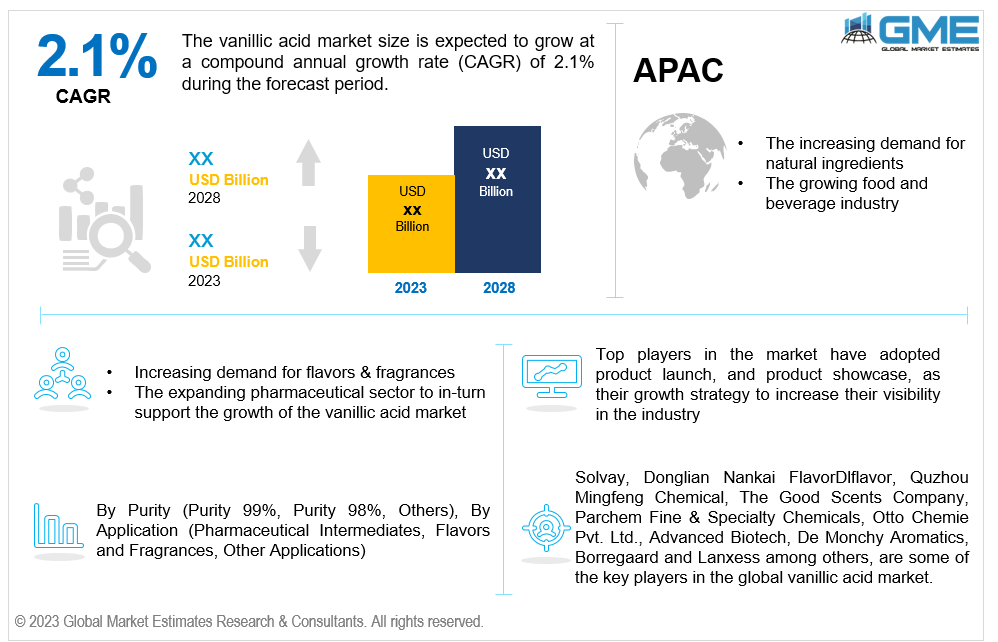
The global vanillic acid market is estimated to grow at a CAGR of 2.1% from 2023 to 2028.
The increasing demand for natural ingredients and actives is one of the major drivers of the global vanillic acid market growth. The demand for natural flavouring ingredients such as vanillic acid is increasing as a result of consumers' rising knowledge and desire about natural and clean-label products. It originates from natural sources like vanilla beans, and hence it has become a popular substitute for artificial additives. For instance, in 2022, Solvay, one of the top players in the market, added three new grades (Sublima, Alta, and Delica) to its rhovanil natural product line. Additionally, Solvay claimed in a 2020 article that to create various chocolate flavours, makers of chocolate substitute naturally manufactured vanillin for synthetic items.
The rapidly flourishing food and beverage industry and increasing demand for flavours and fragrances are expected to support growth of the market. Vanillic acid is widely used in the food and beverage sector. Natural flavourings like vanillic acid are being used in several food and beverage goods, as a result of manufacturers reacting to customer requests for natural products. Items such as baked foods, drinks, dairy products, and confections, among others are included in this.
Furthermore, with the expanding pharmaceutical sector, demand for vanillic acid is increasing because it acts as a building block in the production of certain drugs and active pharmaceutical ingredients (APIs). Vanillic acid may find direct applications in certain drug formulations due to its chemical properties and potential therapeutic benefits. Vanillic acid may be used to create novel medicine formulations as a result of research and studies evaluating its potential as a pharmaceutical ingredient. This would increase demand for vanillic acid in the pharmaceutical industry, in the near future.
The increasing research and development investments and growing awareness about environmentally friendly products are propelling the market growth. Investments in R&D can aid in enhancing the methods used to produce vanillic acid. Higher yields and reduced production costs due to more effective synthesis processes can make vanillic acid more commercially feasible and available to a wider variety of businesses.
Global vanillic acid market is expected to gain several growth opportunities because of growing interest in functional foods and nutraceuticals. Its potential use in functional foods and dietary supplements as an antioxidant and anti-inflammatory chemical may enhance human health. Moreover, food, drinks, and personal care items are in greater demand, owing to increasing purchasing power in emerging nations. Vanillic acid producers can take advantage of this opportunity to enter these markets and broaden their market reach internationally.
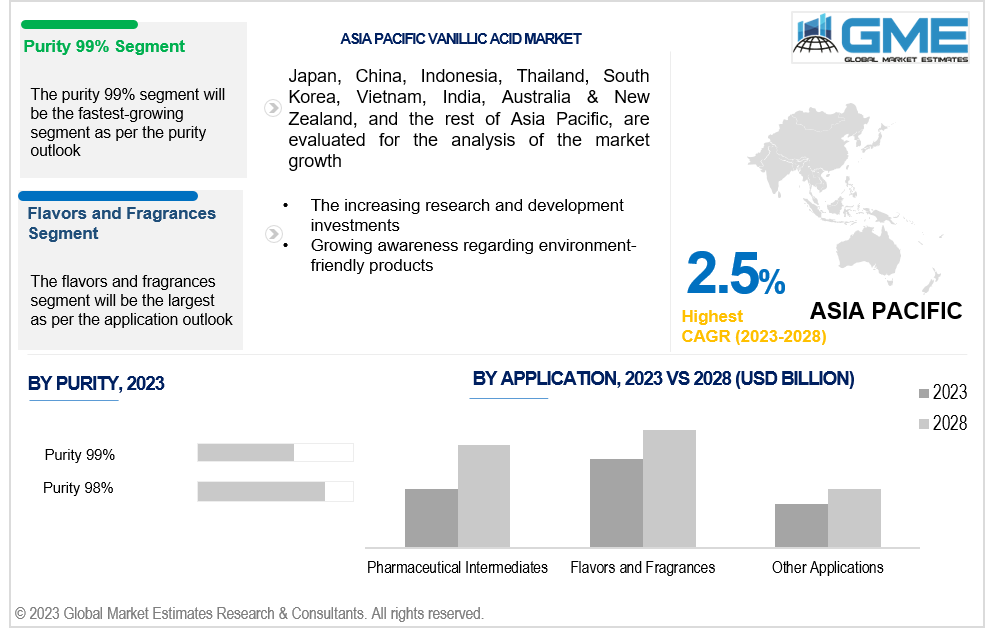
The 98% purity segment holds the largest share of the market. A purity level of 98% ensures that vanillic acid provides the desired flavour impact without any undesirable impurities. Strict rules govern the purity of substances used in various industries including food, medicine, and cosmetics. Vanillic acid with 98% purity is widely accepted for use in different applications, complying with regulatory standards. This level of purity gives manufacturers flexibility in formulation, allowing precise management of flavour profiles and ensuring desired sensory qualities.
The 99% purity segment is expected to be the fastest-growing segment from 2023 to 2028. Higher purity levels are sought for research into the potential medicinal benefits of vanillic acid, providing precise and reliable results. Pharmaceutical companies and academic institutes prefer 99% purity for their research and medication development efforts.
The flavours and fragrances segment holds the largest share of the market, driven by the increasing awareness of natural and eco-friendly fragrances, skin-friendly deodorants, and aromatic purifiers. It is a vital component of scents, perfumeries, essential oils, and candles. The growing demand of vanillic acid in markets such as aromatherapy, toiletries, and vehicle fresheners is expected to boost future demand.
The pharmaceutical intermediates segment is anticipated to be the fastest-growing segment during the forecast period. Its proven anti-inflammatory and anti-cancer properties make it valuable for innovative medications. Vanillic acid is used to mask tablet flavours, reduce bitterness, create oral medications, topical medicated creams, and other pharmaceutical products. Thus, rising adoption of vanillic acid in food, cosmetics, and pharmaceutical industries is expected to fuel demand for vanillic acid in the coming years.
North America is anticipated to be the largest market in the global vanillic acid market due to several factors. Rapid urbanisation, rising purchasing power, high household income, industrialization, and evolving consumer food preferences have contributed to the growth of the food sector in North America. As a key application area for vanillic acid in the food industry, the region's expanding urban population has led to an increased demand for processed foods and flavours. This favourable market landscape, combined with changing food tastes, positions North America as the dominant region in the global vanillic acid market.
Asia Pacific is estimated to witness rapid growth during the forecast period. This is driven by factors such as the growing population and rising disposable incomes in countries such as China, India, and Japan. As the food and beverage industries in these nations continue to expand, the demand for vanillic acid is expected to increase significantly. Additionally, the region's increasing focus on natural and organic products further boosts the market's potential for growth in the Asia Pacific region.
Some of the key players operating in the global vanillic acid market include Solvay, Donglian Nankai FlavorDlflavor, Quzhou Mingfeng Chemical, The Good Scents Company, Parchem Fine & Specialty Chemicals, Otto Chemie Pvt. Ltd., Advanced Biotech, De Monchy Aromatics, Borregaard, and Lanxess, among others.
Please note: This is not an exhaustive list of companies profiled in the report.
1 STRATEGIC INSIGHTS ON NEW REVENUE POCKETS
1.1 Strategic Opportunity & Attractiveness Analysis
1.1.1 Hot Revenue Pockets
1.1.2 Market Attractiveness Score
1.1.3 Revenue Impacting Opportunity
1.1.4 High Growing Region/Country
1.1.5 Competitor Analysis
1.1.6 Consumer Analysis
1.2 Global Market Estimates' View
1.3 Strategic Insights across Business Functions
1.3.1 For Chief Executive Officers
1.3.2 For Chief Marketing Officers
1.3.3 For Chief Strategy Officers
1.4 Evaluate the Potential of your Existing Business Lines vs. New Lines to Enter Into
2.1 Technological Adoption Rate
2.2 Current Trend Impact Analysis
2.3 Future Trend Impact Analysis
2.4 Data Metrics
3.1.2 Adjacent Market Opportunities
3.1.3 Ancillary Market Opportunities
3.2.1 Market Drivers: Impact Analysis
3.2.2 Market Restraints: Impact Analysis
3.2.3 Market Opportunities: Impact Analysis
3.2.4 Market Challenges: Impact Analysis
3.3.1 Porter’s Five Forces Analysis
3.3.1.1 Threat of New Entrants
3.3.1.2 Threat of New Substitutes
3.3.1.3 Bargaining Power of Suppliers
3.3.1.4 Bargaining Power of Buyers
3.3.1.5 Intensity of Competitive Rivalry
3.3.2 SWOT Analysis; By Factor (Political & Legal, Economic, and Technological)
4 GLOBAL VANILLIC ACID MARKET, BY PURITY
4.2 Vanillic Acid Market: Purity Scope Key Takeaways
4.3 Revenue Growth Analysis, 2022 & 2028
4.4.1 Purity 99% Market Estimates and Forecast, 2020-2028 (USD Million)
4.5.1 Purity 98% Market Estimates and Forecast, 2020-2028 (USD Million)
4.6.1 Others Market Estimates and Forecast, 2020-2028 (USD Million)
5 GLOBAL VANILLIC ACID MARKET, BY APPLICATION
5.2 Vanillic Acid Market: Application Scope Key Takeaways
5.3 Revenue Growth Analysis, 2022 & 2028
5.4 Pharmaceutical Intermediates
5.4.1 Pharmaceutical Intermediates Market Estimates and Forecast, 2020-2028 (USD Million)
5.5.1 Flavors and Fragrances Market Estimates and Forecast, 2020-2028 (USD Million)
5.6.1 Other Applications Market Estimates and Forecast, 2020-2028 (USD Million)
6 GLOBAL VANILLIC ACID MARKET, BY REGION
6.2 North America Vanillic Acid Market Estimates and Forecast, 2020-2028 (USD Million)
6.2.3.1 U.S. Vanillic Acid Market Estimates and Forecast, 2020-2028 (USD Million)
6.2.3.2 Canada Vanillic Acid Market Estimates and Forecast, 2020-2028 (USD Million)
6.2.3.3 Mexico Vanillic Acid Market Estimates and Forecast, 2020-2028 (USD Million)
6.3 Europe Vanillic Acid Market Estimates and Forecast, 2020-2028 (USD Million)
6.3.3.1 Germany Vanillic Acid Market Estimates and Forecast, 2020-2028 (USD Million)
6.3.3.2 U.K. Vanillic Acid Market Estimates and Forecast, 2020-2028 (USD Million)
6.3.3.3 France Vanillic Acid Market Estimates and Forecast, 2020-2028 (USD Million)
6.3.3.4 Italy Vanillic Acid Market Estimates and Forecast, 2020-2028 (USD Million)
6.3.3.5 Spain Vanillic Acid Market Estimates and Forecast, 2020-2028 (USD Million)
6.3.3.6 Netherlands Vanillic Acid Market Estimates and Forecast, 2020-2028 (USD Million)
6.3.3.7 Rest of Europe Vanillic Acid Market Estimates and Forecast, 2020-2028 (USD Million)
6.4 Asia Pacific Vanillic Acid Market Estimates and Forecast, 2020-2028 (USD Million)
6.4.3.1 China Vanillic Acid Market Estimates and Forecast, 2020-2028 (USD Million)
6.4.3.2 Japan Vanillic Acid Market Estimates and Forecast, 2020-2028 (USD Million)
6.4.3.3 India Vanillic Acid Market Estimates and Forecast, 2020-2028 (USD Million)
6.4.3.4 South Korea Vanillic Acid Market Estimates and Forecast, 2020-2028 (USD Million)
6.4.3.5 Singapore Vanillic Acid Market Estimates and Forecast, 2020-2028 (USD Million)
6.4.3.6 Malaysia Vanillic Acid Market Estimates and Forecast, 2020-2028 (USD Million)
6.4.3.7 Thailand Vanillic Acid Market Estimates and Forecast, 2020-2028 (USD Million)
6.4.3.8 Indonesia Vanillic Acid Market Estimates and Forecast, 2020-2028 (USD Million)
6.4.3.9 Vietnam Vanillic Acid Market Estimates and Forecast, 2020-2028 (USD Million)
6.4.3.10 Taiwan Vanillic Acid Market Estimates and Forecast, 2020-2028 (USD Million)
6.4.3.11 Rest of Asia Pacific Vanillic Acid Market Estimates and Forecast, 2020-2028 (USD Million)
6.5 Middle East and Africa Vanillic Acid Market Estimates and Forecast, 2020-2028 (USD Million)
6.5.3.1 Saudi Arabia Vanillic Acid Market Estimates and Forecast, 2020-2028 (USD Million)
6.5.3.2 U.A.E. Vanillic Acid Market Estimates and Forecast, 2020-2028 (USD Million)
6.5.3.3 Israel Vanillic Acid Market Estimates and Forecast, 2020-2028 (USD Million)
6.5.3.4 South Africa Vanillic Acid Market Estimates and Forecast, 2020-2028 (USD Million)
6.6 Central & South America Vanillic Acid Market Estimates and Forecast, 2020-2028 (USD Million)
6.6.3.1 Brazil Vanillic Acid Market Estimates and Forecast, 2020-2028 (USD Million)
6.6.3.2 Argentina Vanillic Acid Market Estimates and Forecast, 2020-2028 (USD Million)
6.6.3.3 Chile Vanillic Acid Market Estimates and Forecast, 2020-2028 (USD Million)
7.1 Company Market Share Analysis
7.2 Four Quadrant Positioning Matrix
7.4.1.1 Business Description & Financial Analysis
7.4.1.3 Products & Services Offered
7.4.1.4 Strategic Alliances between Business Partners
7.4.2 Donglian Nankai FlavorDlflavor
7.4.2.1 Business Description & Financial Analysis
7.4.2.3 Products & Services Offered
7.4.2.4 Strategic Alliances between Business Partners
7.4.3 Quzhou Mingfeng Chemical
7.4.3.1 Business Description & Financial Analysis
7.4.3.3 Products & Services Offered
7.4.3.4 Strategic Alliances between Business Partners
7.4.4.1 Business Description & Financial Analysis
7.4.4.3 Products & Services Offered
7.4.4.4 Strategic Alliances between Business Partners
7.4.5 Parchem Fine & Specialty Chemicals
7.4.5.1 Business Description & Financial Analysis
7.4.5.3 Products & Services Offered
7.4.5.4 Strategic Alliances between Business Partners
7.4.6.1 Business Description & Financial Analysis
7.4.6.3 Products & Services Offered
7.4.6.4 Strategic Alliances between Business Partners
7.4.7.1 Business Description & Financial Analysis
7.4.7.3 Products & Services Offered
7.4.7.4 Strategic Alliances between Business Partners
7.4.8.1 Business Description & Financial Analysis
7.4.8.3 Products & Services Offered
7.4.8.4 Strategic Alliances between Business Partners
7.4.9.1 Business Description & Financial Analysis
7.4.9.3 Products & Services Offered
7.4.9.4 Strategic Alliances between Business Partners
7.4.10.1 Business Description & Financial Analysis
7.4.10.3 Products & Services Offered
7.4.10.4 Strategic Alliances between Business Partners
7.4.11.1 Business Description & Financial Analysis
7.4.11.3 Products & Services Offered
7.4.11.4 Strategic Alliances between Business Partners
8.1.2 Market Scope & Segmentation
8.2.1.2 GMEs Internal Data Repository
8.2.1.3 Secondary Resources & Third Party Perspectives
8.2.1.4 Company Information Sources
8.2.2.1 Various Types of Respondents for Primary Interviews
8.2.2.2 Number of Interviews Conducted throughout the Research Process
8.2.2.4 Discussion Guide for Primary Participants
8.2.3.1 Expert Panels Across 30+ Industry
8.2.4.1 Paid Local Experts Across 30+ Industry Across each Region
8.3.1.1 Macro-Economic Indicators Considered
8.3.1.2 Micro-Economic Indicators Considered
8.3.2.1 Company Share Analysis Approach
8.3.2.2 Estimation of Potential Product Sales
8.4.2 Time Series, Cross Sectional & Panel Data Analysis
8.5.1 Inhouse AI Based Real Time Analytics Tool
8.5.2 Output From Desk & Primary Research
8.6 Research Assumptions & Limitations
LIST OF TABLES
1 Global Vanillic Acid Market, By Purity, 2020-2028 (USD Mllion)
2 Purity 99% Market, By Region, 2020-2028 (USD Mllion)
3 Purity 98% Market, By Region, 2020-2028 (USD Mllion)
4 Others Market, By Region, 2020-2028 (USD Mllion)
5 Global Vanillic Acid Market, By Application, 2020-2028 (USD Mllion)
6 Pharmaceutical Intermediates Market, By Region, 2020-2028 (USD Mllion)
7 Flavors and Fragrances Market, By Region, 2020-2028 (USD Mllion)
8 Other Applications Market, By Region, 2020-2028 (USD Mllion)
9 Regional Analysis, 2020-2028 (USD Mllion)
10 North America Vanillic Acid Market, By Purity, 2020-2028 (USD Mllion)
11 North America Vanillic Acid Market, By Application, 2020-2028 (USD Mllion)
12 U.S. Vanillic Acid Market, By Purity, 2020-2028 (USD Mllion)
13 U.S. Vanillic Acid Market, By Application, 2020-2028 (USD Mllion)
14 Canada Vanillic Acid Market, By Purity, 2020-2028 (USD Mllion)
15 Canada Vanillic Acid Market, By Application, 2020-2028 (USD Mllion)
16 Mexico Vanillic Acid Market, By Purity, 2020-2028 (USD Mllion)
17 Mexico Vanillic Acid Market, By Application, 2020-2028 (USD Mllion)
18 Europe Vanillic Acid Market, By Purity, 2020-2028 (USD Mllion)
19 Europe Vanillic Acid Market, By Application, 2020-2028 (USD Mllion)
20 Germany Vanillic Acid Market, By Purity, 2020-2028 (USD Mllion)
21 Germany Vanillic Acid Market, By Application, 2020-2028 (USD Mllion)
22 U.K. Vanillic Acid Market, By Purity, 2020-2028 (USD Mllion)
23 U.K. Vanillic Acid Market, By Application, 2020-2028 (USD Mllion)
24 France Vanillic Acid Market, By Purity, 2020-2028 (USD Mllion)
25 France Vanillic Acid Market, By Application, 2020-2028 (USD Mllion)
26 Italy Vanillic Acid Market, By Purity, 2020-2028 (USD Mllion)
27 Italy Vanillic Acid Market, By Application, 2020-2028 (USD Mllion)
28 Spain Vanillic Acid Market, By Purity, 2020-2028 (USD Mllion)
29 Spain Vanillic Acid Market, By Application, 2020-2028 (USD Mllion)
30 Netherlands Vanillic Acid Market, By Purity, 2020-2028 (USD Mllion)
31 Netherlands Vanillic Acid Market, By Application, 2020-2028 (USD Mllion)
32 Rest Of Europe Vanillic Acid Market, By Purity, 2020-2028 (USD Mllion)
33 Rest Of Europe Vanillic Acid Market, By Application, 2020-2028 (USD Mllion)
34 Asia Pacific Vanillic Acid Market, By Purity, 2020-2028 (USD Mllion)
35 Asia Pacific Vanillic Acid Market, By Application, 2020-2028 (USD Mllion)
36 China Vanillic Acid Market, By Purity, 2020-2028 (USD Mllion)
37 China Vanillic Acid Market, By Application, 2020-2028 (USD Mllion)
38 Japan Vanillic Acid Market, By Purity, 2020-2028 (USD Mllion)
39 Japan Vanillic Acid Market, By Application, 2020-2028 (USD Mllion)
40 India Vanillic Acid Market, By Purity, 2020-2028 (USD Mllion)
41 India Vanillic Acid Market, By Application, 2020-2028 (USD Mllion)
42 South Korea Vanillic Acid Market, By Purity, 2020-2028 (USD Mllion)
43 South Korea Vanillic Acid Market, By Application, 2020-2028 (USD Mllion)
44 Singapore Vanillic Acid Market, By Purity, 2020-2028 (USD Mllion)
45 Singapore Vanillic Acid Market, By Application, 2020-2028 (USD Mllion)
46 Thailand Vanillic Acid Market, By Purity, 2020-2028 (USD Mllion)
47 Thailand Vanillic Acid Market, By Application, 2020-2028 (USD Mllion)
48 Malaysia Vanillic Acid Market, By Purity, 2020-2028 (USD Mllion)
49 Malaysia Vanillic Acid Market, By Application, 2020-2028 (USD Mllion)
50 Indonesia Vanillic Acid Market, By Purity, 2020-2028 (USD Mllion)
51 Indonesia Vanillic Acid Market, By Application, 2020-2028 (USD Mllion)
52 Vietnam Vanillic Acid Market, By Purity, 2020-2028 (USD Mllion)
53 Vietnam Vanillic Acid Market, By Application, 2020-2028 (USD Mllion)
54 Taiwan Vanillic Acid Market, By Purity, 2020-2028 (USD Mllion)
55 Taiwan Vanillic Acid Market, By Application, 2020-2028 (USD Mllion)
56 Rest of APAC Vanillic Acid Market, By Purity, 2020-2028 (USD Mllion)
57 Rest of APAC Vanillic Acid Market, By Application, 2020-2028 (USD Mllion)
58 Middle East AND Africa Vanillic Acid Market, By Purity, 2020-2028 (USD Mllion)
59 Middle East AND Africa Vanillic Acid Market, By Application, 2020-2028 (USD Mllion)
60 Saudi Arabia Vanillic Acid Market, By Purity, 2020-2028 (USD Mllion)
61 Saudi Arabia Vanillic Acid Market, By Application, 2020-2028 (USD Mllion)
62 UAE Vanillic Acid Market, By Purity, 2020-2028 (USD Mllion)
63 UAE Vanillic Acid Market, By Application, 2020-2028 (USD Mllion)
64 Israel Vanillic Acid Market, By Purity, 2020-2028 (USD Mllion)
65 Israel Vanillic Acid Market, By Application, 2020-2028 (USD Mllion)
66 South Africa Vanillic Acid Market, By Purity, 2020-2028 (USD Mllion)
67 South Africa Vanillic Acid Market, By Application, 2020-2028 (USD Mllion)
68 Rest Of Middle East AND Africa Vanillic Acid Market, By Purity, 2020-2028 (USD Mllion)
69 Rest Of Middle East AND Africa Vanillic Acid Market, By Application, 2020-2028 (USD Mllion)
70 Central & South America Vanillic Acid Market, By Purity, 2020-2028 (USD Mllion)
71 Central & South America Vanillic Acid Market, By Application, 2020-2028 (USD Mllion)
72 Brazil Vanillic Acid Market, By Purity, 2020-2028 (USD Mllion)
73 Brazil Vanillic Acid Market, By Application, 2020-2028 (USD Mllion)
74 Chile Vanillic Acid Market, By Purity, 2020-2028 (USD Mllion)
75 Chile Vanillic Acid Market, By Application, 2020-2028 (USD Mllion)
76 Argentina Vanillic Acid Market, By Purity, 2020-2028 (USD Mllion)
77 Argentina Vanillic Acid Market, By Application, 2020-2028 (USD Mllion)
78 Rest Of Central & South America Vanillic Acid Market, By Purity, 2020-2028 (USD Mllion)
79 Rest Of Central & South America Vanillic Acid Market, By Application, 2020-2028 (USD Mllion)
80 Solvay: Products & Services Offering
81 Donglian Nankai FlavorDlflavor: Products & Services Offering
82 Quzhou Mingfeng Chemical: Products & Services Offering
83 The Good Scents Company: Products & Services Offering
84 Parchem Fine & Specialty Chemicals: Products & Services Offering
85 OTTO CHEMIE PVT. LTD.: Products & Services Offering
86 Advanced Biotech : Products & Services Offering
87 De Monchy Aromatics: Products & Services Offering
88 Borregaard, Inc: Products & Services Offering
89 Lanxess: Products & Services Offering
90 Other Companies: Products & Services Offering
LIST OF FIGURES
1 Global Vanillic Acid Market Overview
2 Global Vanillic Acid Market Value From 2020-2028 (USD Mllion)
3 Global Vanillic Acid Market Share, By Purity (2022)
4 Global Vanillic Acid Market Share, By Application (2022)
5 Global Vanillic Acid Market, By Region (Asia Pacific Market)
6 Technological Trends In Global Vanillic Acid Market
7 Four Quadrant Competitor Positioning Matrix
8 Impact Of Macro & Micro Indicators On The Market
9 Impact Of Key Drivers On The Global Vanillic Acid Market
10 Impact Of Challenges On The Global Vanillic Acid Market
11 Porter’s Five Forces Analysis
12 Global Vanillic Acid Market: By Purity Scope Key Takeaways
13 Global Vanillic Acid Market, By Purity Segment: Revenue Growth Analysis
14 Purity 99% Market, By Region, 2020-2028 (USD Mllion)
15 Purity 98% Market, By Region, 2020-2028 (USD Mllion)
16 Others Market, By Region, 2020-2028 (USD Mllion)
17 Global Vanillic Acid Market: By Application Scope Key Takeaways
18 Global Vanillic Acid Market, By Application Segment: Revenue Growth Analysis
19 Pharmaceutical Intermediates Market, By Region, 2020-2028 (USD Mllion)
20 Flavors and Fragrances Market, By Region, 2020-2028 (USD Mllion)
21 Other Applications Market, By Region, 2020-2028 (USD Mllion)
22 Regional Segment: Revenue Growth Analysis
23 Global Vanillic Acid Market: Regional Analysis
24 North America Vanillic Acid Market Overview
25 North America Vanillic Acid Market, By Purity
26 North America Vanillic Acid Market, By Application
27 North America Vanillic Acid Market, By Country
28 U.S. Vanillic Acid Market, By Purity
29 U.S. Vanillic Acid Market, By Application
30 Canada Vanillic Acid Market, By Purity
31 Canada Vanillic Acid Market, By Application
32 Mexico Vanillic Acid Market, By Purity
33 Mexico Vanillic Acid Market, By Application
34 Four Quadrant Positioning Matrix
35 Company Market Share Analysis
36 Solvay: Company Snapshot
37 Solvay: SWOT Analysis
38 Solvay: Geographic Presence
39 Donglian Nankai FlavorDlflavor: Company Snapshot
40 Donglian Nankai FlavorDlflavor: SWOT Analysis
41 Donglian Nankai FlavorDlflavor: Geographic Presence
42 Quzhou Mingfeng Chemical: Company Snapshot
43 Quzhou Mingfeng Chemical: SWOT Analysis
44 Quzhou Mingfeng Chemical: Geographic Presence
45 The Good Scents Company: Company Snapshot
46 The Good Scents Company: Swot Analysis
47 The Good Scents Company: Geographic Presence
48 Parchem Fine & Specialty Chemicals: Company Snapshot
49 Parchem Fine & Specialty Chemicals: SWOT Analysis
50 Parchem Fine & Specialty Chemicals: Geographic Presence
51 OTTO CHEMIE PVT. LTD.: Company Snapshot
52 OTTO CHEMIE PVT. LTD.: SWOT Analysis
53 OTTO CHEMIE PVT. LTD.: Geographic Presence
54 Advanced Biotech : Company Snapshot
55 Advanced Biotech : SWOT Analysis
56 Advanced Biotech : Geographic Presence
57 De Monchy Aromatics: Company Snapshot
58 De Monchy Aromatics: SWOT Analysis
59 De Monchy Aromatics: Geographic Presence
60 Borregaard, Inc.: Company Snapshot
61 Borregaard, Inc.: SWOT Analysis
62 Borregaard, Inc.: Geographic Presence
63 Lanxess: Company Snapshot
64 Lanxess: SWOT Analysis
65 Lanxess: Geographic Presence
66 Other Companies: Company Snapshot
67 Other Companies: SWOT Analysis
68 Other Companies: Geographic Presence
The Global Vanillic Acid Market has been studied from the year 2019 till 2028. However, the CAGR provided in the report is from the year 2023 to 2028. The research methodology involved three stages: Desk research, Primary research, and Analysis & Output from the entire research process.

The desk research involved a robust background study which meant referring to paid and unpaid databases to understand the market dynamics; mapping contracts from press releases; identifying the key players in the market, studying their product portfolio, competition level, annual reports/SEC filings & investor presentations; and learning the demand and supply-side analysis for the Vanillic Acid Market.

The primary research activity included telephonic conversations with more than 50 tier 1 industry consultants, distributors, and end-use product manufacturers.

Finally, based on the above thorough research process, an in-depth analysis was carried out considering the following aspects: market attractiveness, current & future market trends, market share analysis, SWOT analysis of the company and customer analytics.

Frequently Asked Questions

This FREE sample includes market data points, ranging from trend analyses to market estimates & forecasts. See for yourself.
Or view our licence options:
Tailor made solutions just for you
80% of our clients seek made-to-order reports. How do you want us to tailor yours?
OUR CLIENTS


