This report was recently updated on August 14 2025 with the latest and most recent
market numbers
Global Virtual Advertising Market Size, Trends & Analysis - Forecasts to 2028 By Format Type (Social Media, Search Engine, Video, Email, Other Formats), Platform Type (Mobile, Desktop/Laptop), End-User Type (Automotive, Retail, Healthcare, BFSI, Telecom, Other End-Users), Region (North America, Asia Pacific, Central & South America, Europe, Middle East and Africa), Competitive Landscape, Company Market Share Analysis, and Competitor Analysis
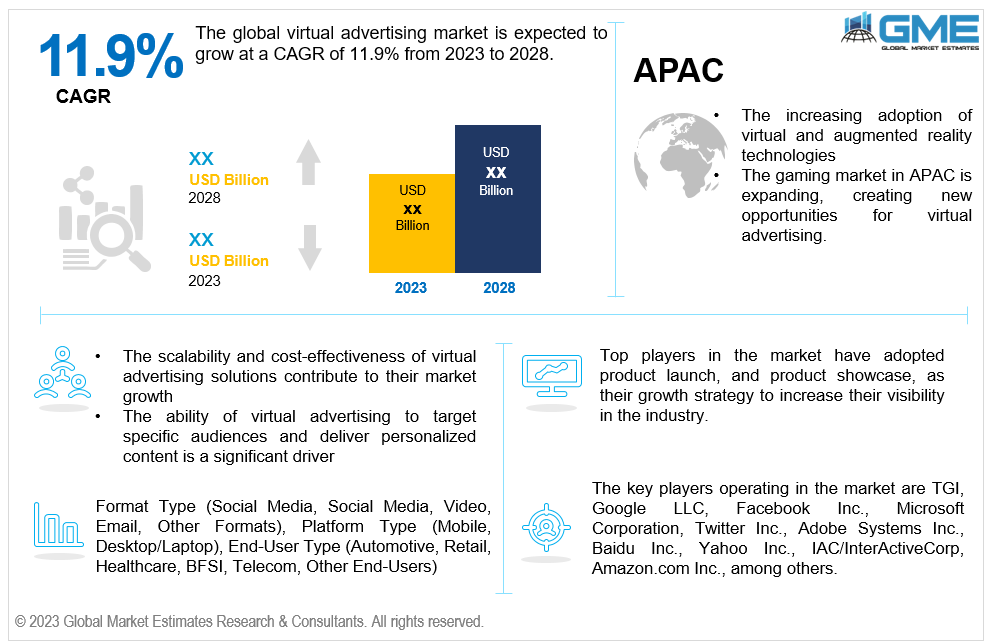
The global virtual advertising market is expected to grow at a CAGR of 11.9% from 2023 to 2028. Virtual advertising refers to the practice of digitally inserting or overlaying advertisements into virtual or augmented reality environments, virtual screens, or live-streamed content. It involves integrating branded content, product placements, or promotional messages seamlessly into virtual experiences, creating an immersive and interactive advertising platform. Virtual advertising leverages the capabilities of virtual and augmented reality technologies to deliver targeted and engaging advertisements to consumers. By blending digital content with the virtual environment, virtual advertising provides new opportunities for brands to reach their target audience and enhance the user experience in virtual and augmented reality settings.
The virtual advertising market is driven by several key factors that contribute to its growth and significance in the advertising industry. Firstly, the increasing adoption of virtual and augmented reality technologies plays a vital role. As more consumers embrace virtual and augmented reality experiences, there is a growing demand for immersive and interactive advertising solutions within these environments.
Virtual advertising enables brands to engage with users in a more personalized and engaging manner, leveraging the immersive nature of virtual reality to create memorable and impactful advertising experiences. Furthermore, the ability of virtual advertising to target specific audiences and deliver personalized content is a significant driver. Virtual advertising platforms can collect data on user behavior, preferences, and demographics, allowing advertisers to tailor their messages and offerings accordingly. This targeted approach enhances the relevance and effectiveness of advertisements, increasing the likelihood of consumer engagement and conversion.
Advertisers can also leverage the interactivity of virtual advertising to provide interactive product demonstrations or virtual try-on experiences, further enhancing consumer engagement and driving sales. Moreover, the scalability and cost-effectiveness of virtual advertising solutions contribute to their market growth. Virtual advertising eliminates the need for physical ad placements, such as billboards or printed materials, reducing production and distribution costs. Advertisers can create and modify virtual advertisements more easily, enabling quick deployment and adaptability to changing marketing needs. Moreover, virtual advertising allows for real-time tracking and measurement of advertising performance, providing valuable insights and data for campaign optimization.
Overall, the increasing adoption of virtual and augmented reality technologies, the ability to target specific audiences, and the scalability and cost-effectiveness of virtual advertising solutions are key drivers propelling the growth of the virtual advertising market. As brands seek innovative ways to engage with consumers and deliver personalized experiences, virtual advertising offers a compelling solution that combines immersive technology with effective advertising strategies.
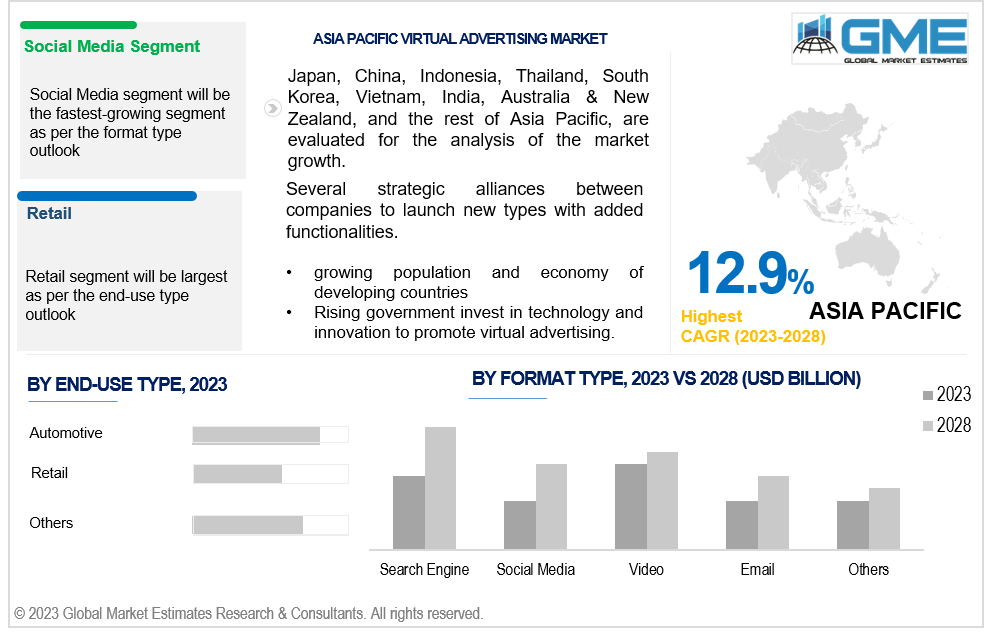
Based on format type, the market is segmented into social media, search engine, video, email and other formats. The social media segment will be the largest segment during the forecast period. Social media platforms such as Facebook, Instagram, and Snapchat boast extensive user bases, targeted advertising capabilities, native advertising formats, and a continuously growing adoption rate. These factors make them highly appealing to advertisers aiming to reach a broad audience.
Based on platform type, the market is segmented into mobile and desktop/laptop. The mobile segment will be the largest segment during the forecast period. Mobile devices have emerged as a favored platform for virtual advertising due to their convenience, immersive experiences, personalized features, and user-friendly interfaces. Given their widespread use for entertainment and gaming purposes, mobile devices facilitate higher engagement rates, resulting in more effective advertising campaigns.
Based on end-user type, the market is segmented into automotive, retail, healthcare, BFSI, telecom, other end-user. The passenger aircraft segment will be the largest segment during the forecast period.
Due to its substantial customer base, demand for personalized and immersive experiences, rapid growth of e-commerce, intense competition, and increasing adoption of digital technologies, the retail sector presents an enticing opportunity for virtual advertising campaigns. Virtual advertising enables retailers to distinguish themselves and make a memorable impact in a highly competitive market, while also offering accessibility and ease of implementation.
The North American region is analyzed to be the largest segment in the global virtual advertising market during the forecast period. North America hosts numerous prominent technology companies, including Microsoft, Apple, and Google, which have played a pivotal role in advancing virtual and augmented reality technologies. This technological leadership has been instrumental in propelling the growth of the virtual advertising market in the region.
North American consumers have demonstrated early adoption tendencies towards virtual and augmented reality technologies, resulting in a sizable and expanding market for virtual advertising experiences. With one of the world's largest advertising markets, North America generates substantial demand for innovative advertising formats such as virtual advertising. The sports and entertainment sectors are particularly influential drivers in the virtual advertising market, as in-game advertising and virtual product placement have emerged as popular means for advertisers to engage with audiences. The early embrace of virtual events and conferences has also opened up new avenues for virtual advertising to thrive.
Asia Pacific is also analyzed to be the fastest growing segment across the global virtual advertising market with a CAGR. The APAC region boasts a substantial and swiftly expanding population, characterized by a rapid adoption of new technologies. This phenomenon has led to the emergence of a significant and growing audience for virtual advertising campaigns within the region. With a rising middle class and increasing purchasing power, the APAC region presents favorable prospects for advertisers to promote their products and services through immersive virtual advertising experiences.
Furthermore, the thriving gaming market in the region opens up new avenues for in-game advertising and other forms of virtual advertising to reach a large and engaged audience. Notably, government support for technology and innovation further enhances the development and implementation of virtual advertising technologies and applications in the APAC region.
The key players operating in the market are TGI, Google LLC, Facebook Inc., Microsoft Corporation, Twitter Inc., Adobe Systems Inc., Baidu Inc., Yahoo Inc., IAC/InterActiveCorp, and Amazon.com Inc., among others.
Please note: This is not an exhaustive list of companies profiled in the report.
1 STRATEGIC INSIGHTS ON NEW REVENUE POCKETS
1.1 Strategic Opportunity & Attractiveness Analysis
1.1.1 Hot Revenue Pockets
1.1.2 Market Attractiveness Score
1.1.3 Revenue Impacting Opportunity
1.1.4 High Growing Region/Country
1.1.5 Competitor Analysis
1.1.6 Consumer Analysis
1.2 Global Market Estimates' View
1.3 Strategic Insights across Business Functions
1.3.1 For Chief Executive Officers
1.3.2 For Chief Marketing Officers
1.3.3 For Chief Strategy Officers
1.4 Evaluate the Potential of your Existing Business Lines vs. New Lines to Enter Into
2.1 Technological Adoption Rate
2.2 Current Trend Impact Analysis
2.3 Future Trend Impact Analysis
2.4 Data Metrics on Feed Stocks
3.1.2 Adjacent Market Opportunities
3.1.3 Ancillary Market Opportunities
3.2.1 Market Drivers: Impact Analysis
3.2.2 Market Restraints: Impact Analysis
3.2.3 Market Opportunities: Impact Analysis
3.2.4 Market Challenges: Impact Analysis
3.3.1 Porter’s Five Forces Analysis
3.3.1.1 Threat of New Entrants
3.3.1.2 Threat of New Substitutes
3.3.1.3 Bargaining Power of Suppliers
3.3.1.4 Bargaining Power of Buyers
3.3.1.5 Intensity of Competitive Rivalry
3.3.2 SWOT Analysis; By Factor (Political & Legal, Economic, and Technological)
4 GLOBAL VIRTUAL ADVERTISING MARKET, BY FORMAT TYPE
4.2 Virtual Advertising Market: Format Type Scope Key Takeaways
4.3 Revenue Growth Analysis, 2022 & 2028
4.4.1 Social Media Market Estimates and Forecast, 2020-2028 (USD Million)
4.5.1 Search Engines Market Estimates and Forecast, 2020-2028 (USD Million)
4.6.1 Videos Market Estimates and Forecast, 2020-2028 (USD Million)
4.7.1 Email Market Estimates and Forecast, 2020-2028 (USD Million)
4.8.1 Other Formats Market Estimates and Forecast, 2020-2028 (USD Million)
5 GLOBAL VIRTUAL ADVERTISING MARKET, BY PLATFORM TYPE
5.2 Virtual Advertising Market: Platform Type Scope Key Takeaways
5.3 Revenue Growth Analysis, 2022 & 2028
5.4.1 Mobile Market Estimates and Forecast, 2020-2028 (USD Million)
5.5.1 Desktop/Laptop Market Estimates and Forecast, 2020-2028 (USD Million)
6 GLOBAL VIRTUAL ADVERTISING MARKET, BY END-USE TYPE
6.2 Virtual Advertising Market: End-Use Type Scope Key Takeaways
6.3 Revenue Growth Analysis, 2022 & 2028
6.4.1 Automotive Market Estimates and Forecast, 2020-2028 (USD Million)
6.5.1 Retail Market Estimates and Forecast, 2020-2028 (USD Million)
6.6 Business, Financial Services & Insurance (BFSI)
6.7.1 IT & Telecom Market Estimates and Forecast, 2020-2028 (USD Million)
6.8.1 Other Users Market Estimates and Forecast, 2020-2028 (USD Million)
7 GLOBAL VIRTUAL ADVERTISING MARKET, BY REGION
7.2 North America Virtual Advertising Market Estimates and Forecast, 2020-2028 (USD Million)
7.2.4.1 U.S. Virtual Advertising Market Estimates and Forecast, 2020-2028 (USD Million)
7.2.4.2 Canada Virtual Advertising Market Estimates and Forecast, 2020-2028 (USD Million)
7.2.4.3 Mexico Virtual Advertising Market Estimates and Forecast, 2020-2028 (USD Million)
7.3 Europe Virtual Advertising Market Estimates and Forecast, 2020-2028 (USD Million)
7.3.4.1 Germany Virtual Advertising Market Estimates and Forecast, 2020-2028 (USD Million)
7.3.4.2 U.K. Virtual Advertising Market Estimates and Forecast, 2020-2028 (USD Million)
7.3.4.3 France Virtual Advertising Market Estimates and Forecast, 2020-2028 (USD Million)
7.3.4.4 Italy Virtual Advertising Market Estimates and Forecast, 2020-2028 (USD Million)
7.3.4.5 Spain Virtual Advertising Market Estimates and Forecast, 2020-2028 (USD Million)
7.3.4.6 Netherlands Virtual Advertising Market Estimates and Forecast, 2020-2028 (USD Million)
7.3.4.7 Rest of Europe Virtual Advertising Market Estimates and Forecast, 2020-2028 (USD Million)
7.4 Asia Pacific Virtual Advertising Market Estimates and Forecast, 2020-2028 (USD Million)
7.4.4.1 China Virtual Advertising Market Estimates and Forecast, 2020-2028 (USD Million)
7.4.4.2 Japan Virtual Advertising Market Estimates and Forecast, 2020-2028 (USD Million)
7.4.4.3 India Virtual Advertising Market Estimates and Forecast, 2020-2028 (USD Million)
7.4.4.4 South Korea Virtual Advertising Market Estimates and Forecast, 2020-2028 (USD Million)
7.4.4.5 Singapore Virtual Advertising Market Estimates and Forecast, 2020-2028 (USD Million)
7.4.4.6 Malaysia Virtual Advertising Market Estimates and Forecast, 2020-2028 (USD Million)
7.4.4.7 Thailand Virtual Advertising Market Estimates and Forecast, 2020-2028 (USD Million)
7.4.4.8 Indonesia Virtual Advertising Market Estimates and Forecast, 2020-2028 (USD Million)
7.4.4.9 Vietnam Virtual Advertising Market Estimates and Forecast, 2020-2028 (USD Million)
7.4.4.10 Taiwan Virtual Advertising Market Estimates and Forecast, 2020-2028 (USD Million)
7.5 Middle East & Africa Virtual Advertising Market Estimates and Forecast, 2020-2028 (USD Million)
7.5.4.1 Saudi Arabia Virtual Advertising Market Estimates and Forecast, 2020-2028 (USD Million)
7.5.4.2 U.A.E. Virtual Advertising Market Estimates and Forecast, 2020-2028 (USD Million)
7.5.4.3 Israel Virtual Advertising Market Estimates and Forecast, 2020-2028 (USD Million)
7.5.4.4 South Africa Virtual Advertising Market Estimates and Forecast, 2020-2028 (USD Million)
7.7.4.1 Brazil Virtual Advertising Market Estimates and Forecast, 2020-2028 (USD Million)
7.7.4.2 Argentina Virtual Advertising Market Estimates and Forecast, 2020-2028 (USD Million)
7.7.4.3 Chile Virtual Advertising Market Estimates and Forecast, 2020-2028 (USD Million)
8.1 Company Market Share Analysis
8.2 Four Quadrant Positioning Matrix
8.4.1.1 Business Description & Financial Analysis
8.4.1.3 Products & Services Offered
8.4.1.4 Strategic Alliances between Business Partners
8.4.2.1 Business Description & Financial Analysis
8.4.2.3 Products & Services Offered
8.4.2.4 Strategic Alliances between Business Partners
8.4.3.1 Business Description & Financial Analysis
8.4.3.3 Products & Services Offered
8.4.3.4 Strategic Alliances between Business Partners
8.4.4.1 Business Description & Financial Analysis
8.4.4.3 Products & Services Offered
8.4.4.4 Strategic Alliances between Business Partners
8.4.5.1 Business Description & Financial Analysis
8.4.5.3 Products & Services Offered
8.4.5.4 Strategic Alliances between Business Partners
8.4.7.1 Business Description & Financial Analysis
8.4.7.3 Products & Services Offered
8.4.7.4 Strategic Alliances between Business Partners
8.4.7.1 Business Description & Financial Analysis
8.4.7.3 Products & Services Offered
8.4.8.4 Strategic Alliances between Business Partners
8.4.8.1 Business Description & Financial Analysis
8.4.8.3 Products & Services Offered
8.4.8.4 Strategic Alliances between Business Partners
8.4.9 Inter Active Corp. (IAC)
8.4.9.1 Business Description & Financial Analysis
8.4.9.3 Products & Services Offered
8.4.9.4 Strategic Alliances between Business Partners
8.4.10.1 Business Description & Financial Analysis
8.4.10.3 Products & Services Offered
8.4.10.4 Strategic Alliances between Business Partners
9.1.2 Market Scope & Segmentation
9.2.1.2 GMEs Internal Data Repository
9.2.1.3 Secondary Resources & Third Party Perspectives
9.2.1.4 Company Information Sources
9.2.2.1 Various Platform Type of Respondents for Primary Interviews
9.2.2.2 Number of Interviews Conducted throughout the Research Process
9.2.2.4 Discussion Guide for Primary Participants
9.2.3.1 Expert Panels Across 30+ Industry
9.2.4.1 Paid Local Experts Across 30+ Industry Across each Region
9.3.1.1 Macro-Economic Indicators Considered
9.3.1.2 Micro-Economic Indicators Considered
9.3.2.1 Company Share Analysis Approach
9.3.2.2 Estimation of Potential Product Sales
9.4.2 Time Series, Cross Sectional & Panel Data Analysis
9.5.1 Inhouse AI Based Real Time Analytics Tool
9.5.2 Output From Desk & Primary Research
9.6 Research Assumptions & Limitations
LIST OF TABLES
1 Global Virtual Advertising Market, By Format Type, 2020-2028 (USD Mllion)
2 Social Media Market, By Region, 2020-2028 (USD Mllion)
3 Search Engines Market, By Region, 2020-2028 (USD Mllion)
4 Videos Market, By Region, 2020-2028 (USD Mllion)
5 Email Market, By Region, 2020-2028 (USD Mllion)
6 Other Formats Market, By Region, 2020-2028 (USD Mllion)
7 Global Virtual Advertising Market, By Platform Type, 2020-2028 (USD Mllion)
8 Mobile Market, By Region, 2020-2028 (USD Mllion)
9 Desktop/Laptop Market, By Region, 2020-2028 (USD Mllion)
10 Global Virtual Advertising Market, By End-Use Type, 2020-2028 (USD Mllion)
11 Automotive Market, By Region, 2020-2028 (USD Mllion)
12 Retail Market, By Region, 2020-2028 (USD Mllion)
13 Business, Financial Services & Insurance (BFSI) Market, By Region, 2020-2028 (USD Mllion)
14 IT & Telecom Market, By Region, 2020-2028 (USD Mllion)
15 Other Users Market, By Region, 2020-2028 (USD Mllion)
16 Regional Analysis, 2020-2028 (USD Mllion)
17 North America Virtual Advertising Market, By Format Type, 2020-2028 (USD Million)
18 North America Virtual Advertising Market, By Platform Type, 2020-2028 (USD Million)
19 North America Virtual Advertising Market, By End-Use Type, 2020-2028 (USD Million)
20 North America Virtual Advertising Market, By Country, 2020-2028 (USD Million)
21 U.S Virtual Advertising Market, By Format Type, 2020-2028 (USD Million)
22 U.S Virtual Advertising Market, By Platform Type, 2020-2028 (USD Million)
23 U.S Virtual Advertising Market, By End-Use Type, 2020-2028 (USD Million)
24 Canada Virtual Advertising Market, By Format Type, 2020-2028 (USD Million)
25 Canada Virtual Advertising Market, By Platform Type, 2020-2028 (USD Million)
26 Canada Virtual Advertising Market, By End-Use Type, 2020-2028 (USD Million)
27 Mexico Virtual Advertising Market, By Format Type, 2020-2028 (USD Million)
28 Mexico Virtual Advertising Market, By Platform Type, 2020-2028 (USD Million)
29 Mexico Virtual Advertising Market, By End-Use Type, 2020-2028 (USD Million)
30 Europe Virtual Advertising Market, By Format Type, 2020-2028 (USD Million)
31 Europe Virtual Advertising Market, By Platform Type, 2020-2028 (USD Million)
32 Europe Virtual Advertising Market, By End-Use Type, 2020-2028 (USD Million)
33 Germany Virtual Advertising Market, By Format Type, 2020-2028 (USD Million)
34 Germany Virtual Advertising Market, By Platform Type, 2020-2028 (USD Million)
35 Germany Virtual Advertising Market, By End-Use Type, 2020-2028 (USD Million)
36 UK Virtual Advertising Market, By Format Type, 2020-2028 (USD Million)
37 UK Virtual Advertising Market, By Platform Type, 2020-2028 (USD Million)
38 UK Virtual Advertising Market, By End-Use Type, 2020-2028 (USD Million)
39 France Virtual Advertising Market, By Format Type, 2020-2028 (USD Million)
40 France Virtual Advertising Market, By Platform Type, 2020-2028 (USD Million)
41 France Virtual Advertising Market, By End-Use Type, 2020-2028 (USD Million)
42 Italy Virtual Advertising Market, By Format Type, 2020-2028 (USD Million)
43 Italy Virtual Advertising Market, By T Platform Type Type, 2020-2028 (USD Million)
44 Italy Virtual Advertising Market, By End-Use Type, 2020-2028 (USD Million)
45 Spain Virtual Advertising Market, By Format Type, 2020-2028 (USD Million)
46 Spain Virtual Advertising Market, By Platform Type, 2020-2028 (USD Million)
47 Spain Virtual Advertising Market, By End-Use Type, 2020-2028 (USD Million)
48 Rest Of Europe Virtual Advertising Market, By Format Type, 2020-2028 (USD Million)
49 Rest Of Europe Virtual Advertising Market, By Platform Type, 2020-2028 (USD Million)
50 Rest of Europe Virtual Advertising Market, By End-Use Type, 2020-2028 (USD Million)
51 Asia Pacific Virtual Advertising Market, By Format Type, 2020-2028 (USD Million)
52 Asia Pacific Virtual Advertising Market, By Platform Type, 2020-2028 (USD Million)
53 Asia Pacific Virtual Advertising Market, By End-Use Type, 2020-2028 (USD Million)
54 Asia Pacific Virtual Advertising Market, By Country, 2020-2028 (USD Million)
55 China Virtual Advertising Market, By Format Type, 2020-2028 (USD Million)
56 China Virtual Advertising Market, By Platform Type, 2020-2028 (USD Million)
57 China Virtual Advertising Market, By End-Use Type, 2020-2028 (USD Million)
58 India Virtual Advertising Market, By Format Type, 2020-2028 (USD Million)
59 India Virtual Advertising Market, By Platform Type, 2020-2028 (USD Million)
60 India Virtual Advertising Market, By End-Use Type, 2020-2028 (USD Million)
61 Japan Virtual Advertising Market, By Format Type, 2020-2028 (USD Million)
62 Japan Virtual Advertising Market, By Platform Type, 2020-2028 (USD Million)
63 Japan Virtual Advertising Market, By End-Use Type, 2020-2028 (USD Million)
64 South Korea Virtual Advertising Market, By Format Type, 2020-2028 (USD Million)
65 South Korea Virtual Advertising Market, By Platform Type, 2020-2028 (USD Million)
66 South Korea Virtual Advertising Market, By End-Use Type, 2020-2028 (USD Million)
67 Middle East & Africa Virtual Advertising Market, By Format Type, 2020-2028 (USD Million)
68 Middle East & Africa Virtual Advertising Market, By Platform Type, 2020-2028 (USD Million)
69 Middle East & Africa Virtual Advertising Market, By End-Use Type, 2020-2028 (USD Million)
70 Middle East & Africa Virtual Advertising Market, By Country, 2020-2028 (USD Million)
71 Saudi Arabia Virtual Advertising Market, By Format Type, 2020-2028 (USD Million)
72 Saudi Arabia Virtual Advertising Market, By Platform Type, 2020-2028 (USD Million)
73 Saudi Arabia Virtual Advertising Market, By End-Use Type, 2020-2028 (USD Million)
74 UAE Virtual Advertising Market, By Format Type, 2020-2028 (USD Million)
75 UAE Virtual Advertising Market, By Platform Type, 2020-2028 (USD Million)
76 UAE Virtual Advertising Market, By End-Use Type, 2020-2028 (USD Million)
77 Central & South America Virtual Advertising Market, By Format Type, 2020-2028 (USD Million)
78 Central & South America Virtual Advertising Market, By Platform Type, 2020-2028 (USD Million)
79 Central & South America Virtual Advertising Market, By End-Use Type, 2020-2028 (USD Million)
80 Central & South America Virtual Advertising Market, By Country, 2020-2028 (USD Million)
81 Brazil Virtual Advertising Market, By Format Type, 2020-2028 (USD Million)
82 Brazil Virtual Advertising Market, By Platform Type, 2020-2028 (USD Million)
83 Brazil Virtual Advertising Market, By End-Use Type, 2020-2028 (USD Million)
84 Amazon.com Inc.: Products & Services Offering
85 Facebook: Products & Services Offering
86 Google LLC: Products & Services Offering
87 Microsoft Corp.: Products & Services Offering
88 Baidu: Products & Services Offering
89 YAHOO: Products & Services Offering
90 Twitter : Products & Services Offering
91 Adobe: Products & Services Offering
92 Inter Active Corp. (IAC), Inc: Products & Services Offering
93 Other Companies: Products & Services Offering
LIST OF FIGURES
1 Global Virtual Advertising Market Overview
2 Global Virtual Advertising Market Value From 2020-2028 (USD Mllion)
3 Global Virtual Advertising Market Share, By Format Type (2022)
4 Global Virtual Advertising Market Share, By Platform Type (2022)
5 Global Virtual Advertising Market Share, By End-Use Type (2022)
6 Global Virtual Advertising Market, By Region (Asia Pacific Market)
7 Technological Trends In Global Virtual Advertising Market
8 Four Quadrant Competitor Positioning Matrix
9 Impact Of Macro & Micro Indicators On The Market
10 Impact Of Key Drivers On The Global Virtual Advertising Market
11 Impact Of Challenges On The Global Virtual Advertising Market
12 Porter’s Five Forces Analysis
13 Global Virtual Advertising Market: By Format Type Scope Key Takeaways
14 Global Virtual Advertising Market, By Format Type Segment: Revenue Growth Analysis
15 Social Media Market, By Region, 2020-2028 (USD Mllion)
16 Search Engines Market, By Region, 2020-2028 (USD Mllion)
17 Videos Market, By Region, 2020-2028 (USD Mllion)
18 Email Market, By Region, 2020-2028 (USD Mllion)
19 Other Formats Market, By Region, 2020-2028 (USD Mllion)
20 Global Virtual Advertising Market: By Platform Type Scope Key Takeaways
21 Global Virtual Advertising Market, By Platform Type Segment: Revenue Growth Analysis
22 Mobile Market, By Region, 2020-2028 (USD Mllion)
23 Desktop/Laptop Market, By Region, 2020-2028 (USD Mllion)
24 Global Virtual Advertising Market: By End-Use Type Scope Key Takeaways
25 Global Virtual Advertising Market, By End-Use Type Segment: Revenue Growth Analysis
26 Automotive Market, By Region, 2020-2028 (USD Mllion)
27 Retail Market, By Region, 2020-2028 (USD Mllion)
28 Business, Financial Services & Insurance (BFSI) Market, By Region, 2020-2028 (USD Mllion)
29 IT & Telecom Market, By Region, 2020-2028 (USD Mllion)
30 Other Users Market, By Region, 2020-2028 (USD Mllion)
31 Regional Segment: Revenue Growth Analysis
32 Global Virtual Advertising Market: Regional Analysis
33 North America Virtual Advertising Market Overview
34 North America Virtual Advertising Market, By Format Type
35 North America Virtual Advertising Market, By Platform Type
36 North America Virtual Advertising Market, By End-Use Type
37 North America Virtual Advertising Market, By Country
38 U.S. Virtual Advertising Market, By Format Type
39 U.S. Virtual Advertising Market, By Platform Type
40 U.S. Virtual Advertising Market, By End-Use Type
41 Canada Virtual Advertising Market, By Format Type
42 Canada Virtual Advertising Market, By Platform Type
43 Canada Virtual Advertising Market, By End-Use Type
44 Mexico Virtual Advertising Market, By Format Type
45 Mexico Virtual Advertising Market, By Platform Type
46 Mexico Virtual Advertising Market, By End-Use Type
47 Four Quadrant Positioning Matrix
48 Company Market Share Analysis
49 Amazon.com Inc.: Company Snapshot
50 Amazon.com Inc.: SWOT Analysis
51 Amazon.com Inc.: Geographic Presence
52 Facebook: Company Snapshot
53 Facebook: SWOT Analysis
54 Facebook: Geographic Presence
55 Google LLC: Company Snapshot
56 Google LLC: SWOT Analysis
57 Google LLC: Geographic Presence
58 Microsoft Corp.: Company Snapshot
59 Microsoft Corp.: Swot Analysis
60 Microsoft Corp.: Geographic Presence
61 Baidu: Company Snapshot
62 Baidu: SWOT Analysis
63 Baidu: Geographic Presence
64 Yahoo: Company Snapshot
65 Yahoo: SWOT Analysis
66 Yahoo: Geographic Presence
67 Twitter : Company Snapshot
68 Twitter : SWOT Analysis
69 Twitter : Geographic Presence
70 Adobe: Company Snapshot
71 Adobe: SWOT Analysis
72 Adobe: Geographic Presence
73 Inter Active Corp. (IAC), Inc.: Company Snapshot
74 Inter Active Corp. (IAC), Inc.: SWOT Analysis
75 Inter Active Corp. (IAC), Inc.: Geographic Presence
76 Other Companies: Company Snapshot
77 Other Companies: SWOT Analysis
78 Other Companies: Geographic Presence
The Global Virtual Advertising Market has been studied from the year 2019 till 2028. However, the CAGR provided in the report is from the year 2023 to 2028. The research methodology involved three stages: Desk research, Primary research, and Analysis & Output from the entire research process.

The desk research involved a robust background study which meant referring to paid and unpaid databases to understand the market dynamics; mapping contracts from press releases; identifying the key players in the market, studying their product portfolio, competition level, annual reports/SEC filings & investor presentations; and learning the demand and supply-side analysis for the Virtual Advertising Market.

The primary research activity included telephonic conversations with more than 50 tier 1 industry consultants, distributors, and end-use product manufacturers.

Finally, based on the above thorough research process, an in-depth analysis was carried out considering the following aspects: market attractiveness, current & future market trends, market share analysis, SWOT analysis of the company and customer analytics.

Frequently Asked Questions

This FREE sample includes market data points, ranging from trend analyses to market estimates & forecasts. See for yourself.
Or view our licence options:
Tailor made solutions just for you
80% of our clients seek made-to-order reports. How do you want us to tailor yours?
OUR CLIENTS


