This report was recently updated on August 9 2025 with the latest and most recent
market numbers
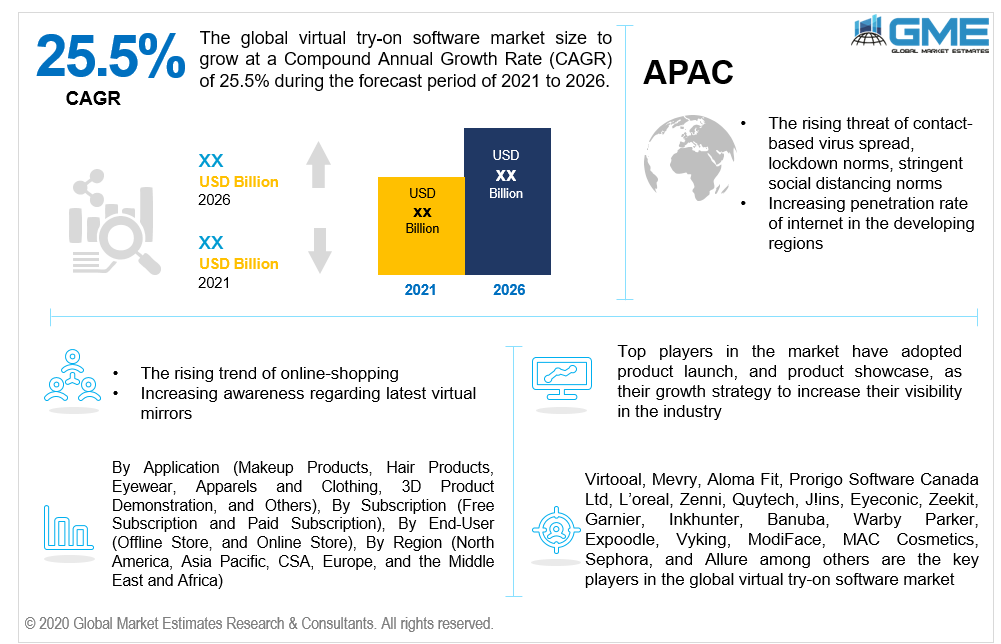
Global Virtual Try-On Software Market Size, Trends & Analysis - Forecasts to 2026 By Application (Makeup Products, Hair Products, Eyewear, Apparels and Clothing, 3D Product Demonstration, and Others), By Subscription (Free Subscription and Paid Subscription), By End-User (Offline Store, and Online Store), By Region (North America, Asia Pacific, CSA, Europe, and the Middle East and Africa), Company Market Share Analysis, and Competitor Analysis
The global virtual try-on software market is projected to grow at a CAGR value of 25.5% from 2021 to 2026.
The software of Virtual try-on works on the technology that helps users to try on products using mobile/ laptop based cameras. Products can include, apparels, clothes, cosmetics, jewellery, eyewear etc. The technology is based on Augmented Reality where users can contextually visualize the product they are trying on and are interested in, which in turn leads to a successful purchase. Such softwares’ have become crucial for top cosmetic and apparel companies, as they have helped in accelerating the company revenue especially during the pandemic. Top players from the cosmetic and clothing industry have started to adopt organic strategies such as partnership, product launch and product development showcase.
The threat of contact-based virus spread, lockdown norms, stringent social distancing norms have given rise to the adoption of virtual try-on software in the market. Moreover, the rising trend of online-shopping, increasing penetration rate of internet in the developing regions, increasing awareness regarding latest virtual mirrors, and launch of advanced software in this field are some of the prime driving forces of the market.
Considering safety and hygiene, beauty retailers such as Sephora and Ulta discontinued the physical product testing services, and Ulta introduced GLAMlab beauty tools to virtually try-on cosmetics. The demand for the product has surged since the outbreak of the coronavirus, and the company was able to sell over 50 million shades of the foundation during COVID-19. Moreover, in 2016, Sephora launched a virtual mirror to allow users to try on different shades of lipsticks, and eye shadow. The users face appears in real-time using the front facing camera with different colour palettes available to choose from.
The augment of COVID-19 pandemic has had a detrimental influence on the adoption of virtual try-on software in the initial phase of 2020, affecting the market in a positive way. The pandemic has had an impact on every aspect of cosmetic and apparel industry, with virtual-try on software to be classed as the most trending software across the globe.
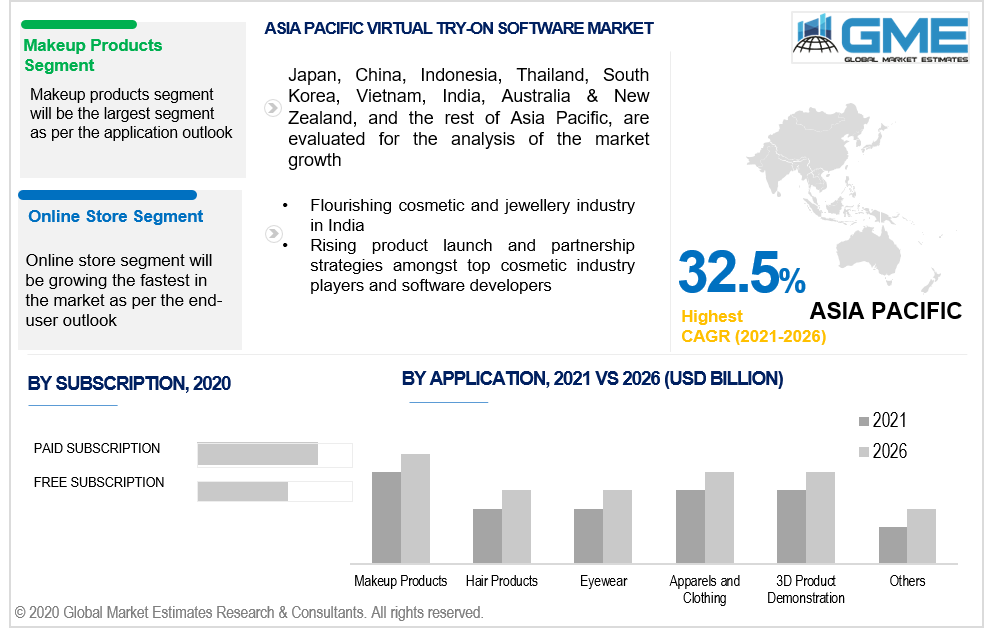
Based on the application, the market is segmented into makeup products, hair products, eyewear, apparels and clothing, 3D product demonstration, and others. The makeup products segment is predicted to have the largest share in the market during the forecast period. The cosmetic/ makeup industry was able to accelerate its revenue/ business during the pandemic era and high adoption of virtual try-on software for lipsticks, eye shadows, makeup products and other beauty products. The rising trend of online shopping for cosmetic products, and increasing demand for try first session for online users are some of the drivers supporting the dominance of the segment in the market.
Based on the type, the market is segmented free subscription and paid subscription. The free subscription segment is anticipated to be the fastest growing segment in the market during the forecast period whereas the paid subscription currently is the largest shareholder in the market. The dominance of paid software is due to the increasing launch of top try-on software in developed markets, rising need for product validation, and increasing number of growth strategies amongst top cosmetic players.
Based on the end-user, the market is segmented into offline store, and online store. During the forecast period, the market for online store segment is expected to have the largest share. The virtual try-on software for online store has helped most of the giant cosmetic players to cope up with the revenue losses during the initial phase of COVID-19 pandemic. Due to stringent norms related to lockdown, contactless activities, and social distancing, most of the brands or companies have completely shifted their priorities from offline stores to online stores.
As per the geographical analysis, the virtual try-on software market can be classified into North America (the United States, Canada, and Mexico), Asia Pacific (India, China, Japan, Malaysia, Singapore, and the Rest of Asia Pacific), Europe (Germany, United Kingdom, Italy, France, Spain, Netherlands, and Rest of Europe), Middle East & Africa (Saudi Arabia, United Arab Emirates, and Rest of the Middle East & Africa) and Central & South America (Brazil, Argentina, and Rest of Central and South America).
North America (the United States, Canada, and Mexico), will have a dominant share in the virtual try-on software market from 2021 to 2026. Rising trend of online shopping, increasing customer awareness regarding latest advanced virtual technologies for eye wears, apparels and product description, and rising product launch and partnership strategies amongst top cosmetic industry players and software developers have helped North American region capture the largest share in the market.
Moreover, the Asia Pacific (India, China, Japan, Malaysia, Singapore, and the Rest of Asia Pacific), region is expected to be the fastest-growing segment in the global virtual try-on software market during the forecast period. Rising penetration rate of internet and smart phones in the Asia Pacific region, flourishing cosmetic and jewellery industry in India, and untapped Asian regional markets are all contributing to the high growth rate of Asia Pacific region.
Virtooal, Mevry, Aloma Fit, Prorigo Software Canada Ltd, L’oreal, Zenni, Quytech, J!ins, Eyeconic, Zeekit, Garnier, Inkhunter, Banuba, Warby Parker, Expoodle, Vyking, ModiFace, MAC Cosmetics, Sephora, and Allure among others are the key players in the global virtual try-on software market.
Please note: This is not an exhaustive list of companies profiled in the report.
In December 2021, Nykaa launched AI-powered virtual try-on software namely ModiFace for cosmetic try-on activity.
In December 2021, Perfect Corp.’s AI and AR-powered Virtual Try-On software bagged the the International Brilliance Awards. The software was designed for eye wears and sunglasses.
Chapter 1 Methodology
1.1 Market Scope & Definitions
1.2 Estimates & Forecast Calculation
1.3 Historical Data Overview and Validation
1.4 Data Sources
1.4.1 Secondary
1.4.2 Primary
Chapter 2 Report Outlook
2.1 Virtual Try-On Software Industry Overview, 2021-2026
2.1.1 Industry Overview
2.1.2 End-User Overview
2.1.3 Subscription Overview
2.1.4 Application Overview
2.1.6 Regional Overview
Chapter 3 Virtual Try-On Software Market Trends
3.1 Market Segmentation
3.2 Industry Background, 2021-2026
3.3 Market Key Trends
3.3.1 Positive Trends
3.3.1.1 The threat of contact-based virus spread, lockdown norms, stringent social distancing norms have given rise to the adoption of virtual try-on software
3.3.2 Challenges
3.3.2.1 The accessibility of indemnification schemes in poorer nations
3.4 Prospective Growth Scenario
3.4.1 End-User Growth Scenario
3.4.2 Subscription Growth Scenario
3.4.3 Application Growth Scenario
3.5 COVID-19 Influence over Market Growth
3.6 Porter’s Analysis
3.7 PESTEL Analysis
3.8 Value Chain & Supply Chain Analysis
3.9 Regulatory Framework
3.9.1 North America
3.9.2 Europe
3.9.3 APAC
3.9.4 LATAM
3.9.5 MEA
3.10 End-User Overview
3.11 Market Share Analysis, 2020
3.11.1 Company Positioning Overview, 2020
Chapter 4 Virtual Try-On Software Market, By End-User
4.1 End-User Outlook
4.2 Offline Stores
4.2.1 Market Size, By Region, 2021-2026 (USD Billion)
4.3 Online Stores
4.3.1 Market Size, By Region, 2021-2026 (USD Billion)
Chapter 5 Virtual Try-On Software Market, By Subscription
5.1 Subscription Outlook
5.2 Paid
5.2.1 Market Size, By Region, 2021-2026 (USD Billion)
5.3 Free
5.3.1 Market Size, By Region, 2021-2026 (USD Billion)
Chapter 6 Virtual Try-On Software Market, By Application
6.1 Makeup Products
6.1.1 Market Size, By Region, 2021-2026 (USD Billion)
6.2 Hair Products
6.2.1 Market Size, By Region, 2021-2026 (USD Billion)
6.3 Eyewear
6.3.1 Market Size, By Region, 2021-2026 (USD Billion)
6.4 Apparels and Clothing
6.4.1 Market Size, By Region, 2021-2026 (USD Billion)
6.5 3D Product Demonstration
6.5.1 Market Size, By Region, 2021-2026 (USD Billion)
6.6 Other Applications
6.6.1 Market Size, By Region, 2021-2026 (USD Billion)
Chapter 7 Virtual Try-On Software Market, By Region
7.1 Regional outlook
7.2 North America
7.2.1 Market Size, By Country 2021-2026 (USD Billion)
7.2.2 Market Size, By End-User, 2021-2026 (USD Billion)
7.2.3 Market Size, By Subscription, 2021-2026 (USD Billion)
7.2.4 Market Size, By Application, 2021-2026 (USD Billion)
7.2.6 U.S.
7.2.6.1 Market Size, By End-User, 2021-2026 (USD Billion)
7.2.4.2 Market Size, By Subscription, 2021-2026 (USD Billion)
7.2.4.3 Market Size, By Application, 2021-2026 (USD Billion)
7.2.7 Canada
7.2.7.1 Market Size, By End-User, 2021-2026 (USD Billion)
7.2.7.2 Market Size, By Subscription, 2021-2026 (USD Billion)
7.2.7.3 Market Size, By Application, 2021-2026 (USD Billion)
7.3 Europe
7.3.1 Market Size, By Country 2021-2026 (USD Billion)
7.3.2 Market Size, By End-User, 2021-2026 (USD Billion)
7.3.3 Market Size, By Subscription, 2021-2026 (USD Billion)
7.3.4 Market Size, By Application, 2021-2026 (USD Billion)
7.3.6 Germany
7.3.6.1 Market Size, By End-User, 2021-2026 (USD Billion)
7.3.6.2 Market Size, By Subscription, 2021-2026 (USD Billion)
7.3.6.3 Market Size, By Application, 2021-2026 (USD Billion)
7.3.7 UK
7.3.7.1 Market Size, By End-User, 2021-2026 (USD Billion)
7.3.7.2 Market Size, By Subscription, 2021-2026 (USD Billion)
7.3.7.3 Market Size, By Application, 2021-2026 (USD Billion)
7.3.8 France
7.3.7.1 Market Size, By End-User, 2021-2026 (USD Billion)
7.3.7.2 Market Size, By Subscription, 2021-2026 (USD Billion)
7.3.7.3 Market Size, By Application, 2021-2026 (USD Billion)
7.3.9 Italy
7.3.9.1 Market Size, By End-User, 2021-2026 (USD Billion)
7.3.9.2 Market Size, By Subscription, 2021-2026 (USD Billion)
7.3.9.3 Market Size, By Application, 2021-2026 (USD Billion)
7.3.10 Spain
7.3.10.1 Market Size, By End-User, 2021-2026 (USD Billion)
7.3.10.2 Market Size, By Subscription, 2021-2026 (USD Billion)
7.3.10.3 Market Size, By Application, 2021-2026 (USD Billion)
7.3.11 Russia
7.3.11.1 Market Size, By End-User, 2021-2026 (USD Billion)
7.3.11.2 Market Size, By Subscription, 2021-2026 (USD Billion)
7.3.11.3 Market Size, By Application, 2021-2026 (USD Billion)
7.4 Asia Pacific
7.4.1 Market Size, By Country 2021-2026 (USD Billion)
7.4.2 Market Size, By End-User, 2021-2026 (USD Billion)
7.4.3 Market Size, By Subscription, 2021-2026 (USD Billion)
7.4.4 Market Size, By Application, 2021-2026 (USD Billion)
7.4.6 China
7.4.6.1 Market Size, By End-User, 2021-2026 (USD Billion)
7.4.6.2 Market Size, By Subscription, 2021-2026 (USD Billion)
7.4.6.3 Market Size, By Application, 2021-2026 (USD Billion)
7.4.7 India
7.4.7.1 Market Size, By End-User, 2021-2026 (USD Billion)
7.4.7.2 Market Size, By Subscription, 2021-2026 (USD Billion)
7.4.7.3 Market Size, By Application, 2021-2026 (USD Billion)
7.4.8 Japan
7.4.7.1 Market Size, By End-User, 2021-2026 (USD Billion)
7.4.7.2 Market Size, By Subscription, 2021-2026 (USD Billion)
7.4.7.3 Market Size, By Application, 2021-2026 (USD Billion)
7.4.9 Australia
7.4.9.1 Market Size, By End-User, 2021-2026 (USD Billion)
7.4.9.2 Market size, By Subscription, 2021-2026 (USD Billion)
7.4.9.3 Market Size, By Application, 2021-2026 (USD Billion)
7.4.10 South Korea
7.4.10.1 Market Size, By End-User, 2021-2026 (USD Billion)
7.4.10.2 Market Size, By Subscription, 2021-2026 (USD Billion)
7.4.10.3 Market Size, By Application, 2021-2026 (USD Billion)
7.5 Latin America
7.5.1 Market Size, By Country 2021-2026 (USD Billion)
7.5.2 Market Size, By End-User, 2021-2026 (USD Billion)
7.5.3 Market Size, By Subscription, 2021-2026 (USD Billion)
7.5.4 Market Size, By Application, 2021-2026 (USD Billion)
7.5.6 Brazil
7.5.6.1 Market Size, By End-User, 2021-2026 (USD Billion)
7.5.6.2 Market Size, By Subscription, 2021-2026 (USD Billion)
7.5.6.3 Market Size, By Application, 2021-2026 (USD Billion)
7.5.7 Mexico
7.5.7.1 Market Size, By End-User, 2021-2026 (USD Billion)
7.5.7.2 Market Size, By Subscription, 2021-2026 (USD Billion)
7.5.7.3 Market Size, By Application, 2021-2026 (USD Billion)
7.5.8 Argentina
7.5.7.1 Market Size, By End-User, 2021-2026 (USD Billion)
7.5.7.2 Market Size, By Subscription, 2021-2026 (USD Billion)
7.5.7.3 Market Size, By Application, 2021-2026 (USD Billion)
7.6 MEA
7.6.1 Market Size, By Country 2021-2026 (USD Billion)
7.6.2 Market Size, By End-User, 2021-2026 (USD Billion)
7.6.3 Market Size, By Subscription, 2021-2026 (USD Billion)
7.6.4 Market Size, By Application, 2021-2026 (USD Billion)
7.6.6 Saudi Arabia
7.6.6.1 Market Size, By End-User, 2021-2026 (USD Billion)
7.6.6.2 Market Size, By Subscription, 2021-2026 (USD Billion)
7.6.6.3 Market Size, By Application, 2021-2026 (USD Billion)
7.6.7 UAE
7.6.7.1 Market Size, By End-User, 2021-2026 (USD Billion)
7.6.7.2 Market Size, By Subscription, 2021-2026 (USD Billion)
7.6.7.3 Market Size, By Application, 2021-2026 (USD Billion)
7.6.8 South Africa
7.6.7.1 Market Size, By End-User, 2021-2026 (USD Billion)
7.6.7.2 Market Size, By Subscription, 2021-2026 (USD Billion)
7.6.7.3 Market Size, By Application, 2021-2026 (USD Billion)
Chapter 8 Company Landscape
8.1 Competitive Analysis, 2020
8.2 Virtooal
8.2.1 Company Overview
8.2.2 Financial Analysis
8.2.3 Strategic Positioning
8.2.4 Infographic Analysis
8.3 Mevry
8.3.1 Company Overview
8.3.2 Financial Analysis
8.3.3 Strategic Positioning
8.3.4 Infographic Analysis
8.4 Aloma Fit
8.4.1 Company Overview
8.4.2 Financial Analysis
8.4.3 Strategic Positioning
8.4.4 Infographic Analysis
8.5 Prorigo Software Canada Ltd
8.5.1 Company Overview
8.5.2 Financial Analysis
8.5.3 Strategic Positioning
8.5.4 Infographic Analysis
8.6 L’oreal
8.6.1 Company Overview
8.6.2 Financial Analysis
8.6.3 Strategic Positioning
8.6.4 Infographic Analysis
8.7 Zenni
8.7.1 Company Overview
8.7.2 Financial Analysis
8.7.3 Strategic Positioning
8.7.4 Infographic Analysis
8.8 Quytech
8.8.1 Company Overview
8.8.2 Financial Analysis
8.8.3 Strategic Positioning
8.8.4 Infographic Analysis
8.9 J!ins
8.8.1 Company Overview
8.8.2 Financial Analysis
8.8.3 Strategic Positioning
8.8.4 Infographic Analysis
8.10 Eyeconic
8.10.1 Company Overview
8.10.2 Financial Analysis
8.10.3 Strategic Positioning
8.10.4 Infographic Analysis
8.11 Others
8.11.1 Company Overview
8.11.2 Financial Analysis
8.11.3 Strategic Positioning
8.11.4 Infographic Analysis
The Global Virtual Try-On Software Market has been studied from the year 2019 till 2026. However, the CAGR provided in the report is from the year 2021 to 2026. The research methodology involved three stages: Desk research, Primary research, and Analysis & Output from the entire research process.

The desk research involved a robust background study which meant referring to paid and unpaid databases to understand the market dynamics; mapping contracts from press releases; identifying the key players in the market, studying their product portfolio, competition level, annual reports/SEC filings & investor presentations; and learning the demand and supply-side analysis for the Virtual Try-On Software Market.

The primary research activity included telephonic conversations with more than 50 tier 1 industry consultants, distributors, and end-use product manufacturers.

Finally, based on the above thorough research process, an in-depth analysis was carried out considering the following aspects: market attractiveness, current & future market trends, market share analysis, SWOT analysis of the company and customer analytics.

Frequently Asked Questions

This FREE sample includes market data points, ranging from trend analyses to market estimates & forecasts. See for yourself.
Or view our licence options:
Tailor made solutions just for you
80% of our clients seek made-to-order reports. How do you want us to tailor yours?
OUR CLIENTS


