This report was recently updated on August 15 2025 with the latest and most recent
market numbers
Global Visual Flame Detector Market Size, Trends & Analysis - Forecasts to 2026 By Product (UV, IR, Dual IR/UV, Others), By Connectivity (Wired, Wireless), By Industry (Oil & Gas, Energy & Power, Chemicals, Aerospace & Defence, Logistics, Automotive, Pharmaceuticals, Marine, Others), By Region (North America, Asia Pacific, Europe, Latin America, Middle East & Africa); End-User Landscape, Company Market Share Analysis, and Competitor Analysis
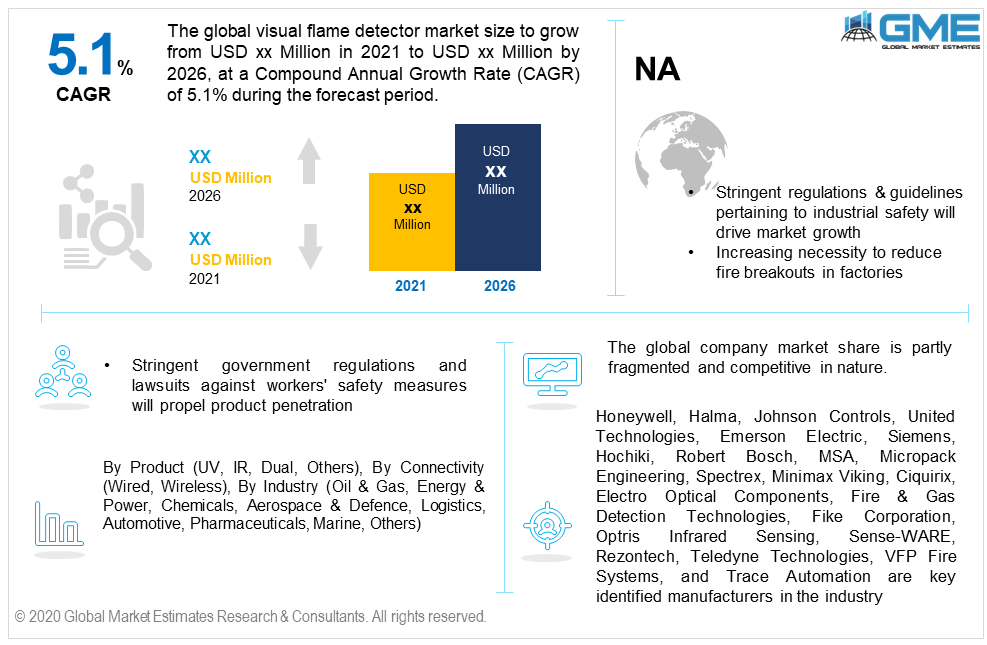
The global visual flame detector market size will observe more than 5.1% CAGR from 2021 to 2026, with North America holding the maximum revenue share in 2019. Changing industrial safety measures and the necessity to deploy advanced sensors to avoid accidents related to fire will drive visual flame detector market growth in the coming years. Stringent government regulations and lawsuits against workers' safety measures will propel product penetration.
The rising need to decrease the fire breakouts and attain maximum safety of the people and property are the prime reasons to induce the deployment of these smart sensors. The industry has witnessed sluggish growth in some industries due to Covid-19. During the initial phase of the pandemic, various industrial operations went on halt and faced heavy losses due to decreased consumption of industrial products such as oil & gas. However, the industry will be back to its normal pace in the coming years.
UV, IR, and dual IR/UV are major products identified in the industry. The majority of the deployed sensors are UV-based. Higher compatibility and suitability with diversified industries along with easy approval from the safety measures organizations are the key factors that drive demand in this segment.
However, the dual IR/VR sensors are projected to attain maximum gains from 2021 to 2026. Higher safety levels due to its detection of both IR & UV radiation are key success factors to drive growth. These sensors are specifically made for industries that are prone to hydrocarbon and organic material emissions.
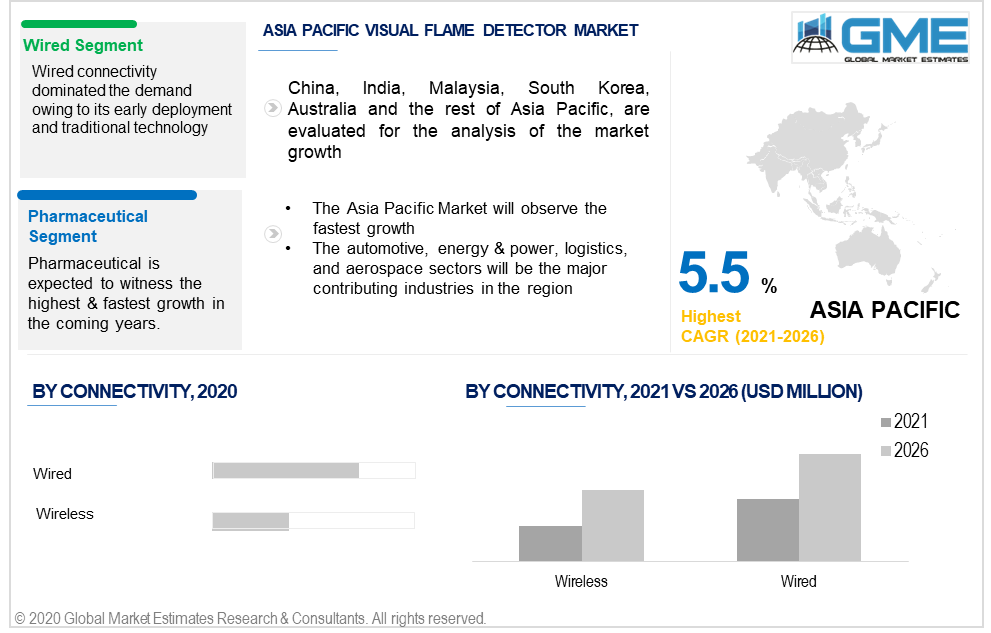
By connectivity type, the industry is segregated into wired and wireless. Wired connectivity dominated the demand owing to its early deployment and traditional technology. Easy installation and user compatibility are prime features of these sensors. As of now the wired sensors is holding more than 60% of the revenue share. Wide product availability and lesser operational cost is another factor to influence demand. However, the introduction of technologically advanced products with numerous functionality will create the demand for wireless sensors. These products will witness the fastest growth from 2021 to 2026.
By industry, the market is categorized into energy & power, oil & gas, chemicals, aerospace & defence, logistics, automotive, pharmaceuticals, and marine. The oil & gas sector dominated the industry segment and held more than 35% of the revenue in 2019. The necessity to deploy more safety measures in this industry due to high-risk associations along with strict regulatory guidelines pertaining to workers' safety has positively influenced the penetration in this segment.
The pharmaceuticals industry is expected to foresee the highest gains during the forecast period. Covid-19 has positively influenced investment in the pharmaceutical industry. Companies are heavily investing pharmaceutical industry to save it from collapsing through any means including the halt of production due to accidents. Thus, the industry holds the highest potential during the forecast period.
Logistics are projected to hold a significant share in the coming years. Changing shipment dynamics accompanied by an increasing need to tighten the safety measures will induce the demand.
The North American market led the overall demand and accounted for more than 28% of the revenue share in 2019. Stringent regulations & guidelines pertaining to industrial safety accompanied by an expansion in various industrial activities related to energy, aerospace, and automotive will induce the regional demand. Various companies are investing greatly in safety measures related to fire to avoid damages and lawsuits against worker accidents will support the product penetration in the coming years. The U.S. and Mexico are expected to be the highest contributors in the region due to heavy industrialization activities.
The Asia Pacific will witness around 5.5% CAGR from 2021 to 2026, with China, India, and Australia leading the market. The above-mentioned countries own the largest share in terms of industrialization activities. The automotive, energy & power, logistics, and aerospace sectors will be the major contributing industries in the region. Also, the presence of various domestic manufacturers of these safety devices makes the market competitive for international brands.
The European industry is greatly inclined towards industrial safety norms and adopting the safety measures tools to avoid accidental damages. Heavy industrialization activities related to automotive, aerospace, and marine will support the industry’s regional expansion. Germany, France, the UK, and Russia are projected to attain maximum revenue share.
The global company market share is partly fragmented and competitive in nature. The presence of numerous players along with high brand recognition are the major factors to make the market more competitive. Companies are heavily investing in product advancement to attain the point of differentiation in the industry. There is a high scope of new market entrants owing to its applicability in diversified end-use industries.
Honeywell, Halma, Johnson Controls, United Technologies, Emerson Electric, Siemens, Hochiki, Robert Bosch, MSA, Micropack Engineering, Spectrex, Minimax Viking, Ciquirix, Electro Optical Components, Fire & Gas Detection Technologies, Fike Corporation, Optris Infrared Sensing, Sense-WARE, Rezontech, Teledyne Technologies, VFP Fire Systems, and Trace Automation are key identified manufacturers in the industry.
Please note: This is not an exhaustive list of companies profiled in the report.
Increasing brand awareness and recognition through non-profit campaigns and offering diversified product portfolios to suit different purposes are the prime strategies seen in recent years. Involvement and collaboration across the value chain is another strategy witnessed in the industry.
Chapter 1 Methodology
1.1 Market scope & definitions
1.2 Estimates & forecast calculation
1.3 Historical data overview and validation
1.4 Data sources
1.4.1 Secondary
1.4.2 Primary
Chapter 2 Report Outlook
2.1 Visual Flame Detector industry overview, 2019-2026
2.1.1 Industry overview
2.1.2 Product overview
2.1.3 Connectivity overview
2.1.4 Industry overview
2.1.5 Regional overview
Chapter 3 Visual Flame Detector Market Trends
3.1 Market segmentation
3.2 Industry background, 2019-2026
3.3 Market key trends
3.3.1 Positive trends
3.3.2 Industry challenges
3.4 Prospective growth scenario
3.5 COVID-19 influence over industry growth
3.6 Porter’s analysis
3.7 PESTEL analysis
3.8 Value chain & supply chain analysis
3.9 Regulatory framework
3.9.1 North America
3.9.2 Europe
3.9.3 APAC
3.9.4 LATAM
3.9.5 MEA
3.10 Technology overview
3.11 Market share analysis, 2020
3.11.1 Company positioning overview, 2020
Chapter 4 Visual Flame Detector Market, By Product
4.1 Product Outlook
4.2 UV
4.2.1 Market size, by region, 2019-2026 (USD Million)
4.3 IR
4.3.1 Market size, by region, 2019-2026 (USD Million)
4.4 Dual IR/UV
4.4.1 Market size, by region, 2019-2026 (USD Million)
4.5 Others
4.5.1 Market size, by region, 2019-2026 (USD Million)
Chapter 5 Visual Flame Detector Market, By Connectivity
5.1 Connectivity Outlook
5.2 Wired
5.2.1 Market size, by region, 2019-2026 (USD Million)
5.3 Wireless
5.3.1 Market size, by region, 2019-2026 (USD Million)
Chapter 6 Visual Flame Detector Market, By Industry
6.1 Industry Outlook
6.2 Oil & Gas
6.2.1 Market size, by region, 2019-2026 (USD Million)
6.3 Energy & Power
6.3.1 Market size, by region, 2019-2026 (USD Million)
6.4 Chemicals
6.4.1 Market size, by region, 2019-2026 (USD Million)
6.5 Aerospace & Defence
6.5.1 Market size, by region, 2019-2026 (USD Million)
6.6 Logistics
6.6.1 Market size, by region, 2019-2026 (USD Million)
6.7 Automotive
6.7.1 Market size, by region, 2019-2026 (USD Million)
6.8 Pharmaceuticals
6.8.1 Market size, by region, 2019-2026 (USD Million)
6.9 Marine
6.9.1 Market size, by region, 2019-2026 (USD Million)
6.10 Others
6.10.1 Market size, by region, 2019-2026 (USD Million)
Chapter 7 Visual Flame Detector Market, By Region
7.1 Regional outlook
7.2 North America
7.2.1 Market size, by country 2019-2026 (USD Million)
7.2.2 Market size, by product, 2019-2026 (USD Million)
7.2.3 Market size, by connectivity, 2019-2026 (USD Million)
7.2.4 Market size, by industry, 2019-2026 (USD Million)
7.2.5 U.S.
7.2.5.1 Market size, by product, 2019-2026 (USD Million)
7.2.5.2 Market size, by connectivity, 2019-2026 (USD Million)
7.2.5.3 Market size, by industry, 2019-2026 (USD Million)
7.2.6 Canada
7.2.6.1 Market size, by product, 2019-2026 (USD Million)
7.2.6.2 Market size, by connectivity, 2019-2026 (USD Million)
7.2.6.3 Market size, by industry, 2019-2026 (USD Million)
7.2.7 Mexico
7.2.7.1 Market size, by product, 2019-2026 (USD Million)
7.2.7.2 Market size, by connectivity, 2019-2026 (USD Million)
7.2.7.3 Market size, by industry, 2019-2026 (USD Million)
7.3 Europe
7.3.1 Market size, by country 2019-2026 (USD Million)
7.3.2 Market size, by product, 2019-2026 (USD Million)
7.3.3 Market size, by connectivity, 2019-2026 (USD Million)
7.3.4 Market size, by industry, 2019-2026 (USD Million)
7.3.5 Germany
7.2.5.1 Market size, by product, 2019-2026 (USD Million)
7.2.5.2 Market size, by connectivity, 2019-2026 (USD Million)
7.2.5.3 Market size, by industry, 2019-2026 (USD Million)
7.3.6 Spain
7.3.6.1 Market size, by product, 2019-2026 (USD Million)
7.3.6.2 Market size, by connectivity, 2019-2026 (USD Million)
7.3.6.3 Market size, by industry, 2019-2026 (USD Million)
7.3.7 France
7.3.7.1 Market size, by product, 2019-2026 (USD Million)
7.3.7.2 Market size, by connectivity, 2019-2026 (USD Million)
7.3.7.3 Market size, by industry, 2019-2026 (USD Million)
7.3.8 Italy
7.3.8.1 Market size, by product, 2019-2026 (USD Million)
7.3.8.2 Market size, by connectivity, 2019-2026 (USD Million)
7.3.8.3 Market size, by industry, 2019-2026 (USD Million)
7.4 Asia Pacific
7.4.1 Market size, by country 2019-2026 (USD Million)
7.4.2 Market size, by product, 2019-2026 (USD Million)
7.4.3 Market size, by connectivity, 2019-2026 (USD Million)
7.4.4 Market size, by industry, 2019-2026 (USD Million)
7.4.5 China
7.4.5.1 Market size, by product, 2019-2026 (USD Million)
7.4.5.2 Market size, by connectivity, 2019-2026 (USD Million)
7.4.5.3 Market size, by industry, 2019-2026 (USD Million)
7.4.6 India
7.4.6.1 Market size, by product, 2019-2026 (USD Million)
7.4.6.2 Market size, by connectivity, 2019-2026 (USD Million)
7.4.6.3 Market size, by industry, 2019-2026 (USD Million)
7.4.7 Malaysia
7.4.7.1 Market size, by product, 2019-2026 (USD Million)
7.4.7.2 Market size, by connectivity, 2019-2026 (USD Million)
7.4.7.3 Market size, by industry, 2019-2026 (USD Million)
7.4.8 Australia
7.4.8.1 Market size, by product, 2019-2026 (USD Million)
7.4.8.2 Market size, by connectivity, 2019-2026 (USD Million)
7.4.8.3 Market size, by industry, 2019-2026 (USD Million)
7.4.9 South Korea
7.4.9.1 Market size, by product, 2019-2026 (USD Million)
7.4.9.2 Market size, by connectivity, 2019-2026 (USD Million)
7.4.9.3 Market size, by industry, 2019-2026 (USD Million)
7.5 Central & South America
7.5.1 Market size, by country 2019-2026 (USD Million)
7.5.2 Market size, by product, 2019-2026 (USD Million)
7.5.3 Market size, by connectivity, 2019-2026 (USD Million)
7.5.4 Market size, by industry, 2019-2026 (USD Million)
7.5.5 Brazil
7.5.5.1 Market size, by product, 2019-2026 (USD Million)
7.5.5.2 Market size, by connectivity, 2019-2026 (USD Million)
7.5.5.3 Market size, by industry, 2019-2026 (USD Million)
7.5.6 Argentina
7.5.6.1 Market size, by product, 2019-2026 (USD Million)
7.5.6.2 Market size, by connectivity, 2019-2026 (USD Million)
7.5.6.3 Market size, by industry, 2019-2026 (USD Million)
7.6 MEA
7.6.1 Market size, by country 2019-2026 (USD Million)
7.6.2 Market size, by product, 2019-2026 (USD Million)
7.6.3 Market size, by connectivity, 2019-2026 (USD Million)
7.6.4 Market size, by industry, 2019-2026 (USD Million)
7.6.5 Saudi Arabia
7.6.5.1 Market size, by product, 2019-2026 (USD Million)
7.6.5.2 Market size, by connectivity, 2019-2026 (USD Million)
7.6.5.3 Market size, by industry, 2019-2026 (USD Million)
7.6.6 UAE
7.6.6.1 Market size, by product, 2019-2026 (USD Million)
7.6.6.2 Market size, by connectivity, 2019-2026 (USD Million)
7.6.6.3 Market size, by industry, 2019-2026 (USD Million)
7.6.7 South Africa
7.6.7.1 Market size, by product, 2019-2026 (USD Million)
7.6.7.2 Market size, by connectivity, 2019-2026 (USD Million)
7.6.7.3 Market size, by industry, 2019-2026 (USD Million)
Chapter 8 Company Landscape
8.1 Competitive analysis, 2020
8.2 Halma
8.2.1 Company overview
8.2.2 Financial analysis
8.2.3 Strategic positioning
8.2.4 Info graphic analysis
8.3 Honeywell
8.3.1 Company overview
8.3.2 Financial analysis
8.3.3 Strategic positioning
8.3.4 Info graphic analysis
8.4 Johnson Controls
8.4.1 Company overview
8.4.2 Financial analysis
8.4.3 Strategic positioning
8.4.4 Info graphic analysis
8.5 Siemens
8.5.1 Company overview
8.5.2 Financial analysis
8.5.3 Strategic positioning
8.5.4 Info graphic analysis
8.6 United Technologies
8.6.1 Company overview
8.6.2 Financial analysis
8.6.3 Strategic positioning
8.6.4 Info graphic analysis
8.7 Emerson Electric
8.7.1 Company overview
8.7.2 Financial analysis
8.7.3 Strategic positioning
8.7.4 Info graphic analysis
8.8 Hochiki
8.8.1 Company overview
8.8.2 Financial analysis
8.8.3 Strategic positioning
8.8.4 Info graphic analysis
8.9 MSA
8.9.1 Company overview
8.9.2 Financial analysis
8.9.3 Strategic positioning
8.9.4 Info graphic analysis
8.10 Robert Bosch
8.10.1 Company overview
8.10.2 Financial analysis
8.10.3 Strategic positioning
8.10.4 Info graphic analysis
8.11 Micropack Engineering
8.11.1 Company overview
8.11.2 Financial analysis
8.11.3 Strategic positioning
8.11.4 Info graphic analysis
8.12 Minimax Viking
8.12.1 Company overview
8.12.2 Financial analysis
8.12.3 Strategic positioning
8.12.4 Info graphic analysis
8.13 Spectrex
8.13.1 Company overview
8.13.2 Financial analysis
8.13.3 Strategic positioning
8.13.4 Info graphic analysis
8.14 Ciqurix
8.14.1 Company overview
8.14.2 Financial analysis
8.14.3 Strategic positioning
8.14.4 Info graphic analysis
8.15 Electro Optical Components
8.15.1 Company overview
8.15.2 Financial analysis
8.15.3 Strategic positioning
8.15.4 Info graphic analysis
8.16 Fike Corporation
8.16.1 Company overview
8.16.2 Financial analysis
8.16.3 Strategic positioning
8.16.4 Info graphic analysis
8.17 Sense-Ware
8.17.1 Company overview
8.17.2 Financial analysis
8.17.3 Strategic positioning
8.17.4 Info graphic analysis
8.18 New England Photoconductor
8.18.1 Company overview
8.18.2 Financial analysis
8.18.3 Strategic positioning
8.18.4 Info graphic analysis
8.19 Ambetronics Engineers Pvt.Ltd.
8.19.1 Company overview
8.19.2 Financial analysis
8.19.3 Strategic positioning
8.19.4 Info graphic analysis
8.19 ORR PROTECTION
8.19.1 Company overview
8.19.2 Financial analysis
8.19.3 Strategic positioning
8.19.4 Info graphic analysis
8.19 Endee-Engineers
8.19.1 Company overview
8.19.2 Financial analysis
8.19.3 Strategic positioning
8.19.4 Info graphic analysis
The Global Visual Flame Detector Market has been studied from the year 2019 till 2026. However, the CAGR provided in the report is from the year 2021 to 2026. The research methodology involved three stages: Desk research, Primary research, and Analysis & Output from the entire research process.

The desk research involved a robust background study which meant referring to paid and unpaid databases to understand the market dynamics; mapping contracts from press releases; identifying the key players in the market, studying their product portfolio, competition level, annual reports/SEC filings & investor presentations; and learning the demand and supply-side analysis for the Visual Flame Detector Market.

The primary research activity included telephonic conversations with more than 50 tier 1 industry consultants, distributors, and end-use product manufacturers.

Finally, based on the above thorough research process, an in-depth analysis was carried out considering the following aspects: market attractiveness, current & future market trends, market share analysis, SWOT analysis of the company and customer analytics.

Frequently Asked Questions

This FREE sample includes market data points, ranging from trend analyses to market estimates & forecasts. See for yourself.
Or view our licence options:
Tailor made solutions just for you
80% of our clients seek made-to-order reports. How do you want us to tailor yours?
OUR CLIENTS


