This report was recently updated on July 5 2025 with the latest and most recent
market numbers
Global Voice Assistant Shopping Market Market Size, Trends & Analysis - Forecasts to 2026 By Technology (Speech Recognition, Natural Language Processing, Text To Speech Recognition), By Hardware (Smart Phones & Tablets, Smar Speakers [Google Assistant, Alexa & Amazon Echo, Bixby, Duer, Nina, JBL]), By Application (Food Order (Takeout), Grocery, Book, Homecare Goods, Transportation, Cloothing, Travel Reservation), By Region (North America, Asia Pacific, Europe, Latin America, Middle East & Africa); End-User Landscape, Company Market Share Analysis, and Competitor Analysis
The global voice assistant shopping market size is intended to grow at more than 50% CAGR up to 2026, with the North American region dominating the revenue share. Shifting consumer preference towards online purchase due to increased digitalization, availability of more product variety, and economical price will drive industry growth. Previously, the purchase category was only focused on apparel, books, and homecare goods. But, due to the covid-19 impact now the customers are also interested in buying groceries, appliances, and other expensive goods.
Convenience, efficiency, and enjoyment are the prime experiences that promoted the Voice Assistant Shopping Market growth. The U.S. is among the majorly contributing market in the industry. As per industry experts, in the country, more than 30% of the users made a purchase through voice searches in the previous year. The age group of people between 18 to 29 are among the highly contributing consumer group. However, concerns such as product quality, performance, and durability are major drawbacks faced in the industry.
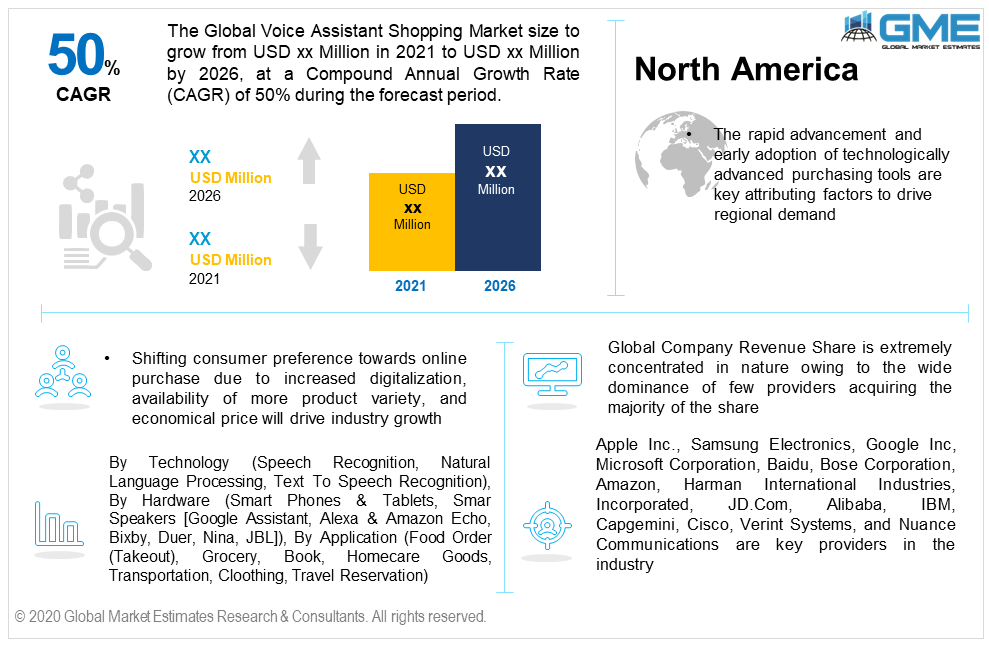
By technology, the industry is categorized into speech recognition, natural language processing, and text to speech among others. Speech recognition and natural language processing are the major technologies adopted in the industry. The speech recognition technology aids in computers understand the spoken audio and generate it into text. On contrary, in natural language processing technology, the system can directly understand the different speeches like a human.
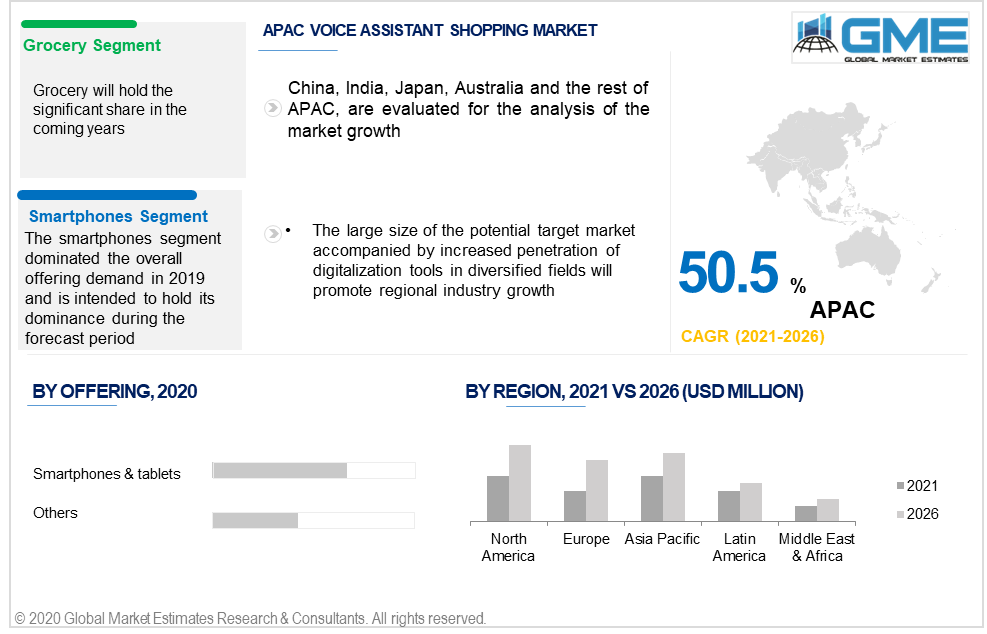
Smartphones & tablets and smart speakers subdivided into google assistant, Alexa & echo dot, Bixby, Duer, Nina, and JBL among others are the prime hardware used while placing an online order through speech. Alexa & echo dot and smartphones are the majorly used hardware in the e-commerce trading industry. Smartphones held responsible for more than 65% of the shopping revenue in 2019. Customized search, time management, and ease in finding the right product are prime benefits offered through these hardware.
Other significantly recognized hardware in the industry are Google assistant, Bixby, and JBL. Companies are investing in continuous development to streamline different hardware with their systems to gain maximum coverage.
By application, the industry is categorized into food order, book, grocery, homecare goods, transportation, clothing, and travel reservation among others. The homecare goods and clothing dominated the overall application segment and together held more than 42% of the sales in 2019. Wide product variety, attractive discounts & coupons, and economical costing are the major factors that attract customers to do online purchases.
Other key applications such as grocery and food orders are gaining high popularity during the covid-19 pandemic lockdown. The majority of the consumers are now comfortable purchasing groceries online rather than from physical stores.
The North American market, dominated by the U.S. and Canada leads the global demand and accounted for more than 60% of the revenue share in 2019. The rapid advancement and early adoption of technologically advanced purchasing tools are key attributing factors to drive regional demand. The presence of well-organized IT and AI infrastructure at a large level in diversified applications also contributed to this market dominance.
The Asia Pacific region is anticipated to grow at the fastest pace during the forecast period. The large size of the potential target market accompanied by increased penetration of digitalization tools in diversified fields will promote regional industry growth. The region holds high potential in online purchasing applications owing to e-commerce trade expansion in recent years. The majority of the buying traffic is shifted to online platforms.
The European industry will observe significant gains from 2021 to 2026. Increased online shopping penetration specifically since the occurrence of covid-19 pandemic will support the regional industry growth. The region has witnessed a significant shift to online purchase platform among different age group of consumers including the geriatric. In the past, old people were not comfortable to do online buying due to multiple filters and product category segment. It made it difficult for them to find any particular product in lesser time. However, the orally simulated buying experience will benefit the geriatric consumer who can easily search and place order by speech.
Global Company Revenue Share is extremely concentrated in nature owing to the wide dominance of few providers acquiring the majority of the share. Technology innovation and advancement to make the concept more compatible with diversified hardware and network environment are among the prime focus witnessed in the industry. Moreover, product knowledge and implementation programs to increase the concept acceptability and usage at a large level will be noticed in the coming years.
Apple Inc., Samsung Electronics, Google Inc, Microsoft Corporation, Baidu, Bose Corporation, Amazon, Harman International Industries, Incorporated, JD.Com, Alibaba, IBM, Capgemini, Cisco, Verint Systems, and Nuance Communications are key providers in the industry.
Please note: This is not an exhaustive list of companies profiled in the report.
As of now, the industry is consolidated as only a few companies offer their services at the national and international market levels. Though, rapid development and advancement in the e-commerce industry are attracting new market entrants to invest in the concept.
Chapter 1 Methodology
1.1 Market scope & definitions
1.2 Estimates & forecast calculation
1.3 Historical data overview and validation
1.4 Data sources
1.4.1 Secondary
1.4.2 Primary
Chapter 2 Report Outlook
2.1 Voice Assistant Shopping industry overview, 2019-2026
2.1.1 Industry overview
2.1.2 Product overview
2.1.3 Function overview
2.1.4 Offering overview
2.1.5 Regional overview
Chapter 3 Voice Assistant Shopping Market Trends
3.1 Market segmentation
3.2 Industry background, 2019-2026
3.3 Market key trends
3.3.1 Positive trends
3.3.2 Industry challenges
3.4 Prospective growth scenario
3.5 COVID-19 influence over industry growth
3.6 Porter’s analysis
3.7 PESTEL analysis
3.8 Value chain & supply chain analysis
3.9 Regulatory framework
3.9.1 North America
3.9.2 Europe
3.9.3 APAC
3.9.4 LATAM
3.9.5 MEA
3.10 Technology overview
3.11 Market share analysis, 2020
3.11.1 Company positioning overview, 2020
Chapter 4 Voice Assistant Shopping Market, By Technology
4.1 Technology Outlook
4.2 Speech Recognition
4.2.1 Market size, by region, 2019-2026 (USD Million)
4.3 Natural Language Processing
4.3.1 Market size, by region, 2019-2026 (USD Million)
4.4 Text to Speech Recognition
4.4.1 Market size, by region, 2019-2026 (USD Million)
4.5 Others
4.5.1 Market size, by region, 2019-2026 (USD Million)
Chapter 5 Voice Assistant Shopping Market, By Hardware
5.1 Hardware Outlook
5.2 Smartphones & tablets
5.2.1 Market size, by region, 2019-2026 (USD Million)
5.3 Smart Speakers
5.3.1 Market size, by region, 2019-2026 (USD Million)
5.3.2 Google Assistant
5.3.2.1 Market size, by region, 2019-2026 (USD Million)
5.3.2 Alexa & Amazon echo
5.3.2.1 Market size, by region, 2019-2026 (USD Million)
5.3.3 Bixby
5.3.3.1 Market size, by region, 2019-2026 (USD Million)
5.3.4 Duer
5.3.4.1 Market size, by region, 2019-2026 (USD Million)
5.3.5 Nina
5.3.5.1 Market size, by region, 2019-2026 (USD Million)
5.3.6 JBL
5.3.6.1 Market size, by region, 2019-2026 (USD Million)
5.3.7 Others
5.3.7.1 Market size, by region, 2019-2026 (USD Million)
5.4 Others
5.4.1 Market size, by region, 2019-2026 (USD Million)
Chapter 6 Voice Assistant Shopping Market, By Application
6.1 Application Outlook
6.2 Food order (Takeout)
6.2.1 Market size, by region, 2019-2026 (USD Million)
6.3 Grocery
6.3.1 Market size, by region, 2019-2026 (USD Million)
6.4 Book
6.4.1 Market size, by region, 2019-2026 (USD Million)
6.5 Homecare goods
6.5.1 Market size, by region, 2019-2026 (USD Million)
6.6 Transportation (Cab/Taxi Book)
6.6.1 Market size, by region, 2019-2026 (USD Million)
6.7 Clothing
6.7.1 Market size, by region, 2019-2026 (USD Million)
6.8 Travel reservation
6.8.1 Market size, by region, 2019-2026 (USD Million)
6.9 Others
6.9.1 Market size, by region, 2019-2026 (USD Million)
Chapter 7 Voice Assistant Shopping Market, By Region
7.1 Regional outlook
7.2 North America
7.2.1 Market size, by country 2019-2026 (USD Million)
7.2.2 Market size, By Technology, 2019-2026 (USD Million)
7.2.3 Market size, By Application, 2019-2026 (USD Million)
7.2.4 Market size, By Hardware, 2019-2026 (USD Million)
7.2.5 U.S.
7.2.5.1 Market size, By Technology, 2019-2026 (USD Million)
7.2.5.2 Market size, By Application, 2019-2026 (USD Million)
7.2.5.3 Market size, By Hardware, 2019-2026 (USD Million)
7.2.6 Canada
7.2.6.1 Market size, By Technology, 2019-2026 (USD Million)
7.2.6.2 Market size, By Application, 2019-2026 (USD Million)
7.2.6.3 Market size, By Hardware, 2019-2026 (USD Million)
7.2.7 Mexico
7.2.7.1 Market size, By Technology, 2019-2026 (USD Million)
7.2.7.2 Market size, By Application, 2019-2026 (USD Million)
7.2.7.3 Market size, By Hardware, 2019-2026 (USD Million)
7.3 Europe
7.3.1 Market size, by country 2019-2026 (USD Million)
7.3.2 Market size, By Technology, 2019-2026 (USD Million)
7.3.3 Market size, By Application, 2019-2026 (USD Million)
7.3.4 Market size, By Hardware, 2019-2026 (USD Million)
7.3.5 Germany
7.2.5.1 Market size, By Technology, 2019-2026 (USD Million)
7.2.5.2 Market size, By Application, 2019-2026 (USD Million)
7.2.5.3 Market size, By Hardware, 2019-2026 (USD Million)
7.3.6 Spain
7.3.6.1 Market size, By Technology, 2019-2026 (USD Million)
7.3.6.2 Market size, By Application, 2019-2026 (USD Million)
7.3.6.3 Market size, By Hardware, 2019-2026 (USD Million)
7.3.7 France
7.3.7.1 Market size, By Technology, 2019-2026 (USD Million)
7.3.7.2 Market size, By Application, 2019-2026 (USD Million)
7.3.7.3 Market size, By Hardware, 2019-2026 (USD Million)
7.3.8 Italy
7.3.8.1 Market size, By Technology, 2019-2026 (USD Million)
7.3.8.2 Market size, By Application, 2019-2026 (USD Million)
7.3.8.3 Market size, By Hardware, 2019-2026 (USD Million)
7.4 Asia Pacific
7.4.1 Market size, by country 2019-2026 (USD Million)
7.4.2 Market size, By Technology, 2019-2026 (USD Million)
7.4.3 Market size, By Application, 2019-2026 (USD Million)
7.4.4 Market size, By Hardware, 2019-2026 (USD Million)
7.4.5 China
7.4.5.1 Market size, By Technology, 2019-2026 (USD Million)
7.4.5.2 Market size, By Application, 2019-2026 (USD Million)
7.4.5.3 Market size, By Hardware, 2019-2026 (USD Million)
7.4.6 India
7.4.6.1 Market size, By Technology, 2019-2026 (USD Million)
7.4.6.2 Market size, By Application, 2019-2026 (USD Million)
7.4.6.3 Market size, By Hardware, 2019-2026 (USD Million)
7.4.7 Malaysia
7.4.7.1 Market size, By Technology, 2019-2026 (USD Million)
7.4.7.2 Market size, By Application, 2019-2026 (USD Million)
7.4.7.3 Market size, By Hardware, 2019-2026 (USD Million)
7.4.8 Australia
7.4.8.1 Market size, By Technology, 2019-2026 (USD Million)
7.4.8.2 Market size, By Application, 2019-2026 (USD Million)
7.4.8.3 Market size, By Hardware, 2019-2026 (USD Million)
7.4.9 South Korea
7.4.9.1 Market size, By Technology, 2019-2026 (USD Million)
7.4.9.2 Market size, By Application, 2019-2026 (USD Million)
7.4.9.3 Market size, By Hardware, 2019-2026 (USD Million)
7.5 Central & South America
7.5.1 Market size, by country 2019-2026 (USD Million)
7.5.2 Market size, By Technology, 2019-2026 (USD Million)
7.5.3 Market size, By Application, 2019-2026 (USD Million)
7.5.4 Market size, By Hardware, 2019-2026 (USD Million)
7.5.5 Brazil
7.5.5.1 Market size, By Technology, 2019-2026 (USD Million)
7.5.5.2 Market size, By Application, 2019-2026 (USD Million)
7.5.5.3 Market size, By Hardware, 2019-2026 (USD Million)
7.5.6 Argentina
7.5.6.1 Market size, By Technology, 2019-2026 (USD Million)
7.5.6.2 Market size, By Application, 2019-2026 (USD Million)
7.5.6.3 Market size, By Hardware, 2019-2026 (USD Million)
7.6 MEA
7.6.1 Market size, by country 2019-2026 (USD Million)
7.6.2 Market size, By Technology, 2019-2026 (USD Million)
7.6.3 Market size, By Application, 2019-2026 (USD Million)
7.6.4 Market size, By Hardware, 2019-2026 (USD Million)
7.6.5 Saudi Arabia
7.6.5.1 Market size, By Technology, 2019-2026 (USD Million)
7.6.5.2 Market size, By Application, 2019-2026 (USD Million)
7.6.5.3 Market size, By Hardware, 2019-2026 (USD Million)
7.6.6 UAE
7.6.6.1 Market size, By Technology, 2019-2026 (USD Million)
7.6.6.2 Market size, By Application, 2019-2026 (USD Million)
7.6.6.3 Market size, By Hardware, 2019-2026 (USD Million)
7.6.7 South Africa
7.6.7.1 Market size, By Technology, 2019-2026 (USD Million)
7.6.7.2 Market size, By Application, 2019-2026 (USD Million)
7.6.7.3 Market size, By Hardware, 2019-2026 (USD Million)
Chapter 8 Company Landscape
8.1 Competitive analysis, 2020
8.2 Apple Inc.
8.2.1 Company overview
8.2.2 Financial analysis
8.2.3 Strategic positioning
8.2.4 Info graphic analysis
8.3 Samsung Electronics
8.3.1 Company overview
8.3.2 Financial analysis
8.3.3 Strategic positioning
8.3.4 Info graphic analysis
8.4 Google Inc
8.4.1 Company overview
8.4.2 Financial analysis
8.4.3 Strategic positioning
8.4.4 Info graphic analysis
8.5 Microsoft Corporation
8.5.1 Company overview
8.5.2 Financial analysis
8.5.3 Strategic positioning
8.5.4 Info graphic analysis
8.6 Baidu
8.6.1 Company overview
8.6.2 Financial analysis
8.6.3 Strategic positioning
8.6.4 Info graphic analysis
8.7 Bose Corporation
8.7.1 Company overview
8.7.2 Financial analysis
8.7.3 Strategic positioning
8.7.4 Info graphic analysis
8.8 Amazon
8.8.1 Company overview
8.8.2 Financial analysis
8.8.3 Strategic positioning
8.8.4 Info graphic analysis
8.9 Harman International Industries, Incorporated
8.9.1 Company overview
8.9.2 Financial analysis
8.9.3 Strategic positioning
8.9.4 Info graphic analysis
8.10 JD.Com
8.10.1 Company overview
8.10.2 Financial analysis
8.10.3 Strategic positioning
8.10.4 Info graphic analysis
8.11 Alibaba
8.11.1 Company overview
8.11.2 Financial analysis
8.11.3 Strategic positioning
8.11.4 Info graphic analysis
8.12 IBM
8.12.1 Company overview
8.12.2 Financial analysis
8.12.3 Strategic positioning
8.12.4 Info graphic analysis
8.13 Capgemini
8.13.1 Company overview
8.13.2 Financial analysis
8.13.3 Strategic positioning
8.13.4 Info graphic analysis
8.14 Cisco
8.14.1 Company overview
8.14.2 Financial analysis
8.14.3 Strategic positioning
8.14.4 Info graphic analysis
8.15 Verint Systems
8.15.1 Company overview
8.15.2 Financial analysis
8.15.3 Strategic positioning
8.15.4 Info graphic analysis
8.16 Nuance Communications
8.16.1 Company overview
8.16.2 Financial analysis
8.16.3 Strategic positioning
8.16.4 Info graphic analysis
The Global Voice Assistant Shopping Market has been studied from the year 2019 till 2026. However, the CAGR provided in the report is from the year 2021 to 2026. The research methodology involved three stages: Desk research, Primary research, and Analysis & Output from the entire research process.

The desk research involved a robust background study which meant referring to paid and unpaid databases to understand the market dynamics; mapping contracts from press releases; identifying the key players in the market, studying their product portfolio, competition level, annual reports/SEC filings & investor presentations; and learning the demand and supply-side analysis for the Voice Assistant Shopping Market.

The primary research activity included telephonic conversations with more than 50 tier 1 industry consultants, distributors, and end-use product manufacturers.

Finally, based on the above thorough research process, an in-depth analysis was carried out considering the following aspects: market attractiveness, current & future market trends, market share analysis, SWOT analysis of the company and customer analytics.

Frequently Asked Questions
![Global Voice Assistant Shopping Market Market Size, Trends & Analysis - Forecasts to 2026 By Technology (Speech Recognition, Natural Language Processing, Text To Speech Recognition), By Hardware (Smart Phones & Tablets, Smar Speakers [Google Assistant, Alexa & Amazon Echo, Bixby, Duer, Nina, JBL]), By Application (Food Order (Takeout), Grocery, Book, Homecare Goods, Transportation, Cloothing, Travel Reservation), By Region (North America, Asia Pacific, Europe, Latin America, Middle East & Africa); End-User Landscape, Company Market Share Analysis, and Competitor Analysis](https://www.globalmarketestimates.com/images/cat/Trending Technology.png)
This FREE sample includes market data points, ranging from trend analyses to market estimates & forecasts. See for yourself.
Or view our licence options:
Tailor made solutions just for you
80% of our clients seek made-to-order reports. How do you want us to tailor yours?
OUR CLIENTS


