This report was recently updated on August 21 2025 with the latest and most recent
market numbers
Global Waste to Energy Solutions Market Size, Trends & Analysis - Forecasts to 2029 By Technology (Thermal and Biological), By Waste Type (Municipal Solid Waste (MSW) and Industrial Waste), and By Region (North America, Asia Pacific, Central and South America, Europe, and Middle East and Africa), Competitive Landscape, Company Market Share Analysis, and End User Analysis
The global waste to energy solutions market is projected to grow at a CAGR of 8.5% from 2024 to 2029.
The rise in global urbanization and business expansion has led to an increase in the volume of generated waste worldwide. This increased trash generation needs the development of appropriate garbage disposal and management strategies. Urbanization and industrialization contribute significantly to increasing waste volume, raising environmental issues. To solve this issue, there is a rising demand for effective waste management strategies that reduce environmental impact while utilizing waste as a valuable resource. Waste-to-energy technologies are essential in providing a sustainable solution by lowering dependency on landfills and producing renewable energy from discarded materials, thus contributing to a more ecologically friendly and circular waste management system.
Growing awareness of environmental issues, like climate change and pollution, encourages governments and industries to explore environmentally friendly alternatives to traditional waste disposal methods. This shift reflects a broader commitment to adopting more sustainable practices and addressing environmental concerns associated with waste management.
Establishing waste-to-energy facilities necessitates a significant initial investment, which is difficult, particularly in economically weak regions and smaller communities. This price barrier may restrict the widespread adoption of waste-to-energy technologies, particularly in locations with limited resources.
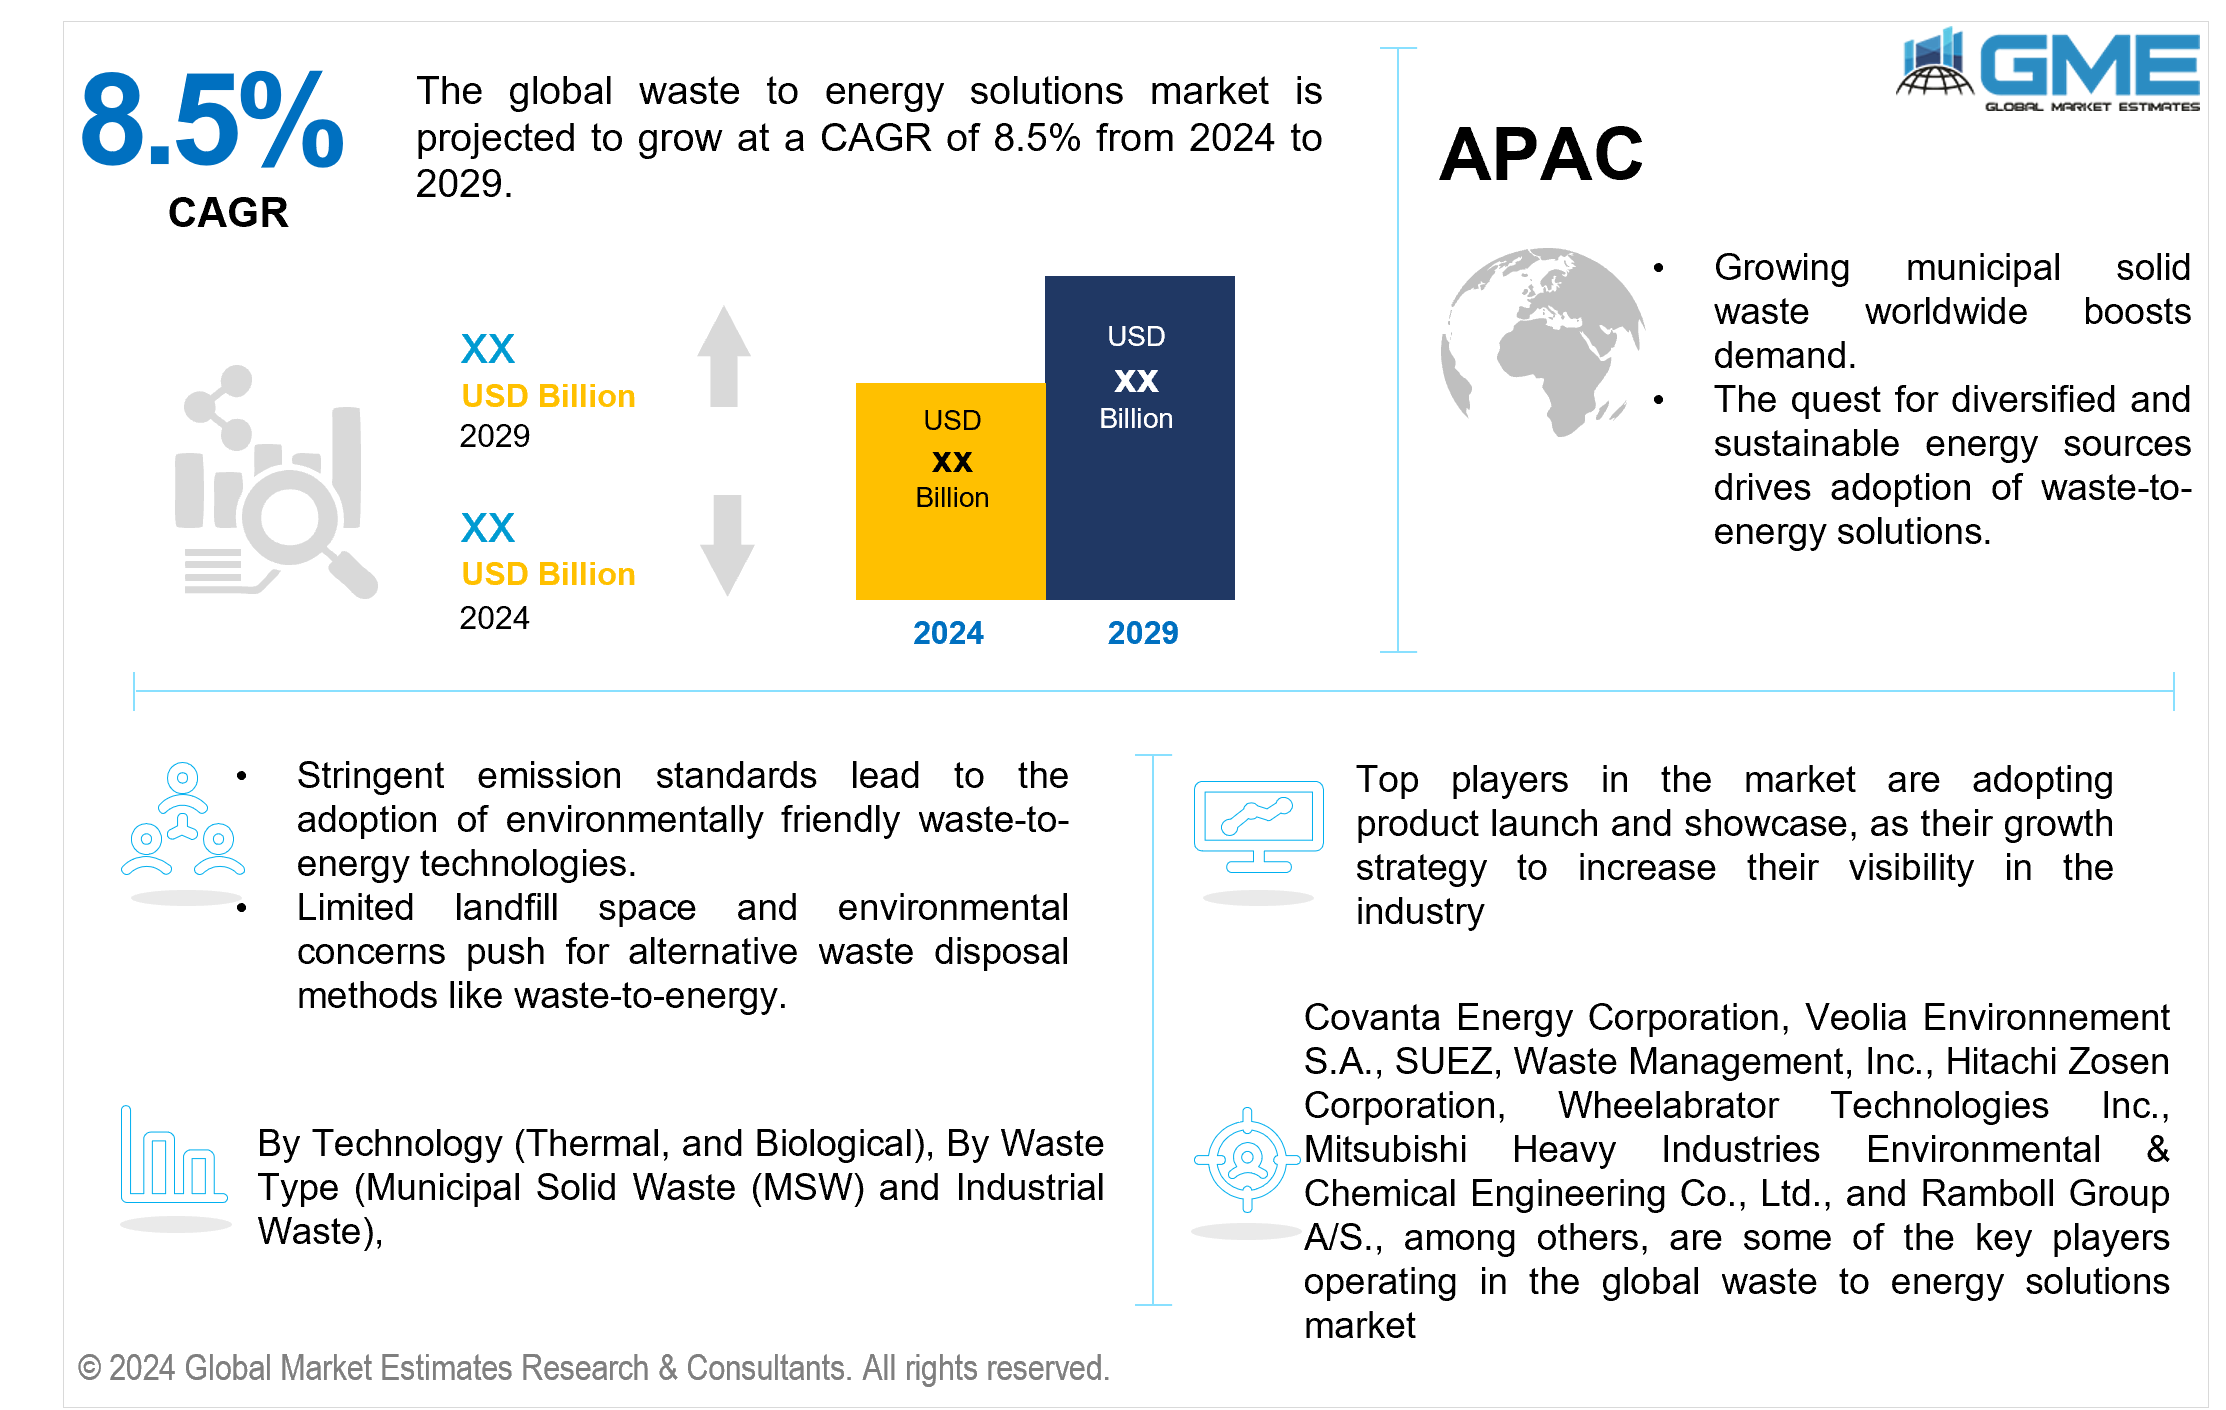
The thermal segment is expected to hold the largest share in the market. The segment's growth is due to its established and widely adopted technologies, such as incineration. Thermal conversion processes involve waste combustion to generate heat, which is then used to produce electricity. The efficiency and reliability of thermal technologies contribute to the segment's dominance.
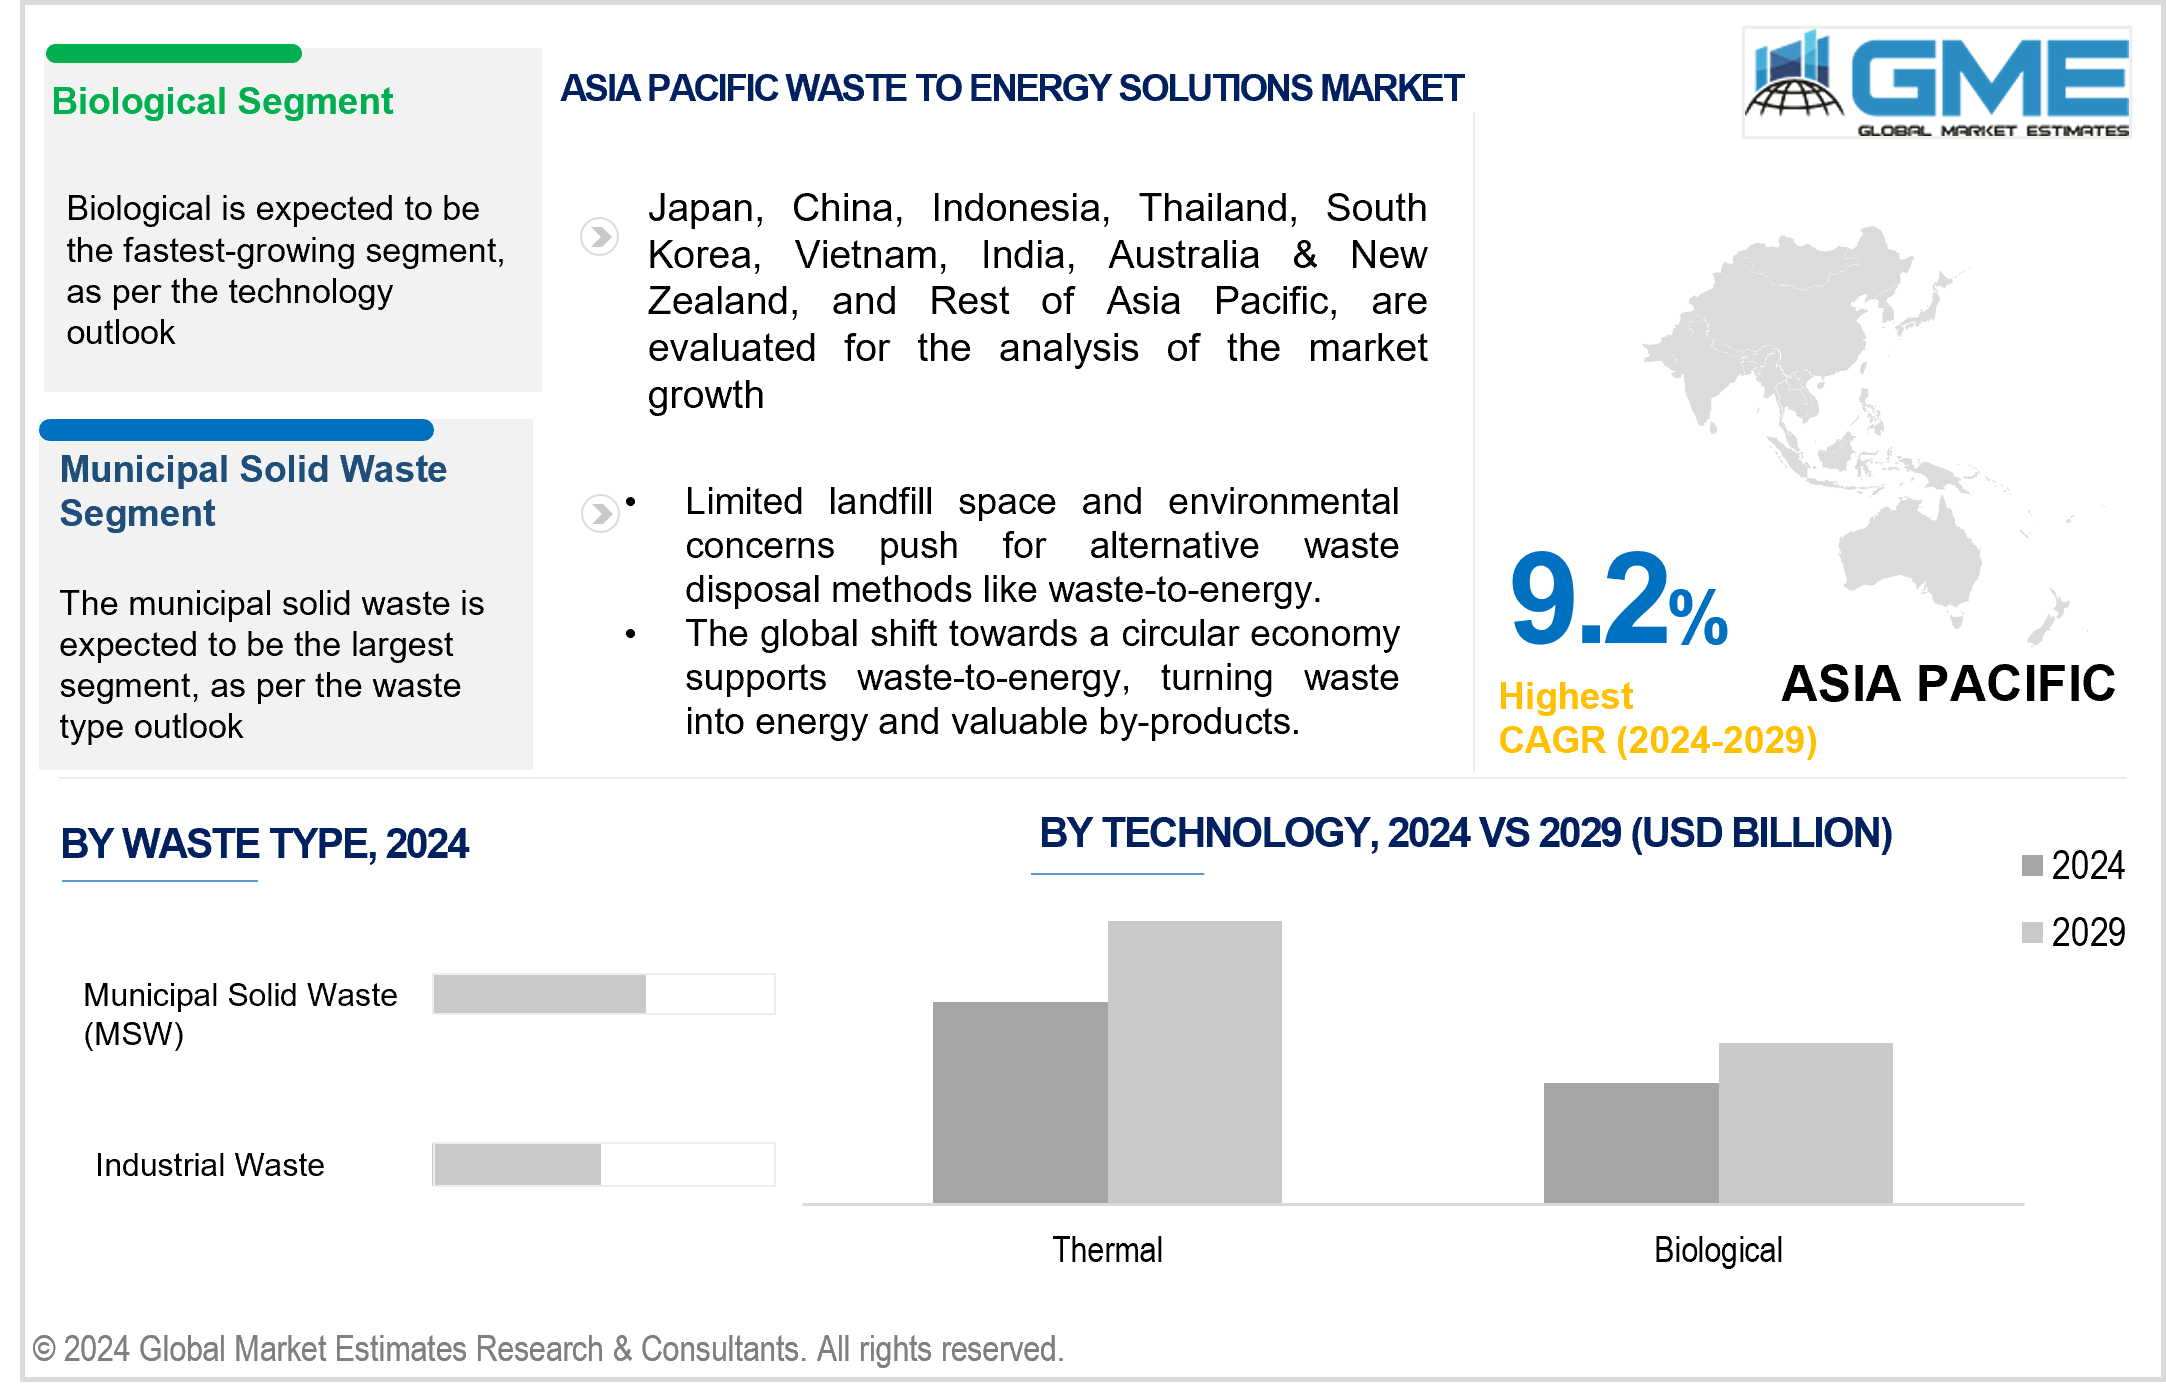
The biological segment is expected to be the fastest-growing segment in the market from 2024-2029. The growth is attributed to the rising awareness of sustainable and environmentally friendly waste management techniques. Biological processes provide a more environmentally friendly solution by turning organic waste into biogas or biofuel. Growing developments in biological technologies and environmental consciousness all contribute to the market growth.
The industrial waste segment is anticipated to be the fastest-growing segment in the market from 2024-2029. The factors contributing to the segment growth include increased industrialization and the growing demand for efficient disposal techniques. Industries create various waste and have significant potential to convert it into energy sources. Stringent environmental restrictions and an increasing emphasis on sustainability encourage enterprises to adopt waste-to-energy solutions, contributing to the waste to energy solutions market.
The municipal solid waste (MSW) segment is expected to hold the largest share of the market. Municipal solid waste contains a wide range of materials, including both organic and inorganic components, making it an important and widely available feedstock for waste-to-energy processes. Governments and municipalities are increasing their attention on sustainable waste management solutions and converting municipal solid waste into energy with the aim of trash reduction and renewable energy generation, which is further contributing to the segment growth.
North America is expected to be the largest region in the global market. The region's electricity generation mix is diverse, with natural gas accounting for 36% and coal at 19% in 2021. Additionally, North America's total electricity production reached 5,397,346 GWh in 2021. The United States, Canada, and Mexico collectively dominate the regional rankings, with the U.S. alone contributing 81.1% of the total electricity production. This robust energy infrastructure, combined with increasing emphasis on sustainability and renewable sources, contributes to North America's waste-to-energy solutions market growth.
Asia Pacific is predicted to witness rapid growth during the forecast period. The region's growing urbanization, population, and industry generate higher energy demand. According to UN-Habitat, Asia and the Pacific are undergoing rapid urbanization, presenting opportunities and challenges. With a population of over 2.2 billion people, 54% of the global urban population resides in Asia and is estimated to grow by 50% by 2050, adding 1.2 billion people. To fulfill the growing energy demand, governments around the Asia Pacific are investing heavily in infrastructure, including energy projects.
Covanta Energy Corporation, Veolia Environnement S.A., SUEZ, Waste Management, Inc., Hitachi Zosen Corporation, Wheelabrator Technologies Inc., Mitsubishi Heavy Industries Environmental & Chemical Engineering Co., Ltd., Xcel Energy Inc., Babcock & Wilcox Enterprises, Inc., Hitachi Zosen Inova AG, Keppel Seghers, Waste Connections, Inc., China Everbright International Limited, Amec Foster Wheeler, Plasco Conversion Technologies Inc., Constructions Industrielles de la Méditerranée (CNIM), Foster Wheeler AG, Biomass Secure Power Inc., Green Conversion Systems, Inc, and Ramboll Group A/S., among others, are some of the key players operating in the global waste to energy solutions market.
Please note: This is not an exhaustive list of companies profiled in the report.
In December 2023, SUEZ and Humens collaborated on an approximately USD 140 million investment to construct a 55 MW solid recovered fuel (SRF) power plant named Novasteam. This circular economy project will supply Humens' Novacarb plant energy, producing sodium bicarbonate.
In July 2023, Keppel Corporation and HSBC entered a Memorandum of Understanding (MOU) to explore collaboration on decarbonization solutions. The MOU aims to create a strategic collaboration framework to address market demand for sustainability solutions in densely built-up urban areas, including the Greater Bay Area (GBA) and across Asia.
1 STRATEGIC INSIGHTS ON NEW REVENUE POCKETS
1.1 Strategic Opportunity & Attractiveness Analysis
1.1.1 Hot Revenue Pockets
1.1.2 Market Attractiveness Score
1.1.3 Revenue Impacting Opportunity
1.1.4 High Growing Region/Country
1.1.5 Competitor Analysis
1.1.6 Consumer Analysis
1.2 Global Market Estimates' View
1.3 Strategic Insights across Business Functions
1.3.1 For Chief Executive Officers
1.3.2 For Chief Marketing Officers
1.3.3 For Chief Strategy Officers
1.4 Evaluate the Potential of your Existing Business Lines vs. New Lines to Enter Into
2 TECHNOLOGICAL TRENDS
2.1 Technological Adoption Rate
2.2 Current Trend Impact Analysis
2.3 Future Trend Impact Analysis
3 GLOBAL MARKET OUTLOOK
3.1 Market Pyramid Analysis
3.1.1 Introduction
3.1.2 Adjacent Market Opportunities
3.1.3 Ancillary Market Opportunities
3.2 Demand Side Analysis
3.2.1 Market Drivers: Impact Analysis
3.2.2 Market Restraints: Impact Analysis
3.2.3 Market Opportunities: Impact Analysis
3.2.4 Market Challenges: Impact Analysis
3.3 Supply Side Analysis
3.3.1 Porter’s Five Forces Analysis
3.3.1.1 Threat of New Entrants
3.3.1.2 Threat of New Substitutes
3.3.1.3 Bargaining Power of Suppliers
3.3.1.4 Bargaining Power of Buyers
3.3.1.5 Intensity of Competitive Rivalry
3.3.2 SWOT Analysis; By Factor (Political & Legal, Economic, and Technological)
3.3.2.1 Political Landscape
3.3.2.2 Economic Landscape
3.3.2.3 Social Landscape
3.3.2.4 Technology Landscape
3.3.3 Value Chain Analysis
3.3.4 Trend Analysis
3.3.5 Gap Analysis
3.3.6 Cost Analysis
4 GLOBAL WASTE TO ENERGY SOLUTIONS MARKET, BY TECHNOLOGY
4.1 Introduction
4.2 Waste to Energy Solutions Market: Technology Scope Key Takeaways
4.3 Revenue Growth Analysis, 2023 & 2029
4.4 Thermal
4.4.1 Thermal Market Estimates and Forecast, 2021-2029 (USD Million)
4.5 Biological
4.5.1 Biological Market Estimates and Forecast, 2021-2029 (USD Million)
5 GLOBAL WASTE TO ENERGY SOLUTIONS MARKET, BY WASTE TYPE
5.1 Introduction
5.2 Waste to Energy Solutions Market: Waste Type Scope Key Takeaways
5.3 Revenue Growth Analysis, 2023 & 2029
5.4 Municipal Solid Waste (MSW)
5.4.1 Municipal Solid Waste (MSW) Market Estimates and Forecast, 2021-2029 (USD Million)
5.5 Industrial Waste
5.5.1 Industrial Waste Market Estimates and Forecast, 2021-2029 (USD Million)
6 GLOBAL WASTE TO ENERGY SOLUTIONS MARKET, BY REGION
6.1 Introduction
6.2 North America Waste to Energy Solutions Market Estimates and Forecast, 2021-2029 (USD Million)
6.2.1 By Technology
6.2.2 By Waste Type
6.2.3 By Country
6.2.3.1 U.S. Waste to Energy Solutions Market Estimates and Forecast, 2021-2029 (USD Million)
6.2.3.1.1 By Technology
6.2.3.1.2 By Waste Type
6.2.3.2 Canada Waste to Energy Solutions Market Estimates and Forecast, 2021-2029 (USD Million)
6.2.3.2.1 By Technology
6.2.3.2.2 By Waste Type
6.2.3.3 Mexico Waste to Energy Solutions Market Estimates and Forecast, 2021-2029 (USD Million)
6.2.3.3.1 By Technology
6.2.3.3.2 By Waste Type
6.3 Europe Waste to Energy Solutions Market Estimates and Forecast, 2021-2029 (USD Million)
6.3.1 By Technology
6.3.2 By Waste Type
6.3.3 By Country
6.3.3.1 Germany Waste to Energy Solutions Market Estimates and Forecast, 2021-2029 (USD Million)
6.3.3.1.1 By Technology
6.3.3.1.2 By Waste Type
6.3.3.2 U.K. Waste to Energy Solutions Market Estimates and Forecast, 2021-2029 (USD Million)
6.3.3.2.1 By Technology
6.3.3.2.2 By Waste Type
6.3.3.3 France Waste to Energy Solutions Market Estimates and Forecast, 2021-2029 (USD Million)
6.3.3.3.1 By Technology
6.3.3.3.2 By Waste Type
6.3.3.4 Italy Waste to Energy Solutions Market Estimates and Forecast, 2021-2029 (USD Million)
6.3.3.4.1 By Technology
6.3.3.4.2 By Waste Type
6.3.3.5 Spain Waste to Energy Solutions Market Estimates and Forecast, 2021-2029 (USD Million)
6.3.3.5.1 By Technology
6.3.3.5.2 By Waste Type
6.3.3.6 Netherlands Waste to Energy Solutions Market Estimates and Forecast, 2021-2029 (USD Million)
6.3.3.6.1 By Technology
6.3.3.6.2 By Waste Type
6.3.3.7 Rest of Europe Waste to Energy Solutions Market Estimates and Forecast, 2021-2029 (USD Million)
6.3.3.6.1 By Technology
6.3.3.6.2 By Waste Type
6.4 Asia Pacific Waste to Energy Solutions Market Estimates and Forecast, 2021-2029 (USD Million)
6.4.1 By Technology
6.4.2 By Waste Type
6.4.3 By Country
6.4.3.1 China Waste to Energy Solutions Market Estimates and Forecast, 2021-2029 (USD Million)
6.4.3.1.1 By Technology
6.4.3.1.2 By Waste Type
6.4.3.2 Japan Waste to Energy Solutions Market Estimates and Forecast, 2021-2029 (USD Million)
6.4.3.2.1 By Technology
6.4.3.2.2 By Waste Type
6.4.3.3 India Waste to Energy Solutions Market Estimates and Forecast, 2021-2029 (USD Million)
6.4.3.3.1 By Technology
6.4.3.3.2 By Waste Type
6.4.3.4 South Korea Waste to Energy Solutions Market Estimates and Forecast, 2021-2029 (USD Million)
6.4.3.4.1 By Technology
6.4.3.4.2 By Waste Type
6.4.3.5 Singapore Waste to Energy Solutions Market Estimates and Forecast, 2021-2029 (USD Million)
6.4.3.5.1 By Technology
6.4.3.5.2 By Waste Type
6.4.3.6 Malaysia Waste to Energy Solutions Market Estimates and Forecast, 2021-2029 (USD Million)
6.4.3.6.1 By Technology
6.4.3.6.2 By Waste Type
6.4.3.7 Thailand Waste to Energy Solutions Market Estimates and Forecast, 2021-2029 (USD Million)
6.4.3.6.1 By Technology
6.4.3.6.2 By Waste Type
6.4.3.8 Indonesia Waste to Energy Solutions Market Estimates and Forecast, 2021-2029 (USD Million)
6.4.3.7.1 By Technology
6.4.3.7.2 By Waste Type
6.4.3.9 Vietnam Waste to Energy Solutions Market Estimates and Forecast, 2021-2029 (USD Million)
6.4.3.8.1 By Technology
6.4.3.8.2 By Waste Type
6.4.3.10 Taiwan Waste to Energy Solutions Market Estimates and Forecast, 2021-2029 (USD Million)
6.4.3.10.1 By Technology
6.4.3.10.2 By Waste Type
6.4.3.11 Rest of Asia Pacific Waste to Energy Solutions Market Estimates and Forecast, 2021-2029 (USD Million)
6.4.3.11.1 By Technology
6.4.3.11.2 By Waste Type
6.5 Middle East and Africa Waste to Energy Solutions Market Estimates and Forecast, 2021-2029 (USD Million)
6.5.1 By Technology
6.5.2 By Waste Type
6.5.3 By Country
6.5.3.1 Saudi Arabia Waste to Energy Solutions Market Estimates and Forecast, 2021-2029 (USD Million)
6.5.3.1.1 By Technology
6.5.3.1.2 By Waste Type
6.5.3.2 U.A.E. Waste to Energy Solutions Market Estimates and Forecast, 2021-2029 (USD Million)
6.5.3.2.1 By Technology
6.5.3.2.2 By Waste Type
6.5.3.3 Israel Waste to Energy Solutions Market Estimates and Forecast, 2021-2029 (USD Million)
6.5.3.3.1 By Technology
6.5.3.3.2 By Waste Type
6.5.3.4 South Africa Waste to Energy Solutions Market Estimates and Forecast, 2021-2029 (USD Million)
6.5.3.4.1 By Technology
6.5.3.4.2 By Waste Type
6.5.3.5 Rest of Middle East and Africa Waste to Energy Solutions Market Estimates and Forecast, 2021-2029 (USD Million)
6.5.3.5.1 By Technology
6.5.3.5.2 By Waste Type
6.6 Central and South America Waste to Energy Solutions Market Estimates and Forecast, 2021-2029 (USD Million)
6.6.1 By Technology
6.6.2 By Waste Type
6.6.3 By Country
6.6.3.1 Brazil Waste to Energy Solutions Market Estimates and Forecast, 2021-2029 (USD Million)
6.6.3.1.1 By Technology
6.6.3.1.2 By Waste Type
6.6.3.2 Argentina Waste to Energy Solutions Market Estimates and Forecast, 2021-2029 (USD Million)
6.6.3.2.1 By Technology
6.6.3.2.2 By Waste Type
6.6.3.3 Chile Waste to Energy Solutions Market Estimates and Forecast, 2021-2029 (USD Million)
6.6.3.3.1 By Technology
6.6.3.3.2 By Waste Type
6.6.3.3 Rest of Central and South America Waste to Energy Solutions Market Estimates and Forecast, 2021-2029 (USD Million)
6.6.3.3.1 By Technology
6.6.3.3.2 By Waste Type
7 COMPETITIVE LANDCAPE
7.1 Company Market Share Analysis
7.2 Four Quadrant Positioning Matrix
7.2.1 Market Leaders
7.2.2 Market Visionaries
7.2.3 Market Challengers
7.2.4 Niche Market Players
7.3 Vendor Landscape
7.3.1 North America
7.3.2 Europe
7.3.3 Asia Pacific
7.3.4 Rest of the World
7.4 Company Profiles
7.4.1 SUEZ
7.4.1.1 Business Description & Financial Analysis
7.4.1.2 SWOT Analysis
7.4.1.3 Products & Services Offered
7.4.1.4 Strategic Alliances between Business Partners
7.4.2 Covanta Energy Corporation
7.4.2.1 Business Description & Financial Analysis
7.4.2.2 SWOT Analysis
7.4.2.3 Products & Services Offered
7.4.2.4 Strategic Alliances between Business Partners
7.4.3 Veolia Environnement S.A.
7.4.3.1 Business Description & Financial Analysis
7.4.3.2 SWOT Analysis
7.4.3.3 Products & Services Offered
7.4.3.4 Strategic Alliances between Business Partners
7.4.4 Waste Management, Inc.
7.4.4.1 Business Description & Financial Analysis
7.4.4.2 SWOT Analysis
7.4.4.3 Products & Services Offered
7.4.4.4 Strategic Alliances between Business Partners
7.4.5 Hitachi Zosen Corporation
7.4.5.1 Business Description & Financial Analysis
7.4.5.2 SWOT Analysis
7.4.5.3 Products & Services Offered
7.4.5.4 Strategic Alliances between Business Partners
7.4.6 Wheelabrator Technologies Inc.
7.4.6.1 Business Description & Financial Analysis
7.4.6.2 SWOT Analysis
7.4.6.3 Products & Services Offered
7.4.6.4 Strategic Alliances between Business Partners
7.4.7 Mitsubishi Heavy Industries Environmental & Chemical Engineering Co., Ltd.
7.4.7.1 Business Description & Financial Analysis
7.4.7.2 SWOT Analysis
7.4.7.3 Products & Services Offered
7.4.7.4 Strategic Alliances between Business Partners
7.4.8 Xcel Energy Inc.
7.4.8.1 Business Description & Financial Analysis
7.4.8.2 SWOT Analysis
7.4.8.3 Products & Services Offered
7.4.8.4 Strategic Alliances between Business Partners
7.4.9 Babcock & Wilcox Enterprises, Inc.
7.4.9.1 Business Description & Financial Analysis
7.4.9.2 SWOT Analysis
7.4.9.3 Products & Services Offered
7.4.9.4 Strategic Alliances between Business Partners
7.4.10 Hitachi Zosen Inova AG
7.4.10.1 Business Description & Financial Analysis
7.4.10.2 SWOT Analysis
7.4.10.3 Products & Services Offered
7.4.10.4 Strategic Alliances between Business Partners
7.4.11 Keppel Seghers
7.4.11.1 Business Description & Financial Analysis
7.4.11.2 SWOT Analysis
7.4.11.3 Products & Services Offered
7.4.11.4 Strategic Alliances between Business Partners
7.4.12 Waste Connections, Inc.
7.4.12.1 Business Description & Financial Analysis
7.4.12.2 SWOT Analysis
7.4.12.3 Products & Services Offered
7.4.12.4 Strategic Alliances between Business Partners
7.4.13 China Everbright International Limited
7.4.13.1 Business Description & Financial Analysis
7.4.13.2 SWOT Analysis
7.4.13.3 Products & Services Offered
7.4.13.4 Strategic Alliances between Business Partners
7.4.14 Amec Foster Wheeler
7.4.14.1 Business Description & Financial Analysis
7.4.14.2 SWOT Analysis
7.4.14.3 Products & Services Offered
7.4.14.4 Strategic Alliances between Business Partners
7.4.15 Plasco Conversion Technologies Inc.
7.4.15.1 Business Description & Financial Analysis
7.4.15.2 SWOT Analysis
7.4.15.3 Products & Services Offered
7.4.15.4 Strategic Alliances between Business Partners
7.4.16 Constructions Industrielles de la Méditerranée
7.4.16.1 Business Description & Financial Analysis
7.4.16.2 SWOT Analysis
7.4.16.3 Products & Services Offered
7.4.16.4 Strategic Alliances between Business Partners
7.4.17 Foster Wheeler AG
7.4.17.1 Business Description & Financial Analysis
7.4.17.2 SWOT Analysis
7.4.17.3 Products & Services Offered
7.4.17.4 Strategic Alliances between Business Partners
7.4.18 Biomass Secure Power Inc.
7.4.18.1 Business Description & Financial Analysis
7.4.18.2 SWOT Analysis
7.4.18.3 Products & Services Offered
7.4.18.4 Strategic Alliances between Business Partners
7.4.19 Green Conversion Systems, Inc.
7.4.19.1 Business Description & Financial Analysis
7.4.19.2 SWOT Analysis
7.4.19.3 Products & Services Offered
7.4.19.4 Strategic Alliances between Business Partners
7.4.20 Ramboll Group A/S
7.4.20.1 Business Description & Financial Analysis
7.4.20.2 SWOT Analysis
7.4.20.3 Products & Services Offered
7.4.20.4 Strategic Alliances between Business Partners
7.4.21 Other Companies
7.4.21.1 Business Description & Financial Analysis
7.4.21.2 SWOT Analysis
7.4.21.3 Products & Services Offered
7.4.21.4 Strategic Alliances between Business Partners
8 RESEARCH METHODOLOGY
8.1 Market Introduction
8.1.1 Market Definition
8.1.2 Market Scope & Segmentation
8.2 Information Procurement
8.2.1 Secondary Research
8.2.1.1 Purchased Databases
8.2.1.2 GMEs Internal Data Repository
8.2.1.3 Secondary Resources & Third Party Perspectives
8.2.1.4 Company Information Sources
8.2.2 Primary Research
8.2.2.1 Various Types of Respondents for Primary Interviews
8.2.2.2 Number of Interviews Conducted throughout the Research Process
8.2.2.3 Primary Stakeholders
8.2.2.4 Discussion Guide for Primary Participants
8.2.3 Expert Panels
8.2.3.1 Expert Panels Across 30+ Industry
8.2.4 Paid Local Experts
8.2.4.1 Paid Local Experts Across 30+ Industry Across each Region
8.3 Market Estimation
8.3.1 Top-Down Approach
8.3.1.1 Macro-Economic Indicators Considered
8.3.1.2 Micro-Economic Indicators Considered
8.3.2 Bottom Up Approach
8.3.2.1 Company Share Analysis Approach
8.3.2.2 Estimation of Potential Product Sales
8.4 Data Triangulation
8.4.1 Data Collection
8.4.2 Time Series, Cross Sectional & Panel Data Analysis
8.4.3 Cluster Analysis
8.5 Analysis and Output
8.5.1 Inhouse AI Based Real Time Analytics Tool
8.5.2 Output From Desk & Primary Research
8.6 Research Assumptions & Limitations
8.6.1 Research Assumptions
8.6.2 Research Limitations
LIST OF TABLES
1 Global Waste to Energy Solutions Market, By Technology, 2021-2029 (USD Mllion)
2 Thermal Market, By Region, 2021-2029 (USD Mllion)
3 Biological Market, By Region, 2021-2029 (USD Mllion)
4 Global Waste to Energy Solutions Market, By Waste Type, 2021-2029 (USD Mllion)
5 Municipal Solid Waste (MSW) Market, By Region, 2021-2029 (USD Mllion)
6 Industrial Waste Market, By Region, 2021-2029 (USD Mllion)
7 Regional Analysis, 2021-2029 (USD Mllion)
8 North America Waste to Energy Solutions Market, By Technology, 2021-2029 (USD Mllion)
9 North America Waste to Energy Solutions Market, By Waste Type, 2021-2029 (USD Mllion)
10 North America Waste to Energy Solutions Market, By COUNTRY, 2021-2029 (USD Mllion)
11 U.S. Waste to Energy Solutions Market, By Technology, 2021-2029 (USD Mllion)
12 U.S. Waste to Energy Solutions Market, By Waste Type, 2021-2029 (USD Mllion)
13 Canada Waste to Energy Solutions Market, By Technology, 2021-2029 (USD Mllion)
14 Canada Waste to Energy Solutions Market, By Waste Type, 2021-2029 (USD Mllion)
15 Mexico Waste to Energy Solutions Market, By Technology, 2021-2029 (USD Mllion)
16 Mexico Waste to Energy Solutions Market, By Waste Type, 2021-2029 (USD Mllion)
17 Europe Waste to Energy Solutions Market, By Technology, 2021-2029 (USD Mllion)
18 Europe Waste to Energy Solutions Market, By Waste Type, 2021-2029 (USD Mllion)
19 Europe Waste to Energy Solutions Market, By Country, 2021-2029 (USD Mllion)
20 GErmany Waste to Energy Solutions Market, By Technology, 2021-2029 (USD Mllion)
21 Germany Waste to Energy Solutions Market, By Waste Type, 2021-2029 (USD Mllion)
22 U.K. Waste to Energy Solutions Market, By Technology, 2021-2029 (USD Mllion)
23 U.K. Waste to Energy Solutions Market, By Waste Type, 2021-2029 (USD Mllion)
24 France Waste to Energy Solutions Market, By Technology, 2021-2029 (USD Mllion)
25 France Waste to Energy Solutions Market, By Waste Type, 2021-2029 (USD Mllion)
26 Italy Waste to Energy Solutions Market, By Technology, 2021-2029 (USD Mllion)
27 Italy Waste to Energy Solutions Market, By Waste Type, 2021-2029 (USD Mllion)
28 Spain Waste to Energy Solutions Market, By Technology, 2021-2029 (USD Mllion)
29 Spain Waste to Energy Solutions Market, By Waste Type, 2021-2029 (USD Mllion)
30 Netherlands Waste to Energy Solutions Market, By Technology, 2021-2029 (USD Mllion)
31 Netherlands Waste to Energy Solutions Market, By Waste Type, 2021-2029 (USD Mllion)
32 Rest Of Europe Waste to Energy Solutions Market, By Technology, 2021-2029 (USD Mllion)
33 Rest Of Europe Waste to Energy Solutions Market, By Waste Type, 2021-2029 (USD Mllion)
34 Asia Pacific Waste to Energy Solutions Market, By Technology, 2021-2029 (USD Mllion)
35 Asia Pacific Waste to Energy Solutions Market, By Waste Type, 2021-2029 (USD Mllion)
36 Asia Pacific Waste to Energy Solutions Market, By Country, 2021-2029 (USD Mllion)
37 China Waste to Energy Solutions Market, By Technology, 2021-2029 (USD Mllion)
38 China Waste to Energy Solutions Market, By Waste Type, 2021-2029 (USD Mllion)
39 Japan Waste to Energy Solutions Market, By Technology, 2021-2029 (USD Mllion)
40 Japan Waste to Energy Solutions Market, By Waste Type, 2021-2029 (USD Mllion)
41 India Waste to Energy Solutions Market, By Technology, 2021-2029 (USD Mllion)
42 India Waste to Energy Solutions Market, By Waste Type, 2021-2029 (USD Mllion)
43 South Korea Waste to Energy Solutions Market, By Technology, 2021-2029 (USD Mllion)
44 South Korea Waste to Energy Solutions Market, By Waste Type, 2021-2029 (USD Mllion)
45 Singapore Waste to Energy Solutions Market, By Technology, 2021-2029 (USD Mllion)
46 Singapore Waste to Energy Solutions Market, By Waste Type, 2021-2029 (USD Mllion)
47 Thailand Waste to Energy Solutions Market, By Technology, 2021-2029 (USD Mllion)
48 Thailand Waste to Energy Solutions Market, By Waste Type, 2021-2029 (USD Mllion)
49 Malaysia Waste to Energy Solutions Market, By Technology, 2021-2029 (USD Mllion)
50 Malaysia Waste to Energy Solutions Market, By Waste Type, 2021-2029 (USD Mllion)
51 Indonesia Waste to Energy Solutions Market, By Technology, 2021-2029 (USD Mllion)
52 Indonesia Waste to Energy Solutions Market, By Waste Type, 2021-2029 (USD Mllion)
53 Vietnam Waste to Energy Solutions Market, By Technology, 2021-2029 (USD Mllion)
54 Vietnam Waste to Energy Solutions Market, By Waste Type, 2021-2029 (USD Mllion)
55 Taiwan Waste to Energy Solutions Market, By Technology, 2021-2029 (USD Mllion)
56 Taiwan Waste to Energy Solutions Market, By Waste Type, 2021-2029 (USD Mllion)
57 Rest of APAC Waste to Energy Solutions Market, By Technology, 2021-2029 (USD Mllion)
58 Rest of APAC Waste to Energy Solutions Market, By Waste Type, 2021-2029 (USD Mllion)
59 Middle East and Africa Waste to Energy Solutions Market, By Technology, 2021-2029 (USD Mllion)
60 Middle East and Africa Waste to Energy Solutions Market, By Waste Type, 2021-2029 (USD Mllion)
61 Middle East and Africa Waste to Energy Solutions Market, By Country, 2021-2029 (USD Mllion)
62 Saudi Arabia Waste to Energy Solutions Market, By Technology, 2021-2029 (USD Mllion)
63 Saudi Arabia Waste to Energy Solutions Market, By Waste Type, 2021-2029 (USD Mllion)
64 UAE Waste to Energy Solutions Market, By Technology, 2021-2029 (USD Mllion)
65 UAE Waste to Energy Solutions Market, By Waste Type, 2021-2029 (USD Mllion)
66 Israel Waste to Energy Solutions Market, By Technology, 2021-2029 (USD Mllion)
67 Israel Waste to Energy Solutions Market, By Waste Type, 2021-2029 (USD Mllion)
68 South Africa Waste to Energy Solutions Market, By Technology, 2021-2029 (USD Mllion)
69 South Africa Waste to Energy Solutions Market, By Waste Type, 2021-2029 (USD Mllion)
70 Rest Of Middle East and Africa Waste to Energy Solutions Market, By Technology, 2021-2029 (USD Mllion)
71 Rest Of Middle East and Africa Waste to Energy Solutions Market, By Waste Type, 2021-2029 (USD Mllion)
72 Central and South America Waste to Energy Solutions Market, By Technology, 2021-2029 (USD Mllion)
73 Central and South America Waste to Energy Solutions Market, By Waste Type, 2021-2029 (USD Mllion)
74 Central and South America Waste to Energy Solutions Market, By Country, 2021-2029 (USD Mllion)
75 Brazil Waste to Energy Solutions Market, By Technology, 2021-2029 (USD Mllion)
76 Brazil Waste to Energy Solutions Market, By Waste Type, 2021-2029 (USD Mllion)
77 Chile Waste to Energy Solutions Market, By Technology, 2021-2029 (USD Mllion)
78 Chile Waste to Energy Solutions Market, By Waste Type, 2021-2029 (USD Mllion)
79 Argentina Waste to Energy Solutions Market, By Technology, 2021-2029 (USD Mllion)
80 ArGentina Waste to Energy Solutions Market, By Waste Type, 2021-2029 (USD Mllion)
81 Rest Of Central and South America Waste to Energy Solutions Market, By Technology, 2021-2029 (USD Mllion)
82 Rest Of Central and South America Waste to Energy Solutions Market, By Waste Type, 2021-2029 (USD Mllion)
83 SUEZ: Products & Services Offering
84 Covanta Energy Corporation: Products & Services Offering
85 Veolia Environnement S.A.: Products & Services Offering
86 Waste Management, Inc. : Products & Services Offering
87 Hitachi Zosen Corporation: Products & Services Offering
88 WHEELABRATOR TECHNOLOGIES INC.: Products & Services Offering
89 Mitsubishi Heavy Industries Environmental & Chemical Engineering Co., Ltd. : Products & Services Offering
90 Xcel Energy Inc.: Products & Services Offering
91 Babcock & Wilcox Enterprises, Inc., Inc: Products & Services Offering
92 Hitachi Zosen Inova AG: Products & Services Offering
93 Ramboll Group A/S : Products & Services Offering
94 Green Conversion Systems, Inc.: Products & Services Offering
95 Biomass Secure Power Inc.: Products & Services Offering
96 Foster Wheeler AG: Products & Services Offering
97 Constructions Industrielles de la Méditerranée: Products & Services Offering
98 Plasco Conversion Technologies Inc.: Products & Services Offering
99 Amec Foster Wheeler : Products & Services Offering
100 China Everbright International Limited: Products & Services Offering
101 WASTE CONNECTIONS, INC. : Products & Services Offering
102 Keppel Seghers: Products & Services Offering
103 Other Companies: Products & Services Offering
LIST OF FIGURES
1 Global Waste to Energy Solutions Market Overview
2 Global Waste to Energy Solutions Market Value From 2021-2029 (USD Mllion)
3 Global Waste to Energy Solutions Market Share, By Technology (2023)
4 Global Waste to Energy Solutions Market Share, By Waste Type (2023)
5 Global Waste to Energy Solutions Market, By Region (Asia Pacific Market)
6 Technological Trends In Global Waste to Energy Solutions Market
7 Four Quadrant Competitor Positioning Matrix
8 Impact Of Macro & Micro Indicators On The Market
9 Impact Of Key Drivers On The Global Waste to Energy Solutions Market
10 Impact Of Challenges On The Global Waste to Energy Solutions Market
11 Porter’s Five Forces Analysis
12 Global Waste to Energy Solutions Market: By Technology Scope Key Takeaways
13 Global Waste to Energy Solutions Market, By Technology Segment: Revenue Growth Analysis
14 Thermal Market, By Region, 2021-2029 (USD Mllion)
15 Biological Market, By Region, 2021-2029 (USD Mllion)
16 Global Waste to Energy Solutions Market: By Waste Type Scope Key Takeaways
17 Global Waste to Energy Solutions Market, By Waste Type Segment: Revenue Growth Analysis
18 Municipal Solid Waste (MSW) Market, By Region, 2021-2029 (USD Mllion)
19 Industrial Waste Market, By Region, 2021-2029 (USD Mllion)
20 Regional Segment: Revenue Growth Analysis
21 Global Waste to Energy Solutions Market: Regional Analysis
22 North America Waste to Energy Solutions Market Overview
23 North America Waste to Energy Solutions Market, By Technology
24 North America Waste to Energy Solutions Market, By Waste Type
25 North America Waste to Energy Solutions Market, By Country
26 U.S. Waste to Energy Solutions Market, By Technology
27 U.S. Waste to Energy Solutions Market, By Waste Type
28 Canada Waste to Energy Solutions Market, By Technology
29 Canada Waste to Energy Solutions Market, By Waste Type
30 Mexico Waste to Energy Solutions Market, By Technology
31 Mexico Waste to Energy Solutions Market, By Waste Type
32 Four Quadrant Positioning Matrix
33 Company Market Share Analysis
34 SUEZ: Company Snapshot
35 SUEZ: SWOT Analysis
36 SUEZ: Geographic
37 Covanta Energy Corporation: Company Snapshot
38 Covanta Energy Corporation: SWOT Analysis
39 Covanta Energy Corporation: Geographic
40 Veolia Environnement S.A.: Company Snapshot
41 Veolia Environnement S.A.: SWOT Analysis
42 Veolia Environnement S.A.: Geographic
43 Waste Management, Inc. : Company Snapshot
44 Waste Management, Inc. : Swot Analysis
45 Waste Management, Inc. : Geographic
46 Hitachi Zosen Corporation: Company Snapshot
47 Hitachi Zosen Corporation: SWOT Analysis
48 Hitachi Zosen Corporation: Geographic
49 Wheelabrator Technologies Inc.: Company Snapshot
50 Wheelabrator Technologies Inc.: SWOT Analysis
51 Wheelabrator Technologies Inc.: Geographic
52 Mitsubishi Heavy Industries Environmental & Chemical Engineering Co., Ltd. : Company Snapshot
53 Mitsubishi Heavy Industries Environmental & Chemical Engineering Co., Ltd. : SWOT Analysis
54 Mitsubishi Heavy Industries Environmental & Chemical Engineering Co., Ltd. : Geographic
55 Xcel Energy Inc.: Company Snapshot
56 Xcel Energy Inc.: SWOT Analysis
57 Xcel Energy Inc.: Geographic
58 Babcock & Wilcox Enterprises, Inc., Inc.: Company Snapshot
59 Babcock & Wilcox Enterprises, Inc., Inc.: SWOT Analysis
60 Babcock & Wilcox Enterprises, Inc., Inc.: Geographic
61 Hitachi Zosen Inova AG: Company Snapshot
62 Hitachi Zosen Inova AG: SWOT Analysis
63 Hitachi Zosen Inova AG: Geographic
64 Ramboll Group A/S : Company Snapshot
65 Ramboll Group A/S : SWOT Analysis
66 Ramboll Group A/S : Geographic
67 Green Conversion Systems, Inc.: Company Snapshot
68 Green Conversion Systems, Inc.: SWOT Analysis
69 Green Conversion Systems, Inc.: Geographic
70 Biomass Secure Power Inc.: Company Snapshot
71 Biomass Secure Power Inc.: SWOT Analysis
72 Biomass Secure Power Inc.: Geographic
73 Foster Wheeler AG: Company Snapshot
74 Foster Wheeler AG: SWOT Analysis
75 Foster Wheeler AG: Geographic
76 Constructions Industrielles de la Méditerranée: Company Snapshot
77 Constructions Industrielles de la Méditerranée: SWOT Analysis
78 Constructions Industrielles de la Méditerranée: Geographic
79 Plasco Conversion Technologies Inc.: Company Snapshot
80 Plasco Conversion Technologies Inc.: SWOT Analysis
81 Plasco Conversion Technologies Inc.: Geographic
82 Amec Foster Wheeler : Company Snapshot
83 Amec Foster Wheeler : SWOT Analysis
84 Amec Foster Wheeler : Geographic
85 China Everbright International Limited: Company Snapshot
86 China Everbright International Limited: SWOT Analysis
87 China Everbright International Limited: Geographic
88 Waste Connections, Inc. : Company Snapshot
89 Waste Connections, Inc. : SWOT Analysis
90 Waste Connections, Inc. : Geographic
91 Keppel Seghers: Company Snapshot
92 Keppel Seghers: SWOT Analysis
93 Keppel Seghers: Geographic
94 Other Companies: Company Snapshot
95 Other Companies: SWOT Analysis
96 Other Companies: Geographic
The Global Waste to Energy Solutions Market has been studied from the year 2019 till 2029. However, the CAGR provided in the report is from the year 2024 to 2029. The research methodology involved three stages: Desk research, Primary research, and Analysis & Output from the entire research process.

The desk research involved a robust background study which meant referring to paid and unpaid databases to understand the market dynamics; mapping contracts from press releases; identifying the key players in the market, studying their product portfolio, competition level, annual reports/SEC filings & investor presentations; and learning the demand and supply-side analysis for the Waste to Energy Solutions Market.

The primary research activity included telephonic conversations with more than 50 tier 1 industry consultants, distributors, and end-use product manufacturers.

Finally, based on the above thorough research process, an in-depth analysis was carried out considering the following aspects: market attractiveness, current & future market trends, market share analysis, SWOT analysis of the company and customer analytics.

Frequently Asked Questions

This FREE sample includes market data points, ranging from trend analyses to market estimates & forecasts. See for yourself.
Or view our licence options:
Tailor made solutions just for you
80% of our clients seek made-to-order reports. How do you want us to tailor yours?
OUR CLIENTS


