This report was recently updated on May 2 2025 with the latest and most recent
market numbers
Global Vision Sensors Market Size, Trends & Analysis - Forecasts to 2029 By Type (Less than 3D and 3D), By End User (Automotive, Electronics & Semiconductor, Pharmaceuticals, and Others), By Application Type (Inspection, Gauging, Code Reading, and Localization), and By Region (North America, Asia Pacific, Central and South America, Europe, and Middle East and Africa), Competitive Landscape, Company Market Share Analysis, and End User Analysis
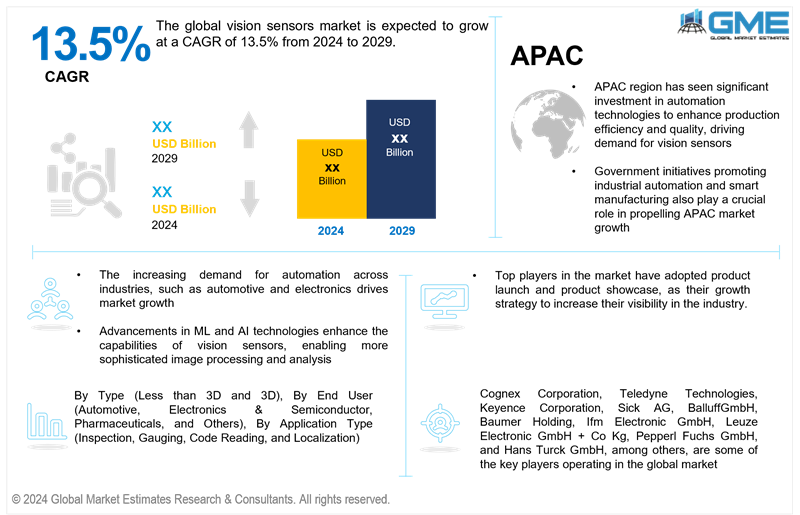
The global vision sensors market is expected to exhibit a CAGR of 13.5% from 2024 to 2029. Vision sensors are devices that capture visual information from the environment, typically using cameras, and process it to extract relevant data. They are used in various applications such as robotics, industrial automation, and surveillance to detect, analyze, and interpret visual stimuli for decision-making or control purposes.
Several market drivers influence the growth of the global vision sensors market. The increasing demand for automation across industries, such as automotive, electronics, and manufacturing, fuels the adoption of vision sensors for quality control and inspection tasks. Advancements in ML and AI technologies enhance the capabilities of vision sensors, enabling more sophisticated image processing and analysis. Additionally, the growing need for real-time monitoring and surveillance in security and surveillance applications contributes to market growth. Furthermore, the declining cost of vision sensor components and the rising trend of Industry 4.0 further propel the market expansion as businesses seek to improve efficiency and productivity through smart sensor integration.
Market restraints in the global vision sensors market include high initial investment costs, complexities integrating with existing systems, and the need for skilled personnel to manage advanced sensor technologies. Additionally, concerns over data privacy and security also pose significant challenges to widespread adoption.
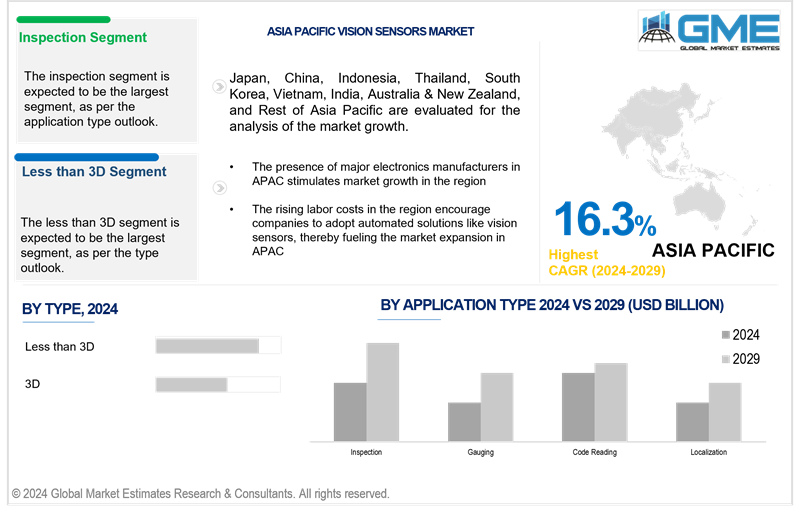
Based on the type, the market is segmented into less than 3D and 3D. The less than 3D segment is expected to be the largest and fastest-growing segment during the forecast period. This is primarily because these sensors are simpler, more cost-effective, and sufficient for various applications. They effectively handle tasks like presence/absence detection, part identification, and basic measurement without the complexity and expense of 3D technologies. This makes them a popular choice among manufacturers prioritizing affordability and ease of integration into existing systems.
On the basis of end user, the market is segmented into automotive, electronics & semiconductor, pharmaceuticals, and others. The automotive segment is expected to be the largest segment during the forecast period. Vision sensors facilitate precise assembly line operations, quality inspections, and the integration of advanced driver-assistance systems (ADAS), which rely on real-time image processing for features like lane departure warnings and automated parking, driving demand in this sector.
The electronics & semiconductors segment is expected to be the fastest-growing segment in the global vision sensors market during the forecast period. Vision sensors ensure accuracy in assembly lines, detect defects, and verify component placement, which is crucial for maintaining high standards. The rapid innovation cycles in this industry also drive the adoption of advanced vision technologies to keep up with evolving product complexities and miniaturization trends.
Based on application type, the market is segmented into inspection, gauging, code reading, and localization. The inspection segment is expected to be the market's largest segment over the forecast period. Vision sensors efficiently detect defects, ensure product consistency, and verify assembly accuracy, which is essential for upholding high standards in production lines. Their ability to automate these tasks reduces human error and increases throughput, making them invaluable in industries striving for precision and reliability.
The gauging segment is expected to be the fastest-growing segment in the global vision sensors market during the forecast period. Industries such as automotive, electronics, and aerospace rely heavily on accurate measurements to maintain product quality and consistency. Vision sensors enable precise and rapid dimensioning and positioning of components, supporting automation and reducing human error. This demand for high accuracy in production lines drives the rapid adoption of vision sensors for gauging tasks, contributing to the segment's swift growth.
North America is expected to hold the largest share of the global vision sensors market during the forecast period. The region's focus on manufacturing automation, robust automotive industry, and significant investments in AI and IoT technologies drive the demand for vision sensors. Furthermore, the presence of major technology companies and their continuous R&D efforts contribute to the development and uptake of cutting-edge vision sensor solutions.
Asia Pacific is expected to be the fastest-growing region in the global vision sensors market during the forecast period. This region has seen significant investment in automation technologies to enhance production efficiency and quality, driving demand for vision sensors. Additionally, the presence of major electronics manufacturers in APAC, who increasingly integrate vision sensors in devices such as smartphones and cameras, further stimulates market growth. Government initiatives promoting industrial automation and smart manufacturing also play a crucial role. Moreover, the rising labor costs in the region encourage companies to adopt automated solutions, including vision sensors, to remain competitive, thereby fueling the market expansion in APAC.
Cognex Corporation, Teledyne Technologies, Keyence Corporation, Sick AG, BalluffGmbH, Baumer Holding, Ifm Electronic GmbH, Leuze Electronic GmbH + Co Kg, Pepperl Fuchs GmbH, and Hans Turck GmbH, among others, are some of the key players operating in the global market.
Please note: This is not an exhaustive list of companies profiled in the report.
In April 2024, Cognex Corporation introduced the In-Sight L38 3D Vision System, a combination of AI, 2D, and 3D vision technologies designed for inspection and measurement applications. The system creates unique projection images, revealing features not visible with traditional 2D imaging, and uses AI tools for feature detection.
In October 2023, Prophesee SA introduced the GenX320 Event-based Metavision sensor, the first event-based vision sensor designed for ultra-low-power Edge AI vision devices. This 5th-generation sensor, available in a 3x4mm die size, expands the company's technology platform to various intelligent Edge market segments, including AR/VR headsets, security systems, touchless displays, eye-tracking features, and IoT devices.
1 STRATEGIC INSIGHTS ON NEW REVENUE POCKETS
1.1 Strategic Opportunity & Attractiveness Analysis
1.1.1 Hot Revenue Pockets
1.1.2 Market Attractiveness Score
1.1.3 Revenue Impacting Opportunity
1.1.4 High Growing Region/Country
1.1.5 Competitor Analysis
1.1.6 Consumer Analysis
1.2 Global Market Estimates' View
1.3 Strategic Insights across Business Functions
1.3.1 For Chief Executive Officers
1.3.2 For Chief Marketing Officers
1.3.3 For Chief Strategy Officers
1.4 Evaluate the Potential of your Existing Business Lines vs. New Lines to Enter Into
2 TECHNOLOGICAL TRENDS
2.1 Technological Adoption Rate
2.2 Current Trend Impact Analysis
2.3 Future Trend Impact Analysis
3.1 Market Pyramid Analysis
3.1.1 Introduction
3.1.2 Adjacent Market Opportunities
3.1.3 Ancillary Market Opportunities
3.2 Demand Side Analysis
3.2.1 Market Drivers: Impact Analysis
3.2.2 Market Restraints: Impact Analysis
3.2.3 Market Opportunities: Impact Analysis
3.2.4 Market Challenges: Impact Analysis
3.3 Supply Side Analysis
3.3.1 Porter’s Five Forces Analysis
3.3.1.1 Threat of New Entrants
3.3.1.2 Threat of New Substitutes
3.3.1.3 Bargaining Power of Suppliers
3.3.1.4 Bargaining Power of Buyers
3.3.1.5 Intensity of Competitive Rivalry
3.3.2 SWOT Analysis; By Factor (Political & Legal, Economic, and Technological)
3.3.2.1 Political Landscape
3.3.2.2 Economic Landscape
3.3.2.3 Social Landscape
3.3.2.4 Technology Landscape
3.3.3 Value Chain Analysis
3.3.4 Trend Analysis
3.3.5 Gap Analysis
3.3.6 Cost Analysis
4 GLOBAL VISION SENSORS MARKET, BY TYPE
4.1 Introduction
4.2 Vision Sensors Market: Type Scope Key Takeaways
4.3 Revenue Growth Analysis, 2023 & 2029
4.4 Less than 3D
4.4.1 Less than 3D Market Estimates and Forecast, 2021-2029 (USD Billion)
4.5 3D
4.5.1 3D Market Estimates and Forecast, 2021-2029 (USD Billion)
5 GLOBAL VISION SENSORS MARKET, BY APPLICATION TYPE
5.1 Introduction
5.2 Vision Sensors Market: Application Type Scope Key Takeaways
5.3 Revenue Growth Analysis, 2023 & 2029
5.4 Inspection
5.4.1 Inspection Market Estimates and Forecast, 2021-2029 (USD Billion)
5.5 Gauging
5.5.1 Gauging Market Estimates and Forecast, 2021-2029 (USD Billion)
5.6 Code Reading
5.6.1 Code Reading Market Estimates and Forecast, 2021-2029 (USD Billion)
5.7 Localization
5.7.1 Localization Market Estimates and Forecast, 2021-2029 (USD Billion)
6 GLOBAL VISION SENSORS MARKET, BY END USER
6.1 Introduction
6.2 Vision Sensors Market: End User Scope Key Takeaways
6.3 Revenue Growth Analysis, 2023 & 2029
6.4 Automotive
6.4.1 Automotive Market Estimates and Forecast, 2021-2029 (USD Billion)
6.5 Electronics & Semiconductors
6.5.1 Electronics & Semiconductors Market Estimates and Forecast, 2021-2029 (USD Billion)
6.6 Pharmaceuticals
6.6.1 Pharmaceuticals Market Estimates and Forecast, 2021-2029 (USD Billion)
6.7 Others
6.7.1 Others Market Estimates and Forecast, 2021-2029 (USD Billion)
7 GLOBAL VISION SENSORS MARKET, BY REGION
7.1 Introduction
7.2 North America Vision Sensors Market Estimates and Forecast, 2021-2029 (USD Billion)
7.2.1 By Type
7.2.2 By Application Type
7.2.3 By End User
7.2.4 By Country
7.2.4.1 U.S. Vision Sensors Market Estimates and Forecast, 2021-2029 (USD Billion)
7.2.4.1.1 By Type
7.2.4.1.2 By Application Type
7.2.4.1.3 By End User
7.2.4.2 Canada Vision Sensors Market Estimates and Forecast, 2021-2029 (USD Billion)
7.2.4.2.1 By Type
7.2.4.2.2 By Application Type
7.2.4.2.3 By End User
7.2.4.3 Mexico Vision Sensors Market Estimates and Forecast, 2021-2029 (USD Billion)
7.2.4.3.1 By Type
7.2.4.3.2 By Application Type
7.2.4.3.3 By End User
7.3 Europe Vision Sensors Market Estimates and Forecast, 2021-2029 (USD Billion)
7.3.1 By Type
7.3.2 By Application Type
7.3.3 By End User
7.3.4 By Country
7.3.4.1 Germany Vision Sensors Market Estimates and Forecast, 2021-2029 (USD Billion)
7.3.4.1.1 By Type
7.3.4.1.2 By Application Type
7.3.4.1.3 By End User
7.3.4.2 U.K. Vision Sensors Market Estimates and Forecast, 2021-2029 (USD Billion)
7.3.4.2.1 By Type
7.3.4.2.2 By Application Type
7.3.4.2.3 By End User
7.3.4.3 France Vision Sensors Market Estimates and Forecast, 2021-2029 (USD Billion)
7.3.4.3.1 By Type
7.3.4.3.2 By Application Type
7.3.4.3.3 By End User
7.3.4.4 Italy Vision Sensors Market Estimates and Forecast, 2021-2029 (USD Billion)
7.3.4.4.1 By Type
7.3.4.4.2 By Application Type
7.2.4.4.3 By End User
7.3.4.5 Spain Vision Sensors Market Estimates and Forecast, 2021-2029 (USD Billion)
7.3.4.5.1 By Type
7.3.4.5.2 By Application Type
7.2.4.5.3 By End User
7.3.4.6 Netherlands Vision Sensors Market Estimates and Forecast, 2021-2029 (USD Billion)
7.3.4.7.1 By Type
7.3.4.7.2 By Application Type
7.2.4.7.3 By End User
7.3.4.7 Rest of Europe Vision Sensors Market Estimates and Forecast, 2021-2029 (USD Billion)
7.3.4.7.1 By Type
7.3.4.7.2 By Application Type
7.2.4.7.3 By End User
7.4 Asia Pacific Vision Sensors Market Estimates and Forecast, 2021-2029 (USD Billion)
7.4.1 By Type
7.4.2 By Application Type
7.4.3 By End User
7.4.4 By Country
7.4.4.1 China Vision Sensors Market Estimates and Forecast, 2021-2029 (USD Billion)
7.4.4.1.1 By Type
7.4.4.1.2 By Application Type
7.4.4.1.3 By End User
7.4.4.2 Japan Vision Sensors Market Estimates and Forecast, 2021-2029 (USD Billion)
7.4.4.2.1 By Type
7.4.4.2.2 By Application Type
7.4.4.2.3 By End User
7.4.4.3 India Vision Sensors Market Estimates and Forecast, 2021-2029 (USD Billion)
7.4.4.3.1 By Type
7.4.4.3.2 By Application Type
7.4.4.3.3 By End User
7.4.4.4 South Korea Vision Sensors Market Estimates and Forecast, 2021-2029 (USD Billion)
7.4.4.4.1 By Type
7.4.4.4.2 By Application Type
7.4.4.4.3 By End User
7.4.4.5 Singapore Vision Sensors Market Estimates and Forecast, 2021-2029 (USD Billion)
7.4.4.5.1 By Type
7.4.4.5.2 By Application Type
7.4.4.5.3 By End User
7.4.4.6 Malaysia Vision Sensors Market Estimates and Forecast, 2021-2029 (USD Billion)
7.4.4.7.1 By Type
7.4.4.7.2 By Application Type
7.4.4.7.3 By End User
7.4.4.7 Thailand Vision Sensors Market Estimates and Forecast, 2021-2029 (USD Billion)
7.4.4.7.1 By Type
7.4.4.7.2 By Application Type
7.4.4.7.3 By End User
7.4.4.8 Indonesia Vision Sensors Market Estimates and Forecast, 2021-2029 (USD Billion)
7.4.4.8.1 By Type
7.4.4.8.2 By Application Type
7.4.4.8.3 By End User
7.4.4.9 Vietnam Vision Sensors Market Estimates and Forecast, 2021-2029 (USD Billion)
7.4.4.9.1 By Type
7.4.4.9.2 By Application Type
7.4.4.9.3 By End User
7.4.4.10 Taiwan Vision Sensors Market Estimates and Forecast, 2021-2029 (USD Billion)
7.4.4.10.1 By Type
7.4.4.10.2 By Application Type
7.4.4.10.3 By End User
7.4.4.11 Rest of Asia Pacific Vision Sensors Market Estimates and Forecast, 2021-2029 (USD Billion)
7.4.4.11.1 By Type
7.4.4.11.2 By Application Type
7.4.4.11.3 By End User
7.5 Middle East and Africa Vision Sensors Market Estimates and Forecast, 2021-2029 (USD Billion)
7.5.1 By Type
7.5.2 By Application Type
7.5.3 By End User
7.5.4 By Country
7.5.4.1 Saudi Arabia Vision Sensors Market Estimates and Forecast, 2021-2029 (USD Billion)
7.5.4.1.1 By Type
7.5.4.1.2 By Application Type
7.5.4.1.3 By End User
7.5.4.2 U.A.E. Vision Sensors Market Estimates and Forecast, 2021-2029 (USD Billion)
7.5.4.2.1 By Type
7.5.4.2.2 By Application Type
7.5.4.2.3 By End User
7.5.4.3 Israel Vision Sensors Market Estimates and Forecast, 2021-2029 (USD Billion)
7.5.4.3.1 By Type
7.5.4.3.2 By Application Type
7.5.4.3.3 By End User
7.5.4.4 South Africa Vision Sensors Market Estimates and Forecast, 2021-2029 (USD Billion)
7.5.4.4.1 By Type
7.5.4.4.2 By Application Type
7.5.4.4.3 By End User
7.5.4.5 Rest of Middle East and Africa Vision Sensors Market Estimates and Forecast, 2021-2029 (USD Billion)
7.5.4.5.1 By Type
7.5.4.5.2 By Application Type
7.5.4.5.2 By End User
7.6 Central and South America Vision Sensors Market Estimates and Forecast, 2021-2029 (USD Billion)
7.7.1 By Type
7.7.2 By Application Type
7.7.3 By End User
7.7.4 By Country
7.7.4.1 Brazil Vision Sensors Market Estimates and Forecast, 2021-2029 (USD Billion)
7.7.4.1.1 By Type
7.7.4.1.2 By Application Type
7.7.4.1.3 By End User
7.7.4.2 Argentina Vision Sensors Market Estimates and Forecast, 2021-2029 (USD Billion)
7.7.4.2.1 By Type
7.7.4.2.2 By Application Type
7.7.4.2.3 By End User
7.7.4.3 Chile Vision Sensors Market Estimates and Forecast, 2021-2029 (USD Billion)
7.7.4.3.1 By Type
7.7.4.3.2 By Application Type
7.7.4.3.3 By End User
7.7.4.4 Rest of Central and South America Vision Sensors Market Estimates and Forecast, 2021-2029 (USD Billion)
7.7.4.4.1 By Type
7.7.4.4.2 By Application Type
7.7.4.4.3 By End User
8 COMPETITIVE LANDCAPE
8.1 Company Market Share Analysis
8.2 Four Quadrant Positioning Matrix
8.2.1 Market Leaders
8.2.2 Market Visionaries
8.2.3 Market Challengers
8.2.4 Niche Market Players
8.3 Vendor Landscape
8.3.1 North America
8.3.2 Europe
8.3.3 Asia Pacific
8.3.4 Rest of the World
8.4 Company Profiles
8.4.1 Cognex Corporation
8.4.1.1 Business Description & Financial Analysis
8.4.1.2 SWOT Analysis
8.4.1.3 Products & Services Offered
8.4.1.4 Strategic Alliances between Business Partners
8.4.2 Teledyne Technologies
8.4.2.1 Business Description & Financial Analysis
8.4.2.2 SWOT Analysis
8.4.2.3 Products & Services Offered
8.4.2.4 Strategic Alliances between Business Partners
8.4.3 Keyence Corporation
8.4.3.1 Business Description & Financial Analysis
8.4.3.2 SWOT Analysis
8.4.3.3 Products & Services Offered
8.4.3.4 Strategic Alliances between Business Partners
8.4.4 Sick AG
8.4.4.1 Business Description & Financial Analysis
8.4.4.2 SWOT Analysis
8.4.4.3 Products & Services Offered
8.4.4.4 Strategic Alliances between Business Partners
8.4.5 BalluffGmbH
8.4.5.1 Business Description & Financial Analysis
8.4.5.2 SWOT Analysis
8.4.5.3 Products & Services Offered
8.4.5.4 Strategic Alliances between Business Partners
8.4.6 Baumer Holding
8.4.7.1 Business Description & Financial Analysis
8.4.7.2 SWOT Analysis
8.4.7.3 Products & Services Offered
8.4.7.4 Strategic Alliances between Business Partners
8.4.7 Ifm Electronic GmbH
8.4.7.1 Business Description & Financial Analysis
8.4.7.2 SWOT Analysis
8.4.7.3 Products & Services Offered
8.4.8.4 Strategic Alliances between Business Partners
8.4.8 Leuze Electronic GmbH + Co Kg
8.4.8.1 Business Description & Financial Analysis
8.4.8.2 SWOT Analysis
8.4.8.3 Products & Services Offered
8.4.8.4 Strategic Alliances between Business Partners
8.4.9 Pepperl Fuchs GmbH
8.4.9.1 Business Description & Financial Analysis
8.4.9.2 SWOT Analysis
8.4.9.3 Products & Services Offered
8.4.9.4 Strategic Alliances between Business Partners
8.4.10 Hans Turck GmbH
8.4.10.1 Business Description & Financial Analysis
8.4.10.2 SWOT Analysis
8.4.10.3 Products & Services Offered
8.4.10.4 Strategic Alliances between Business Partners
8.4.11 Other Companies
8.4.11.1 Business Description & Financial Analysis
8.4.11.2 SWOT Analysis
8.4.11.3 Products & Services Offered
8.4.11.4 Strategic Alliances between Business Partners
9 RESEARCH OFFERINGOLOGY
9.1 Market Introduction
9.1.1 Market Definition
9.1.2 Market Scope & Segmentation
9.2 Information Procurement
9.2.1 Secondary Research
9.2.1.1 Purchased Databases
9.2.1.2 GMEs Internal Data Repository
9.2.1.3 Secondary Resources & Third Party Perspectives
9.2.1.4 Company Information Sources
9.2.2 Primary Research
9.2.2.1 Various Types of Respondents for Primary Interviews
9.2.2.2 Number of Interviews Conducted throughout the Research Process
9.2.2.3 Primary Stakeholders
9.2.2.4 Discussion Guide for Primary Participants
9.2.3 Expert Panels
9.2.3.1 Expert Panels Across 30+ Industry
9.2.4 Paid Local Experts
9.2.4.1 Paid Local Experts Across 30+ Industry Across each Region
9.3 Market Estimation
9.3.1 Top-Down Approach
9.3.1.1 Macro-Economic Indicators Considered
9.3.1.2 Micro-Economic Indicators Considered
9.3.2 Bottom Up Approach
9.3.2.1 Company Share Analysis Approach
9.3.2.2 Estimation of Potential Product Sales
9.4 Data Triangulation
9.4.1 Data Collection
9.4.2 Time Series, Cross Sectional & Panel Data Analysis
9.4.3 Cluster Analysis
9.5 Analysis and Output
9.5.1 Inhouse AI Based Real Time Analytics Tool
9.5.2 Output From Desk & Primary Research
9.6 Research Assumptions & Limitations
9.7.1 Research Assumptions
9.7.2 Research Limitations
LIST OF TABLES
1 Global Vision Sensors Market, By Type, 2021-2029 (USD Billion)
2 Less than 3D Market, By Region, 2021-2029 (USD Billion)
3 3D Market, By Region, 2021-2029 (USD Billion)
4 Global Vision Sensors Market, By Application Type, 2021-2029 (USD Billion)
5 Inspection Market, By Region, 2021-2029 (USD Billion)
6 Gauging Market, By Region, 2021-2029 (USD Billion)
7 Code Reading Market, By Region, 2021-2029 (USD Billion)
8 Localization Market, By Region, 2021-2029 (USD Billion)
9 Others Market, By Region, 2021-2029 (USD Billion)
10 Global Vision Sensors Market, By End User, 2021-2029 (USD Billion)
11 Automotive Market, By Region, 2021-2029 (USD Billion)
12 Electronics & Semiconductors Market, By Region, 2021-2029 (USD Billion)
13 Pharmaceuticals Market, By Region, 2021-2029 (USD Billion)
14 Others Market, By Region, 2021-2029 (USD Billion)
15 Regional Analysis, 2021-2029 (USD Billion)
16 North America Vision Sensors Market, By Type, 2021-2029 (USD Billion)
17 North America Vision Sensors Market, By Application Type, 2021-2029 (USD Billion)
18 North America Vision Sensors Market, By End User, 2021-2029 (USD Billion)
19 North America Vision Sensors Market, By Country, 2021-2029 (USD Billion)
20 U.S. Vision Sensors Market, By Type, 2021-2029 (USD Billion)
21 U.S. Vision Sensors Market, By Application Type, 2021-2029 (USD Billion)
22 U.S. Vision Sensors Market, By End User, 2021-2029 (USD Billion)
23 Canada Vision Sensors Market, By Type, 2021-2029 (USD Billion)
24 Canada Vision Sensors Market, By Application Type, 2021-2029 (USD Billion)
25 Canada Vision Sensors Market, By End User, 2021-2029 (USD Billion)
26 Mexico Vision Sensors Market, By Type, 2021-2029 (USD Billion)
27 Mexico Vision Sensors Market, By Application Type, 2021-2029 (USD Billion)
28 Mexico Vision Sensors Market, By End User, 2021-2029 (USD Billion)
29 Europe Vision Sensors Market, By Type, 2021-2029 (USD Billion)
30 Europe Vision Sensors Market, By Application Type, 2021-2029 (USD Billion)
31 Europe Vision Sensors Market, By End User, 2021-2029 (USD Billion)
32 EUROPE Vision Sensors Market, By Country, 2021-2029 (USD Billion)
33 Germany Vision Sensors Market, By Type, 2021-2029 (USD Billion)
34 Germany Vision Sensors Market, By Application Type, 2021-2029 (USD Billion)
35 Germany Vision Sensors Market, By End User, 2021-2029 (USD Billion)
36 U.K. Vision Sensors Market, By Type, 2021-2029 (USD Billion)
37 U.K. Vision Sensors Market, By Application Type, 2021-2029 (USD Billion)
38 U.K. Vision Sensors Market, By End User, 2021-2029 (USD Billion)
39 France Vision Sensors Market, By Type, 2021-2029 (USD Billion)
40 France Vision Sensors Market, By Application Type, 2021-2029 (USD Billion)
41 France Vision Sensors Market, By End User, 2021-2029 (USD Billion)
42 Italy Vision Sensors Market, By Type, 2021-2029 (USD Billion)
43 Italy Vision Sensors Market, By Application Type, 2021-2029 (USD Billion)
44 Italy Vision Sensors Market, By End User, 2021-2029 (USD Billion)
45 Spain Vision Sensors Market, By Type, 2021-2029 (USD Billion)
46 Spain Vision Sensors Market, By Application Type, 2021-2029 (USD Billion)
47 Spain Vision Sensors Market, By End User, 2021-2029 (USD Billion)
48 Netherland Vision Sensors Market, By Type, 2021-2029 (USD Billion)
49 Netherland Vision Sensors Market, By Application Type, 2021-2029 (USD Billion)
50 Netherland Vision Sensors Market, By End User, 2021-2029 (USD Billion)
51 Rest Of Europe Vision Sensors Market, By Type, 2021-2029 (USD Billion)
52 Rest Of Europe Vision Sensors Market, By Application Type, 2021-2029 (USD Billion)
53 Rest of Europe Vision Sensors Market, By End User, 2021-2029 (USD Billion)
54 Asia Pacific Vision Sensors Market, By Type, 2021-2029 (USD Billion)
55 Asia Pacific Vision Sensors Market, By Application Type, 2021-2029 (USD Billion)
56 Asia Pacific Vision Sensors Market, By End User, 2021-2029 (USD Billion)
57 Asia Pacific Vision Sensors Market, By Country, 2021-2029 (USD Billion)
58 China Vision Sensors Market, By Type, 2021-2029 (USD Billion)
59 China Vision Sensors Market, By Application Type, 2021-2029 (USD Billion)
60 China Vision Sensors Market, By End User, 2021-2029 (USD Billion)
61 India Vision Sensors Market, By Type, 2021-2029 (USD Billion)
62 India Vision Sensors Market, By Application Type, 2021-2029 (USD Billion)
63 India Vision Sensors Market, By End User, 2021-2029 (USD Billion)
64 Japan Vision Sensors Market, By Type, 2021-2029 (USD Billion)
65 Japan Vision Sensors Market, By Application Type, 2021-2029 (USD Billion)
66 Japan Vision Sensors Market, By End User, 2021-2029 (USD Billion)
67 South Korea Vision Sensors Market, By Type, 2021-2029 (USD Billion)
68 South Korea Vision Sensors Market, By Application Type, 2021-2029 (USD Billion)
69 South Korea Vision Sensors Market, By End User, 2021-2029 (USD Billion)
70 Australia Vision Sensors Market, By Type, 2021-2029 (USD Billion)
71 Australia Vision Sensors Market, By Application Type, 2021-2029 (USD Billion)
72 Australia Vision Sensors Market, By End User, 2021-2029 (USD Billion)
73 Thailand Vision Sensors Market, By Type, 2021-2029 (USD Billion)
74 Thailand Vision Sensors Market, By Application Type, 2021-2029 (USD Billion)
75 Thailand Vision Sensors Market, By End User, 2021-2029 (USD Billion)
76 Vietnam Vision Sensors Market, By Type, 2021-2029 (USD Billion)
77 Vietnam Vision Sensors Market, By Application Type, 2021-2029 (USD Billion)
78 Vietnam Vision Sensors Market, By End User, 2021-2029 (USD Billion)
79 indonesia Vision Sensors Market, By Type, 2021-2029 (USD Billion)
80 indonesia Vision Sensors Market, By Application Type, 2021-2029 (USD Billion)
81 indonesia Vision Sensors Market, By End User, 2021-2029 (USD Billion)
82 Malaysia Vision Sensors Market, By Type, 2021-2029 (USD Billion)
83 Malaysia Vision Sensors Market, By Application Type, 2021-2029 (USD Billion)
84 Malaysia Vision Sensors Market, By End User, 2021-2029 (USD Billion)
85 Philippines Vision Sensors Market, By Type, 2021-2029 (USD Billion)
86 Philippines Vision Sensors Market, By Application Type, 2021-2029 (USD Billion)
87 Philippines Vision Sensors Market, By End User, 2021-2029 (USD Billion)
88 Singapore Vision Sensors Market, By Type, 2021-2029 (USD Billion)
89 Singapore Vision Sensors Market, By Application Type, 2021-2029 (USD Billion)
90 Singapore Vision Sensors Market, By End User, 2021-2029 (USD Billion)
91 Rest of APAC Vision Sensors Market, By Type, 2021-2029 (USD Billion)
92 Rest of APAC Vision Sensors Market, By Application Type, 2021-2029 (USD Billion)
93 Rest of APAC Vision Sensors Market, By End User, 2021-2029 (USD Billion)
94 Middle East and Africa Vision Sensors Market, By Type, 2021-2029 (USD Billion)
95 Middle East and Africa Vision Sensors Market, By Application Type, 2021-2029 (USD Billion)
96 Middle East and Africa Vision Sensors Market, By End User, 2021-2029 (USD Billion)
97 Middle East and Africa Vision Sensors Market, By Country, 2021-2029 (USD Billion)
98 Saudi Arabia Vision Sensors Market, By Type, 2021-2029 (USD Billion)
99 Saudi Arabia Vision Sensors Market, By Application Type, 2021-2029 (USD Billion)
100 Saudi Arabia Vision Sensors Market, By End User, 2021-2029 (USD Billion)
101 UAE Vision Sensors Market, By Type, 2021-2029 (USD Billion)
102 UAE Vision Sensors Market, By Application Type, 2021-2029 (USD Billion)
103 UAE Vision Sensors Market, By End User, 2021-2029 (USD Billion)
104 South Africa Vision Sensors Market, By Type, 2021-2029 (USD Billion)
105 South Africa Vision Sensors Market, By Application Type, 2021-2029 (USD Billion)
106 South Africa Vision Sensors Market, By End User, 2021-2029 (USD Billion)
107 Israel Vision Sensors Market, By Type, 2021-2029 (USD Billion)
108 Israel Vision Sensors Market, By Application Type, 2021-2029 (USD Billion)
109 Israel Vision Sensors Market, By End User, 2021-2029 (USD Billion)
110 Rest of Middle East and Africa Vision Sensors Market, By Type, 2021-2029 (USD Billion)
111 Rest of Middle East and Africa Vision Sensors Market, By Application Type, 2021-2029 (USD Billion)
112 Rest of Middle East and Africa Vision Sensors Market, By End User, 2021-2029 (USD Billion)
113 Central and South America Vision Sensors Market, By Type, 2021-2029 (USD Billion)
114 Central and South America Vision Sensors Market, By Application Type, 2021-2029 (USD Billion)
115 Central and South America Vision Sensors Market, By End User, 2021-2029 (USD Billion)
116 Central and South America Vision Sensors Market, By Country, 2021-2029 (USD Billion)
117 Brazil Vision Sensors Market, By Type, 2021-2029 (USD Billion)
118 Brazil Vision Sensors Market, By Application Type, 2021-2029 (USD Billion)
119 Brazil Vision Sensors Market, By End User, 2021-2029 (USD Billion)
120 Argentina Vision Sensors Market, By Type, 2021-2029 (USD Billion)
121 Argentina Vision Sensors Market, By Application Type, 2021-2029 (USD Billion)
122 Argentina Vision Sensors Market, By End User, 2021-2029 (USD Billion)
123 Chile Vision Sensors Market, By Type, 2021-2029 (USD Billion)
124 Chile Vision Sensors Market, By Application Type, 2021-2029 (USD Billion)
125 Chile Vision Sensors Market, By End User, 2021-2029 (USD Billion)
126 Rest of Central and South America Vision Sensors Market, By Type, 2021-2029 (USD Billion)
127 Rest of Central and South America Vision Sensors Market, By Application Type, 2021-2029 (USD Billion)
128 Rest of Central and South America Vision Sensors Market, By End User, 2021-2029 (USD Billion)
129 Cognex Corporation: Products & Services Offering
130 Teledyne Technologies: Products & Services Offering
131 Keyence Corporation: Products & Services Offering
132 Sick AG: Products & Services Offering
133 BalluffGmbH: Products & Services Offering
134 BAUMER HOLDING: Products & Services Offering
135 Ifm Electronic GmbH: Products & Services Offering
136 Leuze Electronic GmbH + Co Kg: Products & Services Offering
137 Pepperl Fuchs GmbH: Products & Services Offering
138 Hans Turck GmbH: Products & Services Offering
139 Other Companies: Products & Services Offering
LIST OF FIGURES
1 Global Vision Sensors Market Overview
2 Global Vision Sensors Market Value From 2021-2029 (USD Billion)
3 Global Vision Sensors Market Share, By Type (2023)
4 Global Vision Sensors Market Share, By Application Type (2023)
5 Global Vision Sensors Market Share, By End User (2023)
6 Global Vision Sensors Market, By Region (Asia Pacific Market)
7 Technological Trends In Global Vision Sensors Market
8 Four Quadrant Competitor Positioning Matrix
9 Impact Of Macro & Micro Indicators On The Market
10 Impact Of Key Drivers On The Global Vision Sensors Market
11 Impact Of Challenges On The Global Vision Sensors Market
12 Porter’s Five Forces Analysis
13 Global Vision Sensors Market: By Type Scope Key Takeaways
14 Global Vision Sensors Market, By Type Segment: Revenue Growth Analysis
15 Less than 3D Market, By Region, 2021-2029 (USD Billion)
16 3D Market, By Region, 2021-2029 (USD Billion)
17 Global Vision Sensors Market: By Application Type Scope Key Takeaways
18 Global Vision Sensors Market, By Application Type Segment: Revenue Growth Analysis
19 Inspection Market, By Region, 2021-2029 (USD Billion)
20 Gauging Market, By Region, 2021-2029 (USD Billion)
21 Code Reading Market, By Region, 2021-2029 (USD Billion)
22 Localization Market, By Region, 2021-2029 (USD Billion)
23 Others Market, By Region, 2021-2029 (USD Billion)
24 Global Vision Sensors Market: By End User Scope Key Takeaways
25 Global Vision Sensors Market, By End User Segment: Revenue Growth Analysis
26 Automotive Market, By Region, 2021-2029 (USD Billion)
27 Electronics & Semiconductors Market, By Region, 2021-2029 (USD Billion)
28 Pharmaceuticals Market, By Region, 2021-2029 (USD Billion)
29 Others Market, By Region, 2021-2029 (USD Billion)
30 Regional Segment: Revenue Growth Analysis
31 Global Vision Sensors Market: Regional Analysis
32 North America Vision Sensors Market Overview
33 North America Vision Sensors Market, By Type
34 North America Vision Sensors Market, By Application Type
35 North America Vision Sensors Market, By End User
36 North America Vision Sensors Market, By Country
37 U.S. Vision Sensors Market, By Type
38 U.S. Vision Sensors Market, By Application Type
39 U.S. Vision Sensors Market, By End User
40 Canada Vision Sensors Market, By Type
41 Canada Vision Sensors Market, By Application Type
42 Canada Vision Sensors Market, By End User
43 Mexico Vision Sensors Market, By Type
44 Mexico Vision Sensors Market, By Application Type
45 Mexico Vision Sensors Market, By End User
46 Four Quadrant Positioning Matrix
47 Company Market Share Analysis
48 Cognex Corporation: Company Snapshot
49 Cognex Corporation: SWOT Analysis
50 Cognex Corporation: Geographic Presence
51 Teledyne Technologies: Company Snapshot
52 Teledyne Technologies: SWOT Analysis
53 Teledyne Technologies: Geographic Presence
54 Keyence Corporation: Company Snapshot
55 Keyence Corporation: SWOT Analysis
56 Keyence Corporation: Geographic Presence
57 Sick AG: Company Snapshot
58 Sick AG: Swot Analysis
59 Sick AG: Geographic Presence
60 BalluffGmbH: Company Snapshot
61 BalluffGmbH: SWOT Analysis
62 BalluffGmbH: Geographic Presence
63 Baumer Holding: Company Snapshot
64 Baumer Holding: SWOT Analysis
65 Baumer Holding: Geographic Presence
66 Ifm Electronic GmbH: Company Snapshot
67 Ifm Electronic GmbH: SWOT Analysis
68 Ifm Electronic GmbH: Geographic Presence
69 Leuze Electronic GmbH + Co Kg: Company Snapshot
70 Leuze Electronic GmbH + Co Kg: SWOT Analysis
71 Leuze Electronic GmbH + Co Kg: Geographic Presence
72 Pepperl Fuchs GmbH: Company Snapshot
73 Pepperl Fuchs GmbH: SWOT Analysis
74 Pepperl Fuchs GmbH: Geographic Presence
75 Hans Turck GmbH: Company Snapshot
76 Hans Turck GmbH: SWOT Analysis
77 Hans Turck GmbH: Geographic Presence
78 Other Companies: Company Snapshot
79 Other Companies: SWOT Analysis
80 Other Companies: Geographic Presence
The Global Vision Sensors Market has been studied from the year 2019 till 2029. However, the CAGR provided in the report is from the year 2024 to 2029. The research methodology involved three stages: Desk research, Primary research, and Analysis & Output from the entire research process.

The desk research involved a robust background study which meant referring to paid and unpaid databases to understand the market dynamics; mapping contracts from press releases; identifying the key players in the market, studying their product portfolio, competition level, annual reports/SEC filings & investor presentations; and learning the demand and supply-side analysis for the Vision Sensors Market.

The primary research activity included telephonic conversations with more than 50 tier 1 industry consultants, distributors, and end-use product manufacturers.

Finally, based on the above thorough research process, an in-depth analysis was carried out considering the following aspects: market attractiveness, current & future market trends, market share analysis, SWOT analysis of the company and customer analytics.

Frequently Asked Questions

This FREE sample includes market data points, ranging from trend analyses to market estimates & forecasts. See for yourself.
Or view our licence options:
Tailor made solutions just for you
80% of our clients seek made-to-order reports. How do you want us to tailor yours?
OUR CLIENTS


