IoT in Utilities Market: Insights
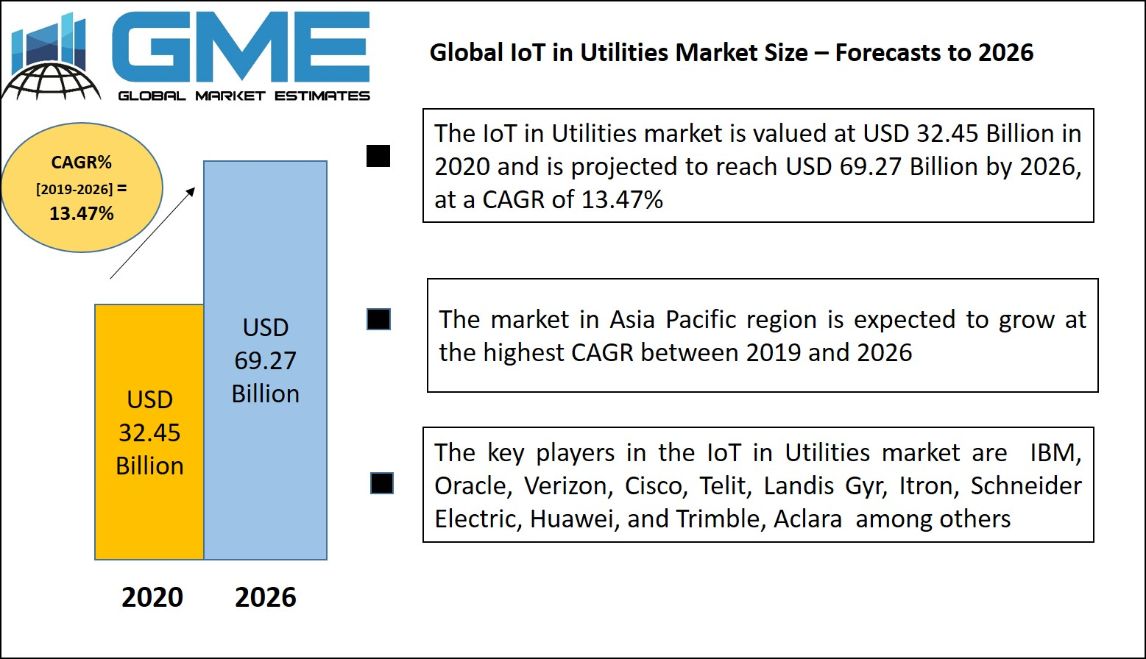
The global IoT in Utilities market is estimated to witness a significant CAGR during the forecast period (2019-2026). The increasing adoption of connected devices along growing need to manage efficient operation across the utility industries is driving the market growth for IoT in utility. The IoT in utilities will improve efficiency, generate revenue, and conserve enterprise resources.
IoT in Utilities Market: By Component
On the basis of component, the global IoT in Utilities market is segmented into Platform and non-Platform. The report contains quantitative insights about the following
- Introduction
- IoT in Utilities Market, By Component, 2018-2026 (USD Million)
- Platform
- Platform: IoT in Utilities Market, 2018-2026 (USD Million)
- Solution
- Solution: IoT in Utilities Market, 2018-2026 (USD Million)
- Services
- Services: IoT in Utilities Market, 2018-2026 (USD Million)
IoT in Utilities Market: By Solution
On the basis of solution, the global IoT in Utilities market is segmented into asset monitoring and management, safety and security, supervisory control and data acquisition, workforce management, and network management among others. the report contains quantitative insights about the following:
- Introduction
- IoT in Utilities Market, By Solution Type, 2018-2026 (USD Million)
- Asset Monitoring and Management
- Asset Monitoring and Management: IoT in Utilities Market, 2018-2026 (USD Million)
- Safety and Security
- Safety and Security: IoT in Utilities Market, 2018-2026 (USD Million)
- Supervisory Control and Data Acquisition
- Supervisory Control and Data Acquisition: IoT in Utilities Market, 2018-2026 (USD Million)
- Workforce Management
- Workforce Management: IoT in Utilities Market, 2018-2026 (USD Million)
- Network Management
- Network Management: IoT in Utilities Market, 2018-2026 (USD Million)
- Customer Information System and Billing System
- Customer Information System and Billing System: IoT in Utilities Market, 2018-2026 (USD Million)
IoT in Utilities Market: By Application
On the basis of application, the global IoT in Utilities market is segmented into Water and Wastewater Management, Utility Gas Management, and Electricity Grid Management among others. The report contains quantitative insights about the following:
- Introduction
- IoT in Utilities Market, By Application, 2018-2026 (USD Million)
- Water and Wastewater Management
- Water and Wastewater Management: IoT in Utilities Market, 2018-2026 (USD Million)
- Utility Gas Management
- Utility Gas Management: IoT in Utilities Market, 2018-2026 (USD Million)
- Electricity Grid Management
- Electricity Grid Management: IoT in Utilities Market, 2018-2026 (USD Million)
IoT in Utilities Market: By Services
On the basis of services, the global IoT in Utilities market is segmented into consulting, integration and deployment, and support & maintenance. The report contains quantitative insights about the following:
- Introduction
- IoT in Utilities Market, By Services, 2018-2026 (USD Million)
- Consulting
- Consulting: IoT in Utilities Market, 2018-2026 (USD Million)
- Integration and Deployment
- Integration and Deployment: IoT in Utilities Market, 2018-2026 (USD Million)
- Support and Maintenance
- Support and Maintenance: IoT in Utilities Market, 2018-2026 (USD Million)
IoT in Utilities Market: By Region
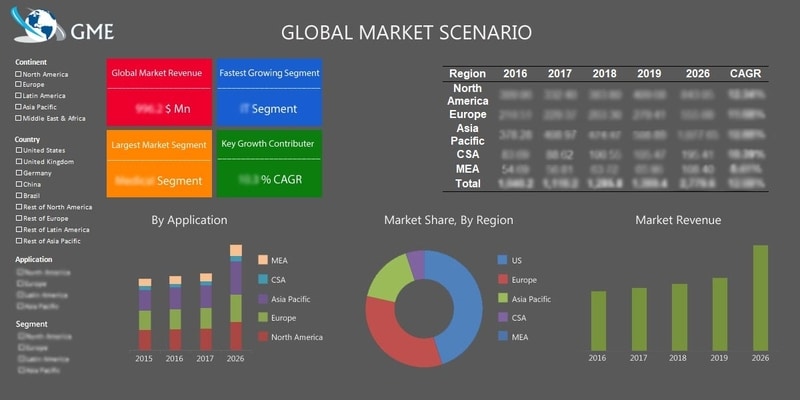
On the basis of region, the global IoT in Utilities market is segmented into North America, Europe, Asia Pacific, Central & South America and Middle East & Africa. The countries covered include: U.S., Canada, Mexico, Germany, France, UK, Italy, Spain, China, India, Japan, South Korea, Australia, Brazil, Saudi Arabia, UAE, and South Africa among others. The report provides qualitative & quantitative insights both at a regional as well as country level.
- Introduction
- Global IoT in Utilities Market, Regional Analysis, 2018-2026(USD Million)
- North America
- North America IoT in Utilities Market, Regional Analysis, 2018-2026(USD Million)
- By Component
- North America IoT in Utilities Market, By Component, 2018-2026(USD Million)
- By Solution
- North America IoT in Utilities Market, By Solution, 2018-2026(USD Million)
- By Application
- North America IoT in Utilities Market, By Application, 2018-2026(USD Million)
- By Services
- North America IoT in Utilities Market, By Services, 2018-2026(USD Million)
- By Country
- U.S
- By Component
- U.S. IoT in Utilities Market, By Component, 2018-2026(USD Million)
- By Solution
- U.S. IoT in Utilities Market, By Solution, 2018-2026(USD Million)
- By Application
- U.S. IoT in Utilities Market, By Application, 2018-2026(USD Million)
- By Services
- U.S. IoT in Utilities Market, By Services, 2018-2026(USD Million)
- Canada.
- By Component
- Canada IoT in Utilities Market, By Component, 2018-2026(USD Million)
- By Solution
- Canada IoT in Utilities Market, By Solution, 2018-2026(USD Million)
- By Application
- Canada IoT in Utilities Market, By Application, 2018-2026(USD Million)
- By Services
- Canada IoT in Utilities Market, By Services, 2018-2026(USD Million)
- Mexico
- By Component
- Mexico IoT in Utilities Market, By Component, 2018-2026(USD Million)
- By Solution
- Mexico IoT in Utilities Market, By Solution, 2018-2026(USD Million)
- By Application
- Mexico IoT in Utilities Market, By Application, 2018-2026(USD Million)
- By Services
- Mexico IoT in Utilities Market, By Services, 2018-2026(USD Million)
- Europe
- Europe IoT in Utilities Market, Regional Analysis, 2018-2026(USD Million)
- By Component
- Europe IoT in Utilities Market, By Component, 2018-2026(USD Million)
- By Solution
- Europe IoT in Utilities Market, By Solution, 2018-2026(USD Million)
- By Application
- Europe IoT in Utilities Market, By Application, 2018-2026(USD Million)
- By Services
- Europe IoT in Utilities Market, By Services, 2018-2026(USD Million)
- By Country
- Germany
- By Component
- Germany IoT in Utilities Market, By Component, 2018-2026(USD Million)
- By Solution
- Germany IoT in Utilities Market, By Solution, 2018-2026(USD Million)
- By Application
- Germany IoT in Utilities Market, By Vertcal, 2018-2026(USD Million)
- By Services
- Germany IoT in Utilities Market, By Services, 2018-2026(USD Million)
- UK
- By Component
- UK IoT in Utilities Market, By Component, 2018-2026(USD Million)
- By Solution
- UK IoT in Utilities Market, By Solution, 2018-2026(USD Million)
- By Application
- UK IoT in Utilities Market, By Application, 2018-2026(USD Million)
- By Services
- UK IoT in Utilities Market, By Services, 2018-2026(USD Million)
- France
- By Component
- France IoT in Utilities Market, By Component, 2018-2026(USD Million)
- By Solution
- France IoT in Utilities Market, By Solution, 2018-2026(USD Million)
- By Application
- France IoT in Utilities Market, By Application, 2018-2026(USD Million)
- By Services
- France IoT in Utilities Market, By Services, 2018-2026(USD Million)
- Italy
- By Component
- Italy IoT in Utilities Market, By Component, 2018-2026(USD Million)
- By Solution
- Italy IoT in Utilities Market, By Solution, 2018-2026(USD Million)
- By Application
- Italy IoT in Utilities Market, By Application, 2018-2026(USD Million)
- By Services
- Italy IoT in Utilities Market, By Services, 2018-2026(USD Million)
- Spain
- By Component
- Spain IoT in Utilities Market, By Component, 2018-2026(USD Million)
- By Solution
- Spain IoT in Utilities Market, By Solution, 2018-2026(USD Million)
- By Application
- Spain IoT in Utilities Market, By Application, 2018-2026(USD Million)
- By Services
- Spain IoT in Utilities Market, By Services, 2018-2026(USD Million)
- Belgium
- By Component
- Belgium IoT in Utilities Market, By Component, 2018-2026(USD Million)
- By Solution
- Belgium IoT in Utilities Market, By Solution, 2018-2026(USD Million)
- By Application
- Belgium IoT in Utilities Market, By Application, 2018-2026(USD Million)
- By Services
- Belgium IoT in Utilities Market, By Services, 2018-2026(USD Million)
- Rest Of Europe
- By Component
- Rest Of Europe IoT in Utilities Market, By Component, 2018-2026(USD Million)
- By Solution
- Rest Of Europe IoT in Utilities Market, By Solution, 2018-2026(USD Million)
- By Application
- Rest Of Europe IoT in Utilities Market, By Application, 2018-2026(USD Million)
- By Services
- Rest Of Europe IoT in Utilities Market, By Services, 2018-2026(USD Million)
- Asia Pacific
- Asia Pacific IoT in Utilities Market, Regional Analysis, 2018-2026(USD Million)
- By Component
- Asia Pacific IoT in Utilities Market, By Component, 2018-2026(USD Million)
- By Solution
- Asia Pacific IoT in Utilities Market, By Solution, 2018-2026(USD Million)
- By Application
- Asia Pacific IoT in Utilities Market, By Application, 2018-2026(USD Million)
- By Services
- Asia Pacific IoT in Utilities Market, By Services, 2018-2026(USD Million)
- By Country
- China
- By Component
- China IoT in Utilities Market, By Component, 2018-2026(USD Million)
- By Solution
- China IoT in Utilities Market, By Solution, 2018-2026(USD Million)
- By Application
- China IoT in Utilities Market, By Application, 2018-2026(USD Million)
- By Services
- China IoT in Utilities Market, By Services, 2018-2026(USD Million)
- Japan
- By Component
- Japan IoT in Utilities Market, By Component, 2018-2026(USD Million)
- By Solution
- Japan IoT in Utilities Market, By Solution, 2018-2026(USD Million)
- By Application
- Japan IoT in Utilities Market, By Application, 2018-2026(USD Million)
- By Services
- Japan IoT in Utilities Market, By Services, 2018-2026(USD Million)
- India
- By Component
- India IoT in Utilities Market, By Component, 2018-2026(USD Million)
- By Solution
- India IoT in Utilities Market, By Solution, 2018-2026(USD Million)
- By Application
- India IoT in Utilities Market, By Application, 2018-2026(USD Million)
- By Services
- India IoT in Utilities Market, By Services, 2018-2026(USD Million)
- South Korea
- By Component
- South Korea IoT in Utilities Market, By Component, 2018-2026(USD Million)
- By Solution
- South Korea IoT in Utilities Market, By Solution, 2018-2026(USD Million)
- By Application
- South Korea IoT in Utilities Market, By Application, 2018-2026(USD Million)
- By Services
- South Korea IoT in Utilities Market, By Services, 2018-2026(USD Million)
- Rest Of Apac
- By Component
- Rest Of Apac, IoT in Utilities Market, By Component, 2018-2026(USD Million)
- By Solution
- Rest Of Apac IoT in Utilities Market, By Solution, 2018-2026(USD Million)
- By Application
- Rest Of Apac IoT in Utilities Market, By Application, 2018-2026(USD Million)
- By Services
- Rest Of Apac IoT in Utilities Market, By Services, 2018-2026(USD Million)
- Central & South America
- Central & South America IoT in Utilities Market, Regional Analysis, 2018-2026(USD Million)
- By Component
- Central & South America IoT in Utilities Market, By Component, 2018-2026(USD Million)
- By Solution
- Central & South America IoT in Utilities Market, By Solution, 2018-2026(USD Million)
- By Application
- Central & South America IoT in Utilities Market, By Application, 2018-2026(USD Million)
- By Services
- Central & South America IoT in Utilities Market, By Services, 2018-2026(USD Million)
- By Country
- Brazil
- By Component
- Brazil IoT in Utilities Market, By Component, 2018-2026(USD Million)
- By Solution
- Brazil IoT in Utilities Market, By Solution, 2018-2026(USD Million)
- By Application
- Brazil IoT in Utilities Market, By Application, 2018-2026(USD Million)
- By Services
- Brazil IoT in Utilities Market, By Services, 2018-2026(USD Million)
- Middle East & Africa
- Middle East & Africa IoT in Utilities Market, Regional Analysis, 2018-2026(USD Million)
- By Component
- Middle East & Africa IoT in Utilities Market, By Component, 2018-2026(USD Million)
- By Solution
- Middle East & Africa IoT in Utilities Market, By Solution, 2018-2026(USD Million)
- By Application
- Middle East & Africa IoT in Utilities Market, By Application, 2018-2026(USD Million)
- By Services
- Middle East & Africa IoT in Utilities Market, By Services, 2018-2026(USD Million)
- By Country
- Saudi Arabia
- By Component
- Saudi Arabia IoT in Utilities Market, By Component, 2018-2026(USD Million)
- By Solution
- Saudi Arabia IoT in Utilities Market, By Solution, 2018-2026(USD Million)
- By Application
- Saudi Arabia IoT in Utilities Market, By Application, 2018-2026(USD Million)
- By Services
- Saudi Arabia IoT in Utilities Market, By Services, 2018-2026(USD Million)
- UAE
- By Component
- UAE IoT in Utilities Market, By Component, 2018-2026(USD Million)
- By Solution
- UAE IoT in Utilities Market, By Solution, 2018-2026(USD Million)
- By Application
- UAE IoT in Utilities Market, By Application, 2018-2026(USD Million)
- By Services
- UAE IoT in Utilities Market, By Services, 2018-2026(USD Million
IoT in Utilities Market: End Use Landscape
The end-user landscape entails a list of current and prospective consumers prevailing across the regions. This section briefs you about company addresses, contact details, products, and regional presence of companies who are purchasing or are likely to purchase IoT in Utilities. The key end-users of the markets are ConocoPhillips, Ameren. AP Photo/Seth Perlman. And NRG Energy among others.
IoT in Utilities Market: Vendor Landscape
The report contains a chapter dedicated to vendors operating in the market, covering raw material manufactures, equipment developers, manufacturers, and distributors. The report provides these insights on a regional level. This section of the report entails contact details, experience, products manufactured/supplied, and geographical presence of companies.
IoT in Utilities Market: Share & Competitor Analysis
Some of the key players operating in the IoT in Utilities market are IBM, Oracle, Verizon, Cisco, Telit, Landis Gyr, Itron, Schneider Electric, Huawei, Trimble, Aclara, Trilliant, Energyworx, and HCL among Others.
Please note: This is not an exhaustive list of companies profiled in the report.
Related Report: Global IoT Device Management Market, Size, Trends & Analysis - Forecasts to 2026

The desk research involved a robust background study which meant referring to paid and unpaid databases to understand the market dynamics; mapping contracts from press releases; identifying the key players in the market, studying their product portfolio, competition level, annual reports/SEC filings & investor presentations; and learning the demand and supply side analysis for the IoT in Utilities market.

The primary research activity included telephonic conversations with more than 50 tier 1 industry consultants, distributors, and end-use product manufacturers.

Finally, based on the above thorough research process, an in-depth analysis was carried out considering the following aspects: market attractiveness, current & future market trends, market share analysis, SWOT analysis of the companies and customer analytics.