This report was recently updated on August 13 2025 with the latest and most recent
market numbers
Global ANPR System Market Size, Trends & Analysis - Forecasts to 2026 By Application (Traffic Management, Law Enforcement, Electronic Toll Collection, Parking Management, and Access Control), By Type (Fixed, Mobile, and Portable), By Component (Hardware, Software, and Service), Competitive Landscape, Company Market Share Analysis, and Competitor Analysis
Automatic number plate recognition (ANPR), often regarded as automatically licensed plate recognition, is a methodology that utilizes optical symbol identification to decipher alphanumeric symbols on the vehicle’s license plates. ANPR is viewed as perhaps the best technique for handling traffic issues. Moreover, the general system is portrayed into two stages; the first is to take pictures of a license plate and the subsequent stage incorporates picture processing to perceive characters on the license plate with the guide of the software. Also, an ANPR system is rapidly turning into an essential segment of keeping up security and order in traffic management.
The adoption pace of ANPR systems in the security, surveillance, and traffic authorization applications has expanded recently to check terrorist exercises, frauds, and criminal cases. An ANPR system plays a significant part in finding vehicles that have been stolen, are associated with a criminal offense, have disregarded traffic regulations, have been on the defaulter's rundown for toll collection, and have lapsed insurance policies. Expanded adoption of trend-setting innovations, for example, cloud-based services, IoT, AI, among others, are anticipated to drive the market.
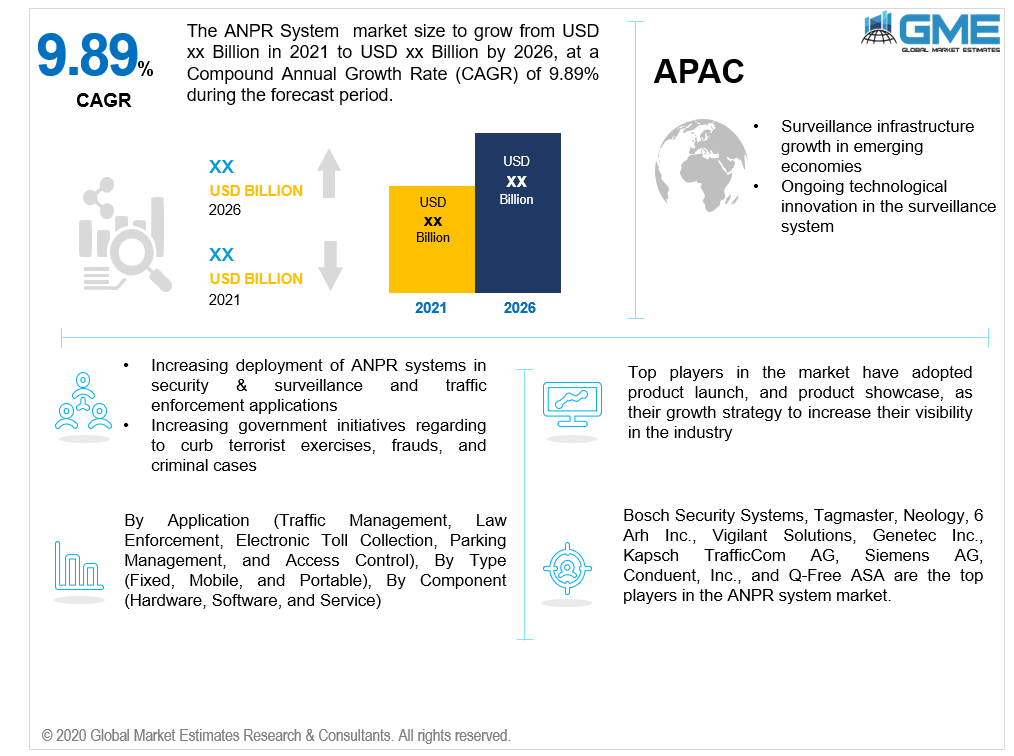
The market can be divided across five main categories based on application: traffic management, law enforcement, electronic toll collection, parking management, and access control. The market leader in this segment is the traffic management segment. ANPR equipment helps improve the progression of traffic through data exchange. Multiple automobile manufacturers are emphasizing the convergence of the ANPR network with automotive connectivity devices such as Global Positioning Systems (GPS), Global Navigation Satellite Systems, and Vehicle-to-Vehicle networks (V2V). Likewise, these frameworks offer information for traffic checks, travel speed, and starting point that is driving the development of the segment. Moreover, the developing demand for these frameworks for applications, for example, congestion charging is a significant pattern adding to the segment development. The congestion charge is a fee levied on drivers who enter heavily trafficked areas.
Over the forecast period, the security and surveillance segment will lead in terms of the CAGR. The frequency of terrorism operations has prompted national security and security agencies, namely the Transport Research Laboratory (TRL), to seek new approaches to develop their monitoring infrastructure Furthermore, recently there has been an escalation in the utilization of Vehicle-Borne Improvised Explosive Device (VBIED) by extremist groups which is further leading to the growth of security and surveillance segment.
The market can be divided into three categories based on the type of ANPR device used: fixed, mobile, and portable. Fixed systems kept a prevailing position, representing a higher income share. The segment has acquired a foothold lately by demand from traffic police/staff and defense forces. Fixed systems are highly sought after by defense services because they can be configured to every specification and unique infrastructure that can be optimized for multi-path inclusion. Fixed systems enable consistent surveillance in high-density traffic territories. Moreover, fixed systems empower continuous requirements for regular toll violators which are adding to the market development.
The segment of portable system will lead in terms of the CAGR. This equipment is generally used by law authorization offices, attributable to their expense adequacy and adaptability of use. These devices are progressively being adopted by an enormous number of public security organizations for speed requirements. Different governments across the globe are concentrating on giving contracts to ANPR suppliers.
Given the components, the ANPR system market can be categorized as hardware, software, and service. The hardware segment dominated the ANPR framework market and is anticipated to develop substantially over the forecast period. The advent of IoT, which now has empowered the radical synchronization of hardware between one another and through cloud-based computing services, is anticipated to augment the demand. The growing demand for ANPR cameras for integration into aircraft, patrol vehicles, and Unmanned Aerial Vehicles (UAVs) is hastening the development of the hardware segment. Significant advancements in Digital Signal Processors (DSPs) and Field Programmable Gate Arrays (FPGAs) have enhanced ANPR hardware efficiency. As of now, these devices utilize a different camera followed by an independent PC for processing.
The software segment will witness steady growth. For the ANPR system, it corresponds to the picture and character acknowledgment through OCR, GUI, and Database. The expanding accentuation of organizations on the advancement of online ANPR software is driving the development of the software section. The expanding demand for ANPR software that upholds ANPR cameras from different OEMs is pushing the development of the software.
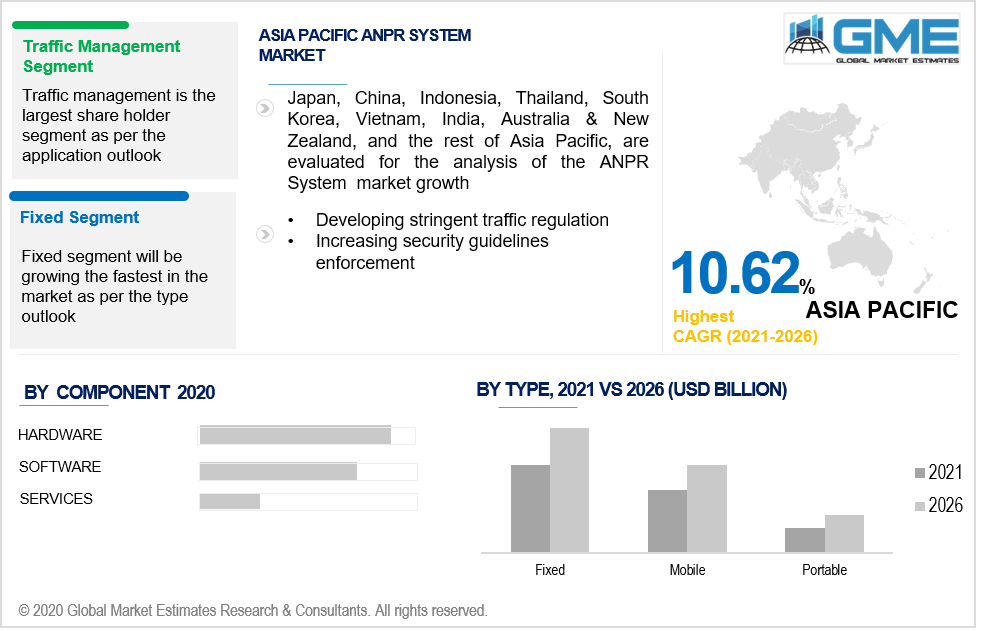
As per the geographical analysis, the market of ANPR system market can be classified into North America (the US, Canada, and Mexico), Asia Pacific (India, China, Japan, Malaysia, Singapore, and Rest of Asia Pacific), Europe (Germany, United Kingdom, Italy, France, Spain, Netherlands, and Rest of Europe), Middle East & Africa and Central South America. North America is estimated to be the market leader of the global ANPR system market. The North American market has the potential to offer enormous opportunities for ANPR system market development because of the presence of various key players who are extensively carrying out various research and development projects to develop advanced products. Additionally, the North American area has a solid base of innovation that supports market development. Moreover, the Asia Pacific area is expected to lead the market in terms of CAGR and witness robust development in the ANPR system market during the forecast period. The ANPR system is constantly being implemented in the APAC region for traffic management, traffic permitting, and parking guidelines, specifically for economies like China, Indonesia, Vietnam, and South Korea, which is continuing to increase the requirement for the ANPR system.
Bosch Security Systems, Tagmaster, Neology, 6 Arh Inc., Vigilant Solutions, Genetec Inc., Kapsch TrafficCom AG, Siemens AG, Conduent, Inc., and Q-Free ASA are the top players in the ANPR system market.
Please note: This is not an exhaustive list of companies profiled in the report.
Chapter 1 Methodology
1.1 Market Scope & Definitions
1.2 Estimates & Forecast Calculation
1.3 Historical Data Overview and Validation
1.4 Data Sources
1.4.1 Secondary
1.4.2 Primary
Chapter 2 Report Outlook
2.1 ANPR System Industry Overview, 2016-2026
2.1.1 Industry Overview
2.1.2 Component Overview
2.1.3 Type Overview
2.1.4 Application Overview
2.1.5 Regional Overview
Chapter 3 ANPR System Market Trends
3.1 Market Segmentation
3.2 Industry Background, 2016-2026
3.3 Market Key Trends
3.3.1 Positive Trends
3.3.1.1 Ongoing technological advancement and deployment of ANPR systems in security and surveillance, and traffic
3.3.1.2 Rise in the volume of government programmes aimed at the growth of smart cities, such as intelligent mobility networks and traffic management systems
3.3.2 Industry Challenges
3.3.2.1 Automatic number plate recognition devices are to responsible for the inaccuracy
3.4 Prospective Growth Scenario
3.4.1 Component Growth Scenario
3.4.2 Type Growth Scenario
3.4.3 Application Growth Scenario
3.5 COVID-19 Influence over Industry Growth
3.6 Porter’s Analysis
3.7 PESTEL Analysis
3.8 Value Chain & Supply Chain Analysis
3.9 Regulatory Framework
3.9.1 North America
3.9.2 Europe
3.9.3 APAC
3.9.4 LATAM
3.9.5 MEA
3.10 Technology Overview
3.11 Market Share Analysis, 2020
3.11.1 Company Positioning Overview, 2020
Chapter 4 ANPR System Market, By Component
4.1 Component Outlook
4.2 Hardware
4.2.1 Market Size, By Region, 2016-2026 (USD Million)
4.3 Software
4.3.1 Market Size, By Region, 2016-2026 (USD Million)
4.4 Services
4.4.1 Market Size, By Region, 2016-2026 (USD Million)
Chapter 5 ANPR System Market, By Type
5.1 Type Outlook
5.2 Fixed
5.2.1 Market Size, By Region, 2016-2026 (USD Million)
5.3 Mobile
5.3.1 Market Size, By Region, 2016-2026 (USD Million)
5.4 Portable
5.4.1 Market Size, By Region, 2016-2026 (USD Million)
Chapter 6 ANPR System Market, By Application
6.1 Application Outlook
6.2 Traffic Management
6.2.1 Market size, By Region, 2016-2026 (USD Million)
6.3 Law Enforcement
6.3.1 Market size, By Region, 2016-2026 (USD Million)
6.4 Electronic Toll Collection
6.4.1 Market size, By Region, 2016-2026 (USD Million)
6.5 Parking Management
6.5.1 Market size, By Region, 2016-2026 (USD Million)
6.6 Access Control
6.6.1 Market Size, By Region, 2016-2026 (USD Million)
Chapter 7 ANPR System Market, By Region
7.1 Regional outlook
7.2 North America
7.2.1 Market Size, By Country 2016-2026 (USD Million)
7.2.2 Market Size, By Component, 2016-2026 (USD Million)
7.2.3 Market Size, By Type, 2016-2026 (USD Million)
7.2.4 Market Size, By Application, 2016-2026 (USD Million)
7.2.5 U.S.
7.2.5.1 Market Size, By Component, 2016-2026 (USD Million)
7.2.5.2 Market Size, By Type, 2016-2026 (USD Million)
7.2.5.3 Market Size, By Application, 2016-2026 (USD Million)
7.2.6 Canada
7.2.6.1 Market Size, By Component, 2016-2026 (USD Million)
7.2.6.2 Market Size, By Type, 2016-2026 (USD Million)
7.2.6.3 Market Size, By Application, 2016-2026 (USD Million)
7.3 Europe
7.3.1 Market Size, By Country 2016-2026 (USD Million)
7.3.2 Market Size, By Component, 2016-2026 (USD Million)
7.3.3 Market Size, By Type, 2016-2026 (USD Million)
7.3.4 Market Size, By Application, 2016-2026 (USD Million)
7.3.5 Germany
7.3.5.1 Market Size, By Component, 2016-2026 (USD Million)
7.3.5.2 Market Size, By Type, 2016-2026 (USD Million)
7.3.5.3 Market Size, By Application, 2016-2026 (USD Million)
7.3.6 UK
7.3.6.1 Market Size, By Component, 2016-2026 (USD Million)
7.3.6.2 Market Size, By Type, 2016-2026 (USD Million)
7.3.6.3 Market Size, By Application, 2016-2026 (USD Million)
7.3.7 France
7.3.7.1 Market Size, By Component, 2016-2026 (USD Million)
7.3.7.2 Market Size, By Type, 2016-2026 (USD Million)
7.3.7.3 Market Size, By Application, 2016-2026 (USD Million)
7.3.8 Italy
7.3.8.1 Market Size, By Component, 2016-2026 (USD Million)
7.3.8.2 Market Size, By Type, 2016-2026 (USD Million)
7.3.8.3 Market Size, By Application, 2016-2026 (USD Million)
7.3.9 Spain
7.3.9.1 Market Size, By Component, 2016-2026 (USD Million)
7.3.9.2 Market Size, By Type, 2016-2026 (USD Million)
7.3.9.3 Market Size, By Application, 2016-2026 (USD Million)
7.3.10 Russia
7.3.10.1 Market Size, By Component, 2016-2026 (USD Million)
7.3.10.2 Market Size, By Type, 2016-2026 (USD Million)
7.3.10.3 Market Size, By Application, 2016-2026 (USD Million)
7.4 Asia Pacific
7.4.1 Market Size, By Country 2016-2026 (USD Million)
7.4.2 Market Size, By Component, 2016-2026 (USD Million)
7.4.3 Market Size, By Type, 2016-2026 (USD Million)
7.4.4 Market Size, By Application, 2016-2026 (USD Million)
7.4.5 China
7.4.5.1 Market Size, By Component, 2016-2026 (USD Million)
7.4.5.2 Market Size, By Type, 2016-2026 (USD Million)
7.4.5.3 Market Size, By Application, 2016-2026 (USD Million)
7.4.6 India
7.4.6.1 Market Size, By Component, 2016-2026 (USD Million)
7.4.6.2 Market Size, By Type, 2016-2026 (USD Million)
7.4.6.3 Market Size, By Application, 2016-2026 (USD Million)
7.4.7 Japan
7.4.7.1 Market Size, By Component, 2016-2026 (USD Million)
7.4.7.2 Market Size, By Type, 2016-2026 (USD Million)
7.4.7.3 Market Size, By Application, 2016-2026 (USD Million)
7.4.8 Australia
7.4.8.1 Market Size, By Component, 2016-2026 (USD Million)
7.4.8.2 Market size, By Type, 2016-2026 (USD Million)
7.4.8.3 Market Size, By Application, 2016-2026 (USD Million)
7.4.9 South Korea
7.4.9.1 Market Size, By Component, 2016-2026 (USD Million)
7.4.9.2 Market Size, By Type, 2016-2026 (USD Million)
7.4.9.3 Market Size, By Application, 2016-2026 (USD Million)
7.5 Latin America
7.5.1 Market Size, By Country 2016-2026 (USD Million)
7.5.2 Market Size, By Component, 2016-2026 (USD Million)
7.5.3 Market Size, By Type, 2016-2026 (USD Million)
7.5.4 Market Size, By Application, 2016-2026 (USD Million)
7.5.5 Brazil
7.5.5.1 Market Size, By Component, 2016-2026 (USD Million)
7.5.5.2 Market Size, By Type, 2016-2026 (USD Million)
7.5.5.3 Market Size, By Application, 2016-2026 (USD Million)
7.5.6 Mexico
7.5.6.1 Market Size, By Component, 2016-2026 (USD Million)
7.5.6.2 Market Size, By Type, 2016-2026 (USD Million)
7.5.6.3 Market Size, By Application, 2016-2026 (USD Million)
7.5.7 Argentina
7.5.7.1 Market Size, By Component, 2016-2026 (USD Million)
7.5.7.2 Market Size, By Type, 2016-2026 (USD Million)
7.5.7.3 Market Size, By Application, 2016-2026 (USD Million)
7.6 MEA
7.6.1 Market Size, By Country 2016-2026 (USD Million)
7.6.2 Market Size, By Component, 2016-2026 (USD Million)
7.6.3 Market Size, By Type, 2016-2026 (USD Million)
7.6.4 Market Size, By Application, 2016-2026 (USD Million)
7.6.5 Saudi Arabia
7.6.5.1 Market Size, By Component, 2016-2026 (USD Million)
7.6.5.2 Market Size, By Type, 2016-2026 (USD Million)
7.6.5.3 Market Size, By Application, 2016-2026 (USD Million)
7.6.6 UAE
7.6.6.1 Market Size, By Component, 2016-2026 (USD Million)
7.6.6.2 Market Size, By Type, 2016-2026 (USD Million)
7.6.6.3 Market Size, By Application, 2016-2026 (USD Million)
7.6.7 South Africa
7.6.7.1 Market Size, By Component, 2016-2026 (USD Million)
7.6.7.2 Market Size, By Type, 2016-2026 (USD Million)
7.6.7.3 Market Size, By Application, 2016-2026 (USD Million)
Chapter 8 Company Landscape
8.1 Competitive Analysis, 2020
8.2 Bosch Security Systems
8.2.1 Company Overview
8.2.2 Financial Analysis
8.2.3 Strategic Positioning
8.2.4 Info Graphic Analysis
8.3 Tagmaster
8.3.1 Company Overview
8.3.2 Financial Analysis
8.3.3 Strategic Positioning
8.3.4 Info Graphic Analysis
8.4 Neology
8.4.1 Company Overview
8.4.2 Financial Analysis
8.4.3 Strategic Positioning
8.4.4 Info Graphic Analysis
8.5 6 Arh Inc.
8.5.1 Company Overview
8.5.2 Financial Analysis
8.5.3 Strategic Positioning
8.5.4 Info Graphic Analysis
8.6 Vigilant Solutions
8.6.1 Company Overview
8.6.2 Financial Analysis
8.6.3 Strategic Positioning
8.6.4 Info Graphic Analysis
8.7 Genetec Inc.
8.7.1 Company Overview
8.7.2 Financial Analysis
8.7.3 Strategic Positioning
8.7.4 Info Graphic Analysis
8.8 Kapsch TrafficCom AG
8.8.1 Company Overview
8.8.2 Financial Analysis
8.8.3 Strategic Positioning
8.8.4 Info Graphic Analysis
8.9 Siemens AG
8.9.1 Company Overview
8.9.2 Financial Analysis
8.9.3 Strategic Positioning
8.9.4 Info Graphic Analysis
8.10 Conduent, Inc.,
8.10.1 Company Overview
8.10.2 Financial Analysis
8.10.3 Strategic Positioning
8.10.4 Info Graphic Analysis
8.11 Q-Free ASA
8.11.1 Company Overview
8.11.2 Financial Analysis
8.11.3 Strategic Positioning
8.11.4 Info Graphic Analysis
The Global ANPR System Market has been studied from the year 2019 till 2026. However, the CAGR provided in the report is from the year 2021 to 2026. The research methodology involved three stages: Desk research, Primary research, and Analysis & Output from the entire research process.

The desk research involved a robust background study which meant referring to paid and unpaid databases to understand the market dynamics; mapping contracts from press releases; identifying the key players in the market, studying their product portfolio, competition level, annual reports/SEC filings & investor presentations; and learning the demand and supply-side analysis for the ANPR System Market.

The primary research activity included telephonic conversations with more than 50 tier 1 industry consultants, distributors, and end-use product manufacturers.

Finally, based on the above thorough research process, an in-depth analysis was carried out considering the following aspects: market attractiveness, current & future market trends, market share analysis, SWOT analysis of the company and customer analytics.


This FREE sample includes market data points, ranging from trend analyses to market estimates & forecasts. See for yourself.
Or view our licence options:
Tailor made solutions just for you
80% of our clients seek made-to-order reports. How do you want us to tailor yours?
OUR CLIENTS


