This report was recently updated on July 11 2025 with the latest and most recent
market numbers
Global Micro Computed Tomography Market Size, Trends & Analysis - Forecasts to 2028 By Product (In-vivo and Ex-vivo), By Application (Life Sciences, Bones, Dentistry, Plants and Food, Material Science, and Geology/Oil and Gas Geology), and By Region (North America, Asia Pacific, Central and South America, Europe, and Middle East and Africa), Competitive Landscape, Company Market Share Analysis, and End User Analysis
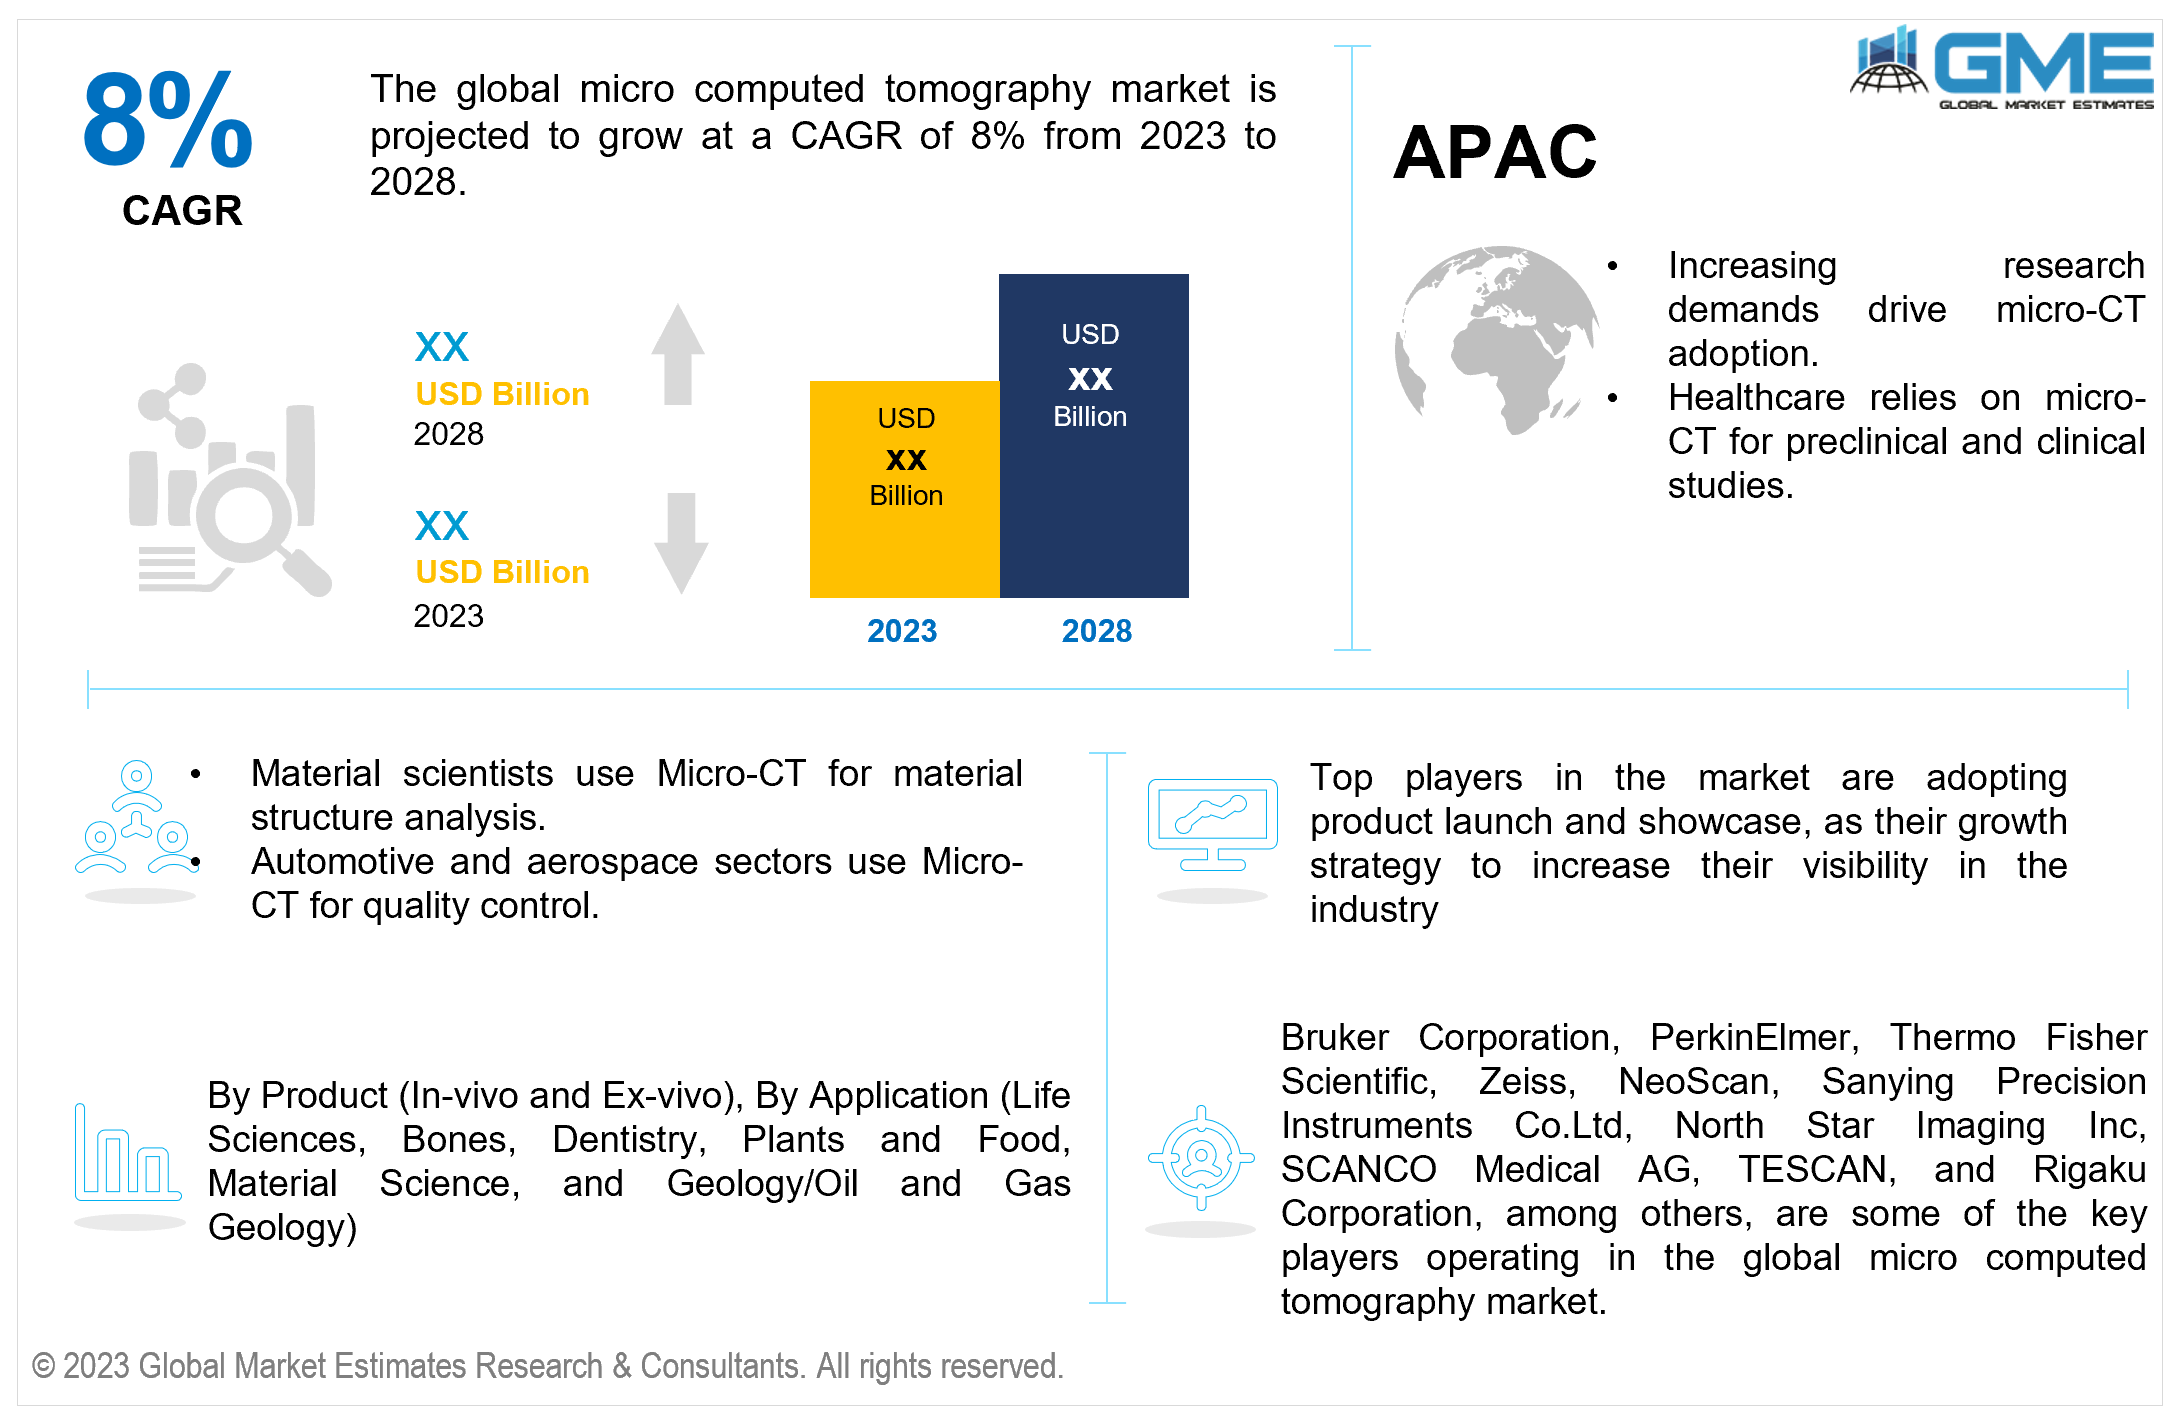
The global micro computed tomography market is projected to grow at a CAGR of 8% from 2023 to 2028.
Micro-CT offers several advantages, including a narrow bandwidth, monochromatic X-rays with nearly parallel beams, high X-ray flux for fast scanning and deep exploration, excellent spatial resolution, sensitivity to bone and lung details, cost-effectiveness, and short exposure times.
Ongoing technological progress has resulted in effective micro-CT systems, facilitating enhanced imaging resolution and faster scanning timing. The versatility of micro-CT has led to its adoption in various fields, including materials science, life sciences, geology, dentistry, and more. The growing range of applications is driving the demand for micro-CT systems.
In July 2021, North Star Imaging (NSI) launched the MeVX product, which includes high-energy X-ray systems operating at energy levels of 3, 6, and 9 million electron volts (MeV). These MeVX systems cater to the demand for higher-energy X-ray inspection, especially for thicker components that pose difficulties when scanned with conventional, lower-energy X-ray apparatus. However, the effectiveness of this system relies significantly on complex computer hardware and software.
Additionally, potential challenges such as frequent technical issues may pose obstacles to the market growth.
Moreover, the increasing chronic diseases and the aging population are propelling market expansion. According to International Osteoporosis Foundation (IOF) in 2019, approximately 200 million individuals globally, with one in three women and one in five men aged 50 and above, suffer from osteoporosis-related fractures, resulting in a fracture occurring every three seconds. The use of CT scans to create three-dimensional bone images enables more precise diagnoses and orthopedic surgical procedures. Hence, the growing prevalence of orthopedic conditions, the demand for micro-CT is expected to experience a corresponding increase.
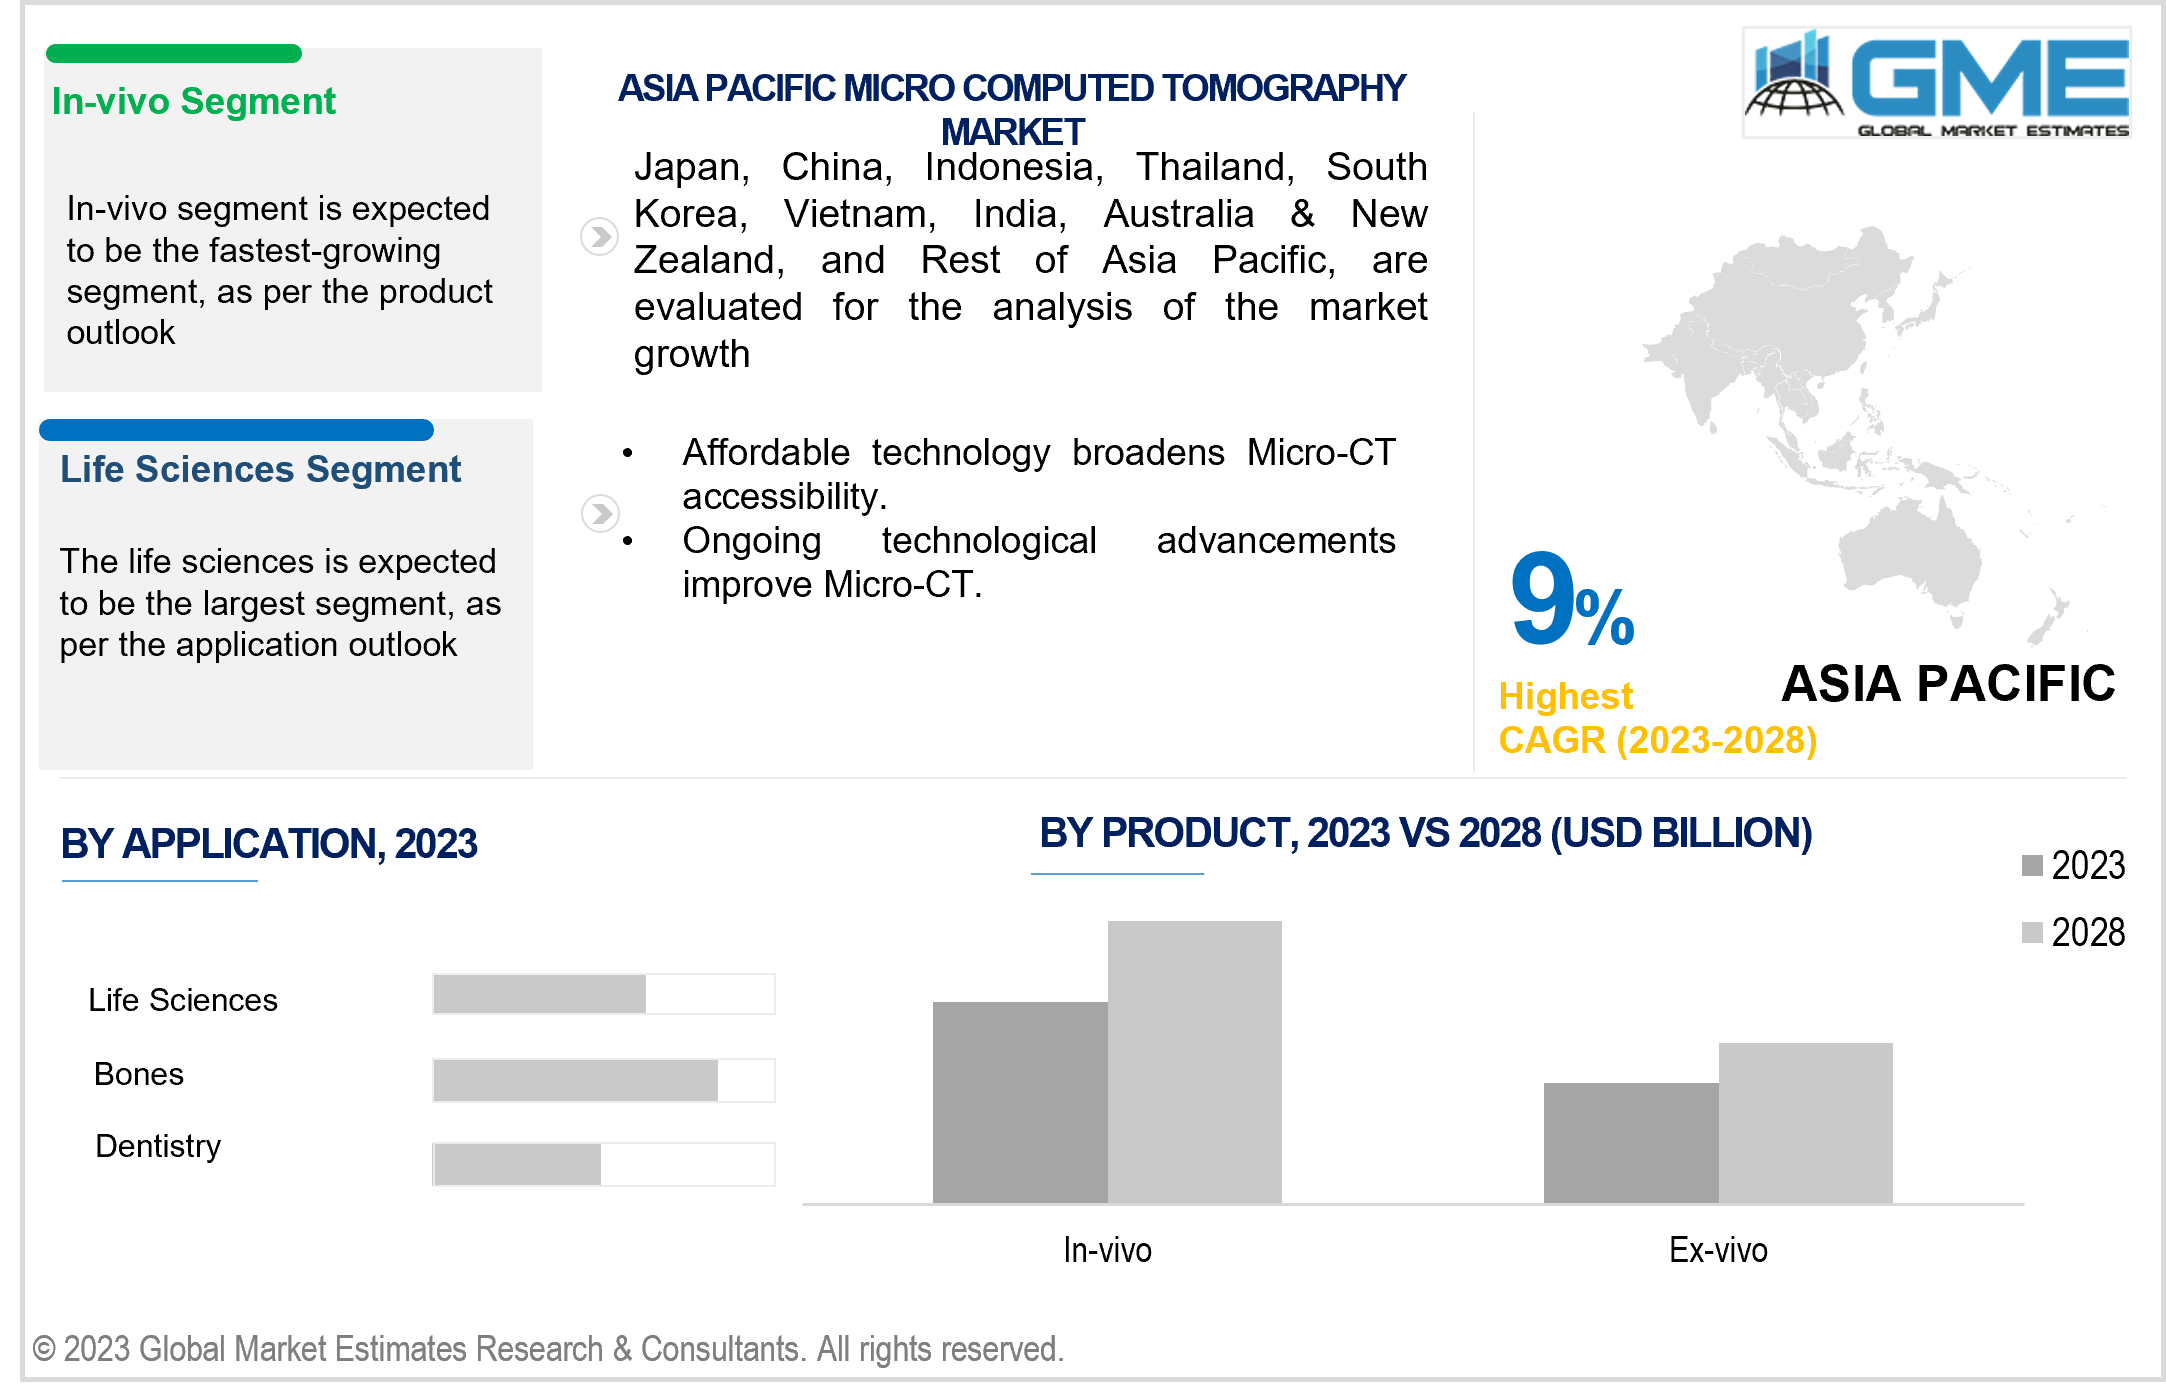
Life sciences segment is expected to hold the largest share in the market. This was primarily due to the exceptional capabilities of micro-CT in delivering high-resolution structural imaging and nanomechanical measurements, which offer valuable insights for a wide range of applications within the life sciences field. Its applications include examination, such oncology, structural biology, neurosciences, and cardiovascular research.
Dentistry segment is expected to be the fastest-growing segment in the market from 2023-2028. This is attributed to the wide range of applications that Micro-CT encompasses, ranging from dental research to treatment purposes. Micro-CT technology excels in producing high-quality images that capture intricate details of teeth and their surrounding structures, covering everything from the outer to the innermost layers. Moreover, CT scanning data can be harnessed to create detailed 3D digital models of teeth.
Ex-vivo is anticipated to be the fastest-growing segment in the market from 2023-2028. Ex-vivo micro-CT scanners find application in various fields, including biomaterial studies, implants in large animals, materials research, compression studies, and investigations involving excised organs such as lungs, bones, tumors, implants, and grafts.
In-vivo segment is expected to hold the largest share of the market. In-vivo CT scanners are designed to scan longer objects, making them particularly useful for studies that investigate the effects of factors like nutrition, drugs, body mass, and various treatments on hormones, cancer, bone quality, bone growth, and various models of regeneration. One notable benefit of these scanners is their ability to contribute to the reduction of animal usage in research.
In addition, in-vivo micro-CT data serves as a valuable reference for registering micro-PET or micro-SPECT scans, enhancing the precision and usefulness of these imaging techniques.
North America is expected to be the largest region in the market. The primary reasons boosting the market growth in this region include increasing number of competitors in the market and a continuous advancement in technology. Additionally, increased funding for research activities in North America has had a positive impact. The United States, in particular, stands out with the highest per capita healthcare spending and access to substantial funds and grants from government institutions like the National Institutes of Health (NIH), which support various research in the micro computed tomography.
Asia Pacific is predicted to witness rapid growth during the forecast period. This growth can be attributed to an increased demand for imaging equipment and an increasing occurrence of research in the region. Furthermore, many manufacturers are making significant investments in this geographic area. For instance, in June 2020, companies such as DKSH Business Unit Technology and Bruker have expanded their partnership in the Asian region, with a particular emphasis on distributing Bruker X-ray Fluorescence (XRF) devices like S2 PUMA and S2 POLAR in China.
Bruker Corporation, PerkinElmer, Thermo Fisher Scientific, Zeiss, NeoScan, Sanying Precision Instruments Co.Ltd, North Star Imaging Inc, SCANCO Medical AG, TESCAN, and Rigaku Corporation, among others, are some of the key players operating in the global micro computed tomography market.
Please note: This is not an exhaustive list of companies profiled in the report
In August 2021, Tescan introduced the UniTOM HR, it offers sub-micron precision for static 3D imaging without causing damage, as well as exceptional temporal resolution for continous 4D dynamic CT research. Tescan highlights that the UniTOM HR serves as an excellent tool for both industrial and academic researchers. It caters to those seeking micro-CT imaging capabilities to explore the internal structure of samples while gaining a deeper understanding the behaviour of samples under different environmental conditions.
1 STRATEGIC INSIGHTS ON NEW REVENUE POCKETS
1.1 Strategic Opportunity & Attractiveness Analysis
1.1.1 Hot Revenue Pockets
1.1.2 Market Attractiveness Score
1.1.3 Revenue Impacting Opportunity
1.1.4 High Growing Region/Country
1.1.5 Competitor Analysis
1.1.6 Consumer Analysis
1.2 Global Market Estimates' View
1.3 Strategic Insights across Business Functions
1.3.1 For Chief Executive Officers
1.3.2 For Chief Marketing Officers
1.3.3 For Chief Strategy Officers
1.4 Evaluate the Potential of your Existing Business Lines vs. New Lines to Enter Into
2 TECHNOLOGICAL TRENDS
2.1 Technological Adoption Rate
2.2 Current Trend Impact Analysis
2.3 Future Trend Impact Analysis
3 GLOBAL MARKET OUTLOOK
3.1 Market Pyramid Analysis
3.1.1 Introduction
3.1.2 Adjacent Market Opportunities
3.1.3 Ancillary Market Opportunities
3.2 Demand Side Analysis
3.2.1 Market Drivers: Impact Analysis
3.2.2 Market Restraints: Impact Analysis
3.2.3 Market Opportunities: Impact Analysis
3.2.4 Market Challenges: Impact Analysis
3.3 Supply Side Analysis
3.3.1 Porter’s Five Forces Analysis
3.3.1.1 Threat of New Entrants
3.3.1.2 Threat of New Substitutes
3.3.1.3 Bargaining Power of Suppliers
3.3.1.4 Bargaining Power of Buyers
3.3.1.5 Intensity of Competitive Rivalry
3.3.2 SWOT Analysis; By Factor (Political & Legal, Economic, and Technological)
3.3.2.1 Political Landscape
3.3.2.2 Economic Landscape
3.3.2.3 Social Landscape
3.3.2.4 Technology Landscape
3.3.3 Value Chain Analysis
3.3.4 Trend Analysis
3.3.5 Gap Analysis
3.3.6 Cost Analysis
4 GLOBAL MICRO COMPUTED TOMOGRAPHY MARKET, BY APPLICATION
4.1 Introduction
4.2 Micro Computed Tomography Market: Application Scope Key Takeaways
4.3 Revenue Growth Analysis, 2022 & 2028
4.4 Life Sciences
4.4.1 Life Sciences Market Estimates and Forecast, 2020-2028 (USD Million)
4.5 Bones
4.5.1 Bones Market Estimates and Forecast, 2020-2028 (USD Million)
4.6 Dentistry
4.6.1 Dentistry Market Estimates and Forecast, 2020-2028 (USD Million)
4.7 Plants and Food
4.7.1 Plants and Food Market Estimates and Forecast, 2020-2028 (USD Million)
4.8 Material Science
4.8.1 Material Science Market Estimates and Forecast, 2020-2028 (USD Million)
4.9 Geology/Oil and Gas Geology
4.9.1 Geology/Oil and Gas Geology Market Estimates and Forecast, 2020-2028 (USD Million)
5 GLOBAL MICRO COMPUTED TOMOGRAPHY MARKET, BY PRODUCT
5.1 Introduction
5.2 Micro Computed Tomography Market: Product Scope Key Takeaways
5.3 Revenue Growth Analysis, 2022 & 2028
5.4 In-vivo
5.4.1 In-vivo Market Estimates and Forecast, 2020-2028 (USD Million)
5.5 Ex-vivo
5.5.1 Ex-vivo Market Estimates and Forecast, 2020-2028 (USD Million)
6 GLOBAL MICRO COMPUTED TOMOGRAPHY MARKET, BY REGION
6.1 Introduction
6.2 North America Micro Computed Tomography Market Estimates and Forecast, 2020-2028 (USD Million)
6.2.1 By Application
6.2.2 By Product
6.2.3 By Country
6.2.3.1 U.S. Micro Computed Tomography Market Estimates and Forecast, 2020-2028 (USD Million)
6.2.3.1.1 By Application
6.2.3.1.2 By Product
6.2.3.2 Canada Micro Computed Tomography Market Estimates and Forecast, 2020-2028 (USD Million)
6.2.3.2.1 By Application
6.2.3.2.2 By Product
6.2.3.3 Mexico Micro Computed Tomography Market Estimates and Forecast, 2020-2028 (USD Million)
6.2.3.3.1 By Application
6.2.3.3.2 By Product
6.3 Europe Micro Computed Tomography Market Estimates and Forecast, 2020-2028 (USD Million)
6.3.1 By Application
6.3.2 By Product
6.3.3 By Country
6.3.3.1 Germany Micro Computed Tomography Market Estimates and Forecast, 2020-2028 (USD Million)
6.3.3.1.1 By Application
6.3.3.1.2 By Product
6.3.3.2 U.K. Micro Computed Tomography Market Estimates and Forecast, 2020-2028 (USD Million)
6.3.3.2.1 By Application
6.3.3.2.2 By Product
6.3.3.3 France Micro Computed Tomography Market Estimates and Forecast, 2020-2028 (USD Million)
6.3.3.3.1 By Application
6.3.3.3.2 By Product
6.3.3.4 Italy Micro Computed Tomography Market Estimates and Forecast, 2020-2028 (USD Million)
6.3.3.4.1 By Application
6.3.3.4.2 By Product
6.3.3.5 Spain Micro Computed Tomography Market Estimates and Forecast, 2020-2028 (USD Million)
6.3.3.5.1 By Application
6.3.3.5.2 By Product
6.3.3.6 Netherlands Micro Computed Tomography Market Estimates and Forecast, 2020-2028 (USD Million)
6.3.3.6.1 By Application
6.3.3.6.2 By Product
6.3.3.7 Rest of Europe Micro Computed Tomography Market Estimates and Forecast, 2020-2028 (USD Million)
6.3.3.6.1 By Application
6.3.3.6.2 By Product
6.4 Asia Pacific Micro Computed Tomography Market Estimates and Forecast, 2020-2028 (USD Million)
6.4.1 By Application
6.4.2 By Product
6.4.3 By Country
6.4.3.1 China Micro Computed Tomography Market Estimates and Forecast, 2020-2028 (USD Million)
6.4.3.1.1 By Application
6.4.3.1.2 By Product
6.4.3.2 Japan Micro Computed Tomography Market Estimates and Forecast, 2020-2028 (USD Million)
6.4.3.2.1 By Application
6.4.3.2.2 By Product
6.4.3.3 India Micro Computed Tomography Market Estimates and Forecast, 2020-2028 (USD Million)
6.4.3.3.1 By Application
6.4.3.3.2 By Product
6.4.3.4 South Korea Micro Computed Tomography Market Estimates and Forecast, 2020-2028 (USD Million)
6.4.3.4.1 By Application
6.4.3.4.2 By Product
6.4.3.5 Singapore Micro Computed Tomography Market Estimates and Forecast, 2020-2028 (USD Million)
6.4.3.5.1 By Application
6.4.3.5.2 By Product
6.4.3.6 Malaysia Micro Computed Tomography Market Estimates and Forecast, 2020-2028 (USD Million)
6.4.3.6.1 By Application
6.4.3.6.2 By Product
6.4.3.7 Thailand Micro Computed Tomography Market Estimates and Forecast, 2020-2028 (USD Million)
6.4.3.6.1 By Application
6.4.3.6.2 By Product
6.4.3.8 Indonesia Micro Computed Tomography Market Estimates and Forecast, 2020-2028 (USD Million)
6.4.3.7.1 By Application
6.4.3.7.2 By Product
6.4.3.9 Vietnam Micro Computed Tomography Market Estimates and Forecast, 2020-2028 (USD Million)
6.4.3.8.1 By Application
6.4.3.8.2 By Product
6.4.3.10 Taiwan Micro Computed Tomography Market Estimates and Forecast, 2020-2028 (USD Million)
6.4.3.10.1 By Application
6.4.3.10.2 By Product
6.4.3.11 Rest of Asia Pacific Micro Computed Tomography Market Estimates and Forecast, 2020-2028 (USD Million)
6.4.3.11.1 By Application
6.4.3.11.2 By Product
6.5 Middle East and Africa Micro Computed Tomography Market Estimates and Forecast, 2020-2028 (USD Million)
6.5.1 By Application
6.5.2 By Product
6.5.3 By Country
6.5.3.1 Saudi Arabia Micro Computed Tomography Market Estimates and Forecast, 2020-2028 (USD Million)
6.5.3.1.1 By Application
6.5.3.1.2 By Product
6.5.3.2 U.A.E. Micro Computed Tomography Market Estimates and Forecast, 2020-2028 (USD Million)
6.5.3.2.1 By Application
6.5.3.2.2 By Product
6.5.3.3 Israel Micro Computed Tomography Market Estimates and Forecast, 2020-2028 (USD Million)
6.5.3.3.1 By Application
6.5.3.3.2 By Product
6.5.3.4 South Africa Micro Computed Tomography Market Estimates and Forecast, 2020-2028 (USD Million)
6.5.3.4.1 By Application
6.5.3.4.2 By Product
6.5.3.5 Rest of Middle East and Africa Micro Computed Tomography Market Estimates and Forecast, 2020-2028 (USD Million)
6.5.3.5.1 By Application
6.5.3.5.2 By Product
6.6 Central and South America Micro Computed Tomography Market Estimates and Forecast, 2020-2028 (USD Million)
6.6.1 By Application
6.6.2 By Product
6.6.3 By Country
6.6.3.1 Brazil Micro Computed Tomography Market Estimates and Forecast, 2020-2028 (USD Million)
6.6.3.1.1 By Application
6.6.3.1.2 By Product
6.6.3.2 Argentina Micro Computed Tomography Market Estimates and Forecast, 2020-2028 (USD Million)
6.6.3.2.1 By Application
6.6.3.2.2 By Product
6.6.3.3 Chile Micro Computed Tomography Market Estimates and Forecast, 2020-2028 (USD Million)
6.6.3.3.1 By Application
6.6.3.3.2 By Product
6.6.3.3 Rest of Central and South America Micro Computed Tomography Market Estimates and Forecast, 2020-2028 (USD Million)
6.6.3.3.1 By Application
6.6.3.3.2 By Product
7 COMPETITIVE LANDCAPE
7.1 Company Market Share Analysis
7.2 Four Quadrant Positioning Matrix
7.2.1 Market Leaders
7.2.2 Market Visionaries
7.2.3 Market Challengers
7.2.4 Niche Market Players
7.3 Vendor Landscape
7.3.1 North America
7.3.2 Europe
7.3.3 Asia Pacific
7.3.4 Rest of the World
7.4 Company Profiles
7.4.1 Bruker Corporation
7.4.1.1 Business Description & Financial Analysis
7.4.1.2 SWOT Analysis
7.4.1.3 Products & Services Offered
7.4.1.4 Strategic Alliances between Business Partners
7.4.2 PerkinElmer
7.4.2.1 Business Description & Financial Analysis
7.4.2.2 SWOT Analysis
7.4.2.3 Products & Services Offered
7.4.2.4 Strategic Alliances between Business Partners
7.4.3 Thermo Fisher Scientific
7.4.3.1 Business Description & Financial Analysis
7.4.3.2 SWOT Analysis
7.4.3.3 Products & Services Offered
7.4.3.4 Strategic Alliances between Business Partners
7.4.4 Zeiss
7.4.4.1 Business Description & Financial Analysis
7.4.4.2 SWOT Analysis
7.4.4.3 Products & Services Offered
7.4.4.4 Strategic Alliances between Business Partners
7.4.5 NeoScan
7.4.5.1 Business Description & Financial Analysis
7.4.5.2 SWOT Analysis
7.4.5.3 Products & Services Offered
7.4.5.4 Strategic Alliances between Business Partners
7.4.6 Sanying Precision Instruments Co.Ltd
7.4.6.1 Business Description & Financial Analysis
7.4.6.2 SWOT Analysis
7.4.6.3 Products & Services Offered
7.4.6.4 Strategic Alliances between Business Partners
7.4.7 North Star Imaging Inc
7.4.7.1 Business Description & Financial Analysis
7.4.7.2 SWOT Analysis
7.4.7.3 Products & Services Offered
7.4.7.4 Strategic Alliances between Business Partners
7.4.8 SCANCO Medical AG
7.4.8.1 Business Description & Financial Analysis
7.4.8.2 SWOT Analysis
7.4.8.3 Products & Services Offered
7.4.8.4 Strategic Alliances between Business Partners
7.4.9 TESCAN
7.4.9.1 Business Description & Financial Analysis
7.4.9.2 SWOT Analysis
7.4.9.3 Products & Services Offered
7.4.9.4 Strategic Alliances between Business Partners
7.4.10 Rigaku Corporation
7.4.10.1 Business Description & Financial Analysis
7.4.10.2 SWOT Analysis
7.4.10.3 Products & Services Offered
7.4.10.4 Strategic Alliances between Business Partners
7.4.11 Other Companies
7.4.11.1 Business Description & Financial Analysis
7.4.11.2 SWOT Analysis
7.4.11.3 Products & Services Offered
7.4.11.4 Strategic Alliances between Business Partners
8 RESEARCH METHODOLOGY
8.1 Market Introduction
8.1.1 Market Definition
8.1.2 Market Scope & Segmentation
8.2 Information Procurement
8.2.1 Secondary Research
8.2.1.1 Purchased Databases
8.2.1.2 GMEs Internal Data Repository
8.2.1.3 Secondary Resources & Third Party Perspectives
8.2.1.4 Company Information Sources
8.2.2 Primary Research
8.2.2.1 Various Types of Respondents for Primary Interviews
8.2.2.2 Number of Interviews Conducted throughout the Research Process
8.2.2.3 Primary Stakeholders
8.2.2.4 Discussion Guide for Primary Participants
8.2.3 Expert Panels
8.2.3.1 Expert Panels Across 30+ Industry
8.2.4 Paid Local Experts
8.2.4.1 Paid Local Experts Across 30+ Industry Across each Region
8.3 Market Estimation
8.3.1 Top-Down Approach
8.3.1.1 Macro-Economic Indicators Considered
8.3.1.2 Micro-Economic Indicators Considered
8.3.2 Bottom Up Approach
8.3.2.1 Company Share Analysis Approach
8.3.2.2 Estimation of Potential Product Sales
8.4 Data Triangulation
8.4.1 Data Collection
8.4.2 Time Series, Cross Sectional & Panel Data Analysis
8.4.3 Cluster Analysis
8.5 Analysis and Output
8.5.1 Inhouse AI Based Real Time Analytics Tool
8.5.2 Output From Desk & Primary Research
8.6 Research Assumptions & Limitations
8.6.1 Research Assumptions
8.6.2 Research Limitations
LIST OF TABLES
1 Global Micro Computed Tomography Market, By Application, 2020-2028 (USD Mllion)
2 Life Sciences Market, By Region, 2020-2028 (USD Mllion)
3 Bones Market, By Region, 2020-2028 (USD Mllion)
4 Dentistry Market, By Region, 2020-2028 (USD Mllion)
5 Plants and Food Market, By Region, 2020-2028 (USD Mllion)
6 Material Science Market, By Region, 2020-2028 (USD Mllion)
7 Geology/Oil and Gas Geology Market, By Region, 2020-2028 (USD Mllion)
8 Global Micro Computed Tomography Market, By Product, 2020-2028 (USD Mllion)
9 In-vivo Market, By Region, 2020-2028 (USD Mllion)
10 Ex-vivo Market, By Region, 2020-2028 (USD Mllion)
11 Regional Analysis, 2020-2028 (USD Mllion)
12 North America Micro Computed Tomography Market, By Application, 2020-2028 (USD Mllion)
13 North America Micro Computed Tomography Market, By Product, 2020-2028 (USD Mllion)
14 North America Micro Computed Tomography Market, By country 2020-2028 (USD Mllion)
15 U.S. Micro Computed Tomography Market, By Application, 2020-2028 (USD Mllion)
16 U.S. Micro Computed Tomography Market, By Product, 2020-2028 (USD Mllion)
17 Canada Micro Computed Tomography Market, By Application, 2020-2028 (USD Mllion)
18 Canada Micro Computed Tomography Market, By Product, 2020-2028 (USD Mllion)
19 Mexico Micro Computed Tomography Market, By Application, 2020-2028 (USD Mllion)
20 Mexico Micro Computed Tomography Market, By Product, 2020-2028 (USD Mllion)
21 Europe Micro Computed Tomography Market, By Application, 2020-2028 (USD Mllion)
22 Europe Micro Computed Tomography Market, By Product, 2020-2028 (USD Mllion)
23 Europe Micro Computed Tomography Market, By country, 2020-2028 (USD Mllion)
24 Germany Micro Computed Tomography Market, By Application, 2020-2028 (USD Mllion)
25 Germany Micro Computed Tomography Market, By Product, 2020-2028 (USD Mllion)
26 U.K. Micro Computed Tomography Market, By Application, 2020-2028 (USD Mllion)
27 U.K. Micro Computed Tomography Market, By Product, 2020-2028 (USD Mllion)
28 France Micro Computed Tomography Market, By Application, 2020-2028 (USD Mllion)
29 France Micro Computed Tomography Market, By Product, 2020-2028 (USD Mllion)
30 Italy Micro Computed Tomography Market, By Application, 2020-2028 (USD Mllion)
31 Italy Micro Computed Tomography Market, By Product, 2020-2028 (USD Mllion)
32 Spain Micro Computed Tomography Market, By Application, 2020-2028 (USD Mllion)
33 Spain Micro Computed Tomography Market, By Product, 2020-2028 (USD Mllion)
34 Netherlands Micro Computed Tomography Market, By Application, 2020-2028 (USD Mllion)
35 Netherlands Micro Computed Tomography Market, By Product, 2020-2028 (USD Mllion)
36 Rest Of Europe Micro Computed Tomography Market, By Application, 2020-2028 (USD Mllion)
37 Rest Of Europe Micro Computed Tomography Market, By Product, 2020-2028 (USD Mllion)
38 Asia Pacific Micro Computed Tomography Market, By Application, 2020-2028 (USD Mllion)
39 Asia Pacific Micro Computed Tomography Market, By Product, 2020-2028 (USD Mllion)
40 Asia Pacific Micro Computed Tomography Market, By country, 2020-2028 (USD Mllion)
41 China Micro Computed Tomography Market, By Application, 2020-2028 (USD Mllion)
42 China Micro Computed Tomography Market, By Product, 2020-2028 (USD Mllion
43 Japan Micro Computed Tomography Market, By Application, 2020-2028 (USD Mllion)
44 Japan Micro Computed Tomography Market, By Product, 2020-2028 (USD Mllion)
45 India Micro Computed Tomography Market, By Application, 2020-2028 (USD Mllion)
46 India Micro Computed Tomography Market, By Product, 2020-2028 (USD Mllion)
47 South Korea Micro Computed Tomography Market, By Application, 2020-2028 (USD Mllion)
48 South Korea Micro Computed Tomography Market, By Product, 2020-2028 (USD Mllion)
49 Singapore Micro Computed Tomography Market, By Application, 2020-2028 (USD Mllion)
50 Singapore Micro Computed Tomography Market, By Product, 2020-2028 (USD Mllion)
51 Thailand Micro Computed Tomography Market, By Application, 2020-2028 (USD Mllion)
52 Thailand Micro Computed Tomography Market, By Product, 2020-2028 (USD Mllion)
53 Malaysia Micro Computed Tomography Market, By Application, 2020-2028 (USD Mllion)
54 Malaysia Micro Computed Tomography Market, By Product, 2020-2028 (USD Mllion)
55 Indonesia Micro Computed Tomography Market, By Application, 2020-2028 (USD Mllion)
56 Indonesia Micro Computed Tomography Market, By Product, 2020-2028 (USD Mllion)
57 Vietnam Micro Computed Tomography Market, By Application, 2020-2028 (USD Mllion)
58 Vietnam Micro Computed Tomography Market, By Product, 2020-2028 (USD Mllion)
59 Taiwan Micro Computed Tomography Market, By Application, 2020-2028 (USD Mllion)
60 Taiwan Micro Computed Tomography Market, By Product, 2020-2028 (USD Mllion)
61 Rest of APAC Micro Computed Tomography Market, By Application, 2020-2028 (USD Mllion)
62 Rest of APAC Micro Computed Tomography Market, By Product, 2020-2028 (USD Mllion)
63 Middle East and Africa Micro Computed Tomography Market, By Application, 2020-2028 (USD Mllion)
64 Middle East and Africa Micro Computed Tomography Market, By Product, 2020-2028 (USD Mllion)
65 Middle East and Africa Micro Computed Tomography Market, By country, 2020-2028 (USD Mllion)
66 Saudi Arabia Micro Computed Tomography Market, By Application, 2020-2028 (USD Mllion)
67 Saudi Arabia Micro Computed Tomography Market, By Product, 2020-2028 (USD Mllion)
68 UAE Micro Computed Tomography Market, By Application, 2020-2028 (USD Mllion)
69 UAE Micro Computed Tomography Market, By Product, 2020-2028 (USD Mllion)
70 Israel Micro Computed Tomography Market, By Application, 2020-2028 (USD Mllion)
71 Israel Micro Computed Tomography Market, By Product, 2020-2028 (USD Mllion)
72 South Africa Micro Computed Tomography Market, By Application, 2020-2028 (USD Mllion)
73 South Africa Micro Computed Tomography Market, By Product, 2020-2028 (USD Mllion)
74 Rest Of Middle East and Africa Micro Computed Tomography Market, By Application, 2020-2028 (USD Mllion)
75 Rest Of Middle East and Africa Micro Computed Tomography Market, By Product, 2020-2028 (USD Mllion)
76 Central and South America Micro Computed Tomography Market, By Application, 2020-2028 (USD Mllion)
77 Central and South America Micro Computed Tomography Market, By Product, 2020-2028 (USD Mllion)
78 Central and South America Micro Computed Tomography Market, By country, 2020-2028 (USD Mllion)
79 Brazil Micro Computed Tomography Market, By Application, 2020-2028 (USD Mllion)
80 Brazil Micro Computed Tomography Market, By Product, 2020-2028 (USD Mllion)
81 Chile Micro Computed Tomography Market, By Application, 2020-2028 (USD Mllion)
82 Chile Micro Computed Tomography Market, By Product, 2020-2028 (USD Mllion)
83 Argentina Micro Computed Tomography Market, By Application, 2020-2028 (USD Mllion)
84 Argentina Micro Computed Tomography Market, By Product, 2020-2028 (USD Mllion)
85 Rest Of Central and South America Micro Computed Tomography Market, By Application, 2020-2028 (USD Mllion)
86 Rest Of Central and South America Micro Computed Tomography Market, By Product, 2020-2028 (USD Mllion)
87 Bruker Corporation: Products & Services Offering
88 PerkinElmer: Products & Services Offering
89 Thermo Fisher Scientific: Products & Services Offering
90 Zeiss: Products & Services Offering
91 NeoScan: Products & Services Offering
92 SANYING PRECISION INSTRUMENTS CO.LTD: Products & Services Offering
93 North Star Imaging Inc : Products & Services Offering
94 SCANCO Medical AG: Products & Services Offering
95 TESCAN, Inc: Products & Services Offering
96 Rigaku Corporation: Products & Services Offering
97 Other Companies: Products & Services Offering
LIST OF FIGURES
1 Global Micro Computed Tomography Market Overview
2 Global Micro Computed Tomography Market Value From 2020-2028 (USD Mllion)
3 Global Micro Computed Tomography Market Share, By Application (2022)
4 Global Micro Computed Tomography Market Share, By Product (2022)
5 Global Micro Computed Tomography Market, By Region (Asia Pacific Market)
6 Technological Trends In Global Micro Computed Tomography Market
7 Four Quadrant Competitor Positioning Matrix
8 Impact Of Macro & Micro Indicators On The Market
9 Impact Of Key Drivers On The Global Micro Computed Tomography Market
10 Impact Of Challenges On The Global Micro Computed Tomography Market
11 Porter’s Five Forces Analysis
12 Global Micro Computed Tomography Market: By Application Scope Key Takeaways
13 Global Micro Computed Tomography Market, By Application Segment: Revenue Growth Analysis
14 Life Sciences Market, By Region, 2020-2028 (USD Mllion)
15 Bones Market, By Region, 2020-2028 (USD Mllion)
16 Dentistry Market, By Region, 2020-2028 (USD Mllion)
17 Plants and Food Market, By Region, 2020-2028 (USD Mllion)
18 Material Science Market, By Region, 2020-2028 (USD Mllion)
19 Geology/Oil and Gas Geology Market, By Region, 2020-2028 (USD Mllion)
20 Global Micro Computed Tomography Market: By Product Scope Key Takeaways
21 Global Micro Computed Tomography Market, By Product Segment: Revenue Growth Analysis
22 In-vivo Market, By Region, 2020-2028 (USD Mllion)
23 Ex-vivo Market, By Region, 2020-2028 (USD Mllion)
24 Regional Segment: Revenue Growth Analysis
25 Global Micro Computed Tomography Market: Regional Analysis
26 North America Micro Computed Tomography Market Overview
27 North America Micro Computed Tomography Market, By Application
28 North America Micro Computed Tomography Market, By Product
29 North America Micro Computed Tomography Market, By Country
30 U.S. Micro Computed Tomography Market, By Application
31 U.S. Micro Computed Tomography Market, By Product
32 Canada Micro Computed Tomography Market, By Application
33 Canada Micro Computed Tomography Market, By Product
34 Mexico Micro Computed Tomography Market, By Application
35 Mexico Micro Computed Tomography Market, By Product
36 Four Quadrant Positioning Matrix
37 Company Market Share Analysis
38 Bruker Corporation: Company Snapshot
39 Bruker Corporation: SWOT Analysis
40 Bruker Corporation: Geographic Presence
41 PerkinElmer: Company Snapshot
42 PerkinElmer: SWOT Analysis
43 PerkinElmer: Geographic Presence
44 Thermo Fisher Scientific: Company Snapshot
45 Thermo Fisher Scientific: SWOT Analysis
46 Thermo Fisher Scientific: Geographic Presence
47 Zeiss: Company Snapshot
48 Zeiss: Swot Analysis
49 Zeiss: Geographic Presence
50 NeoScan: Company Snapshot
51 NeoScan: SWOT Analysis
52 NeoScan: Geographic Presence
53 Sanying Precision Instruments Co.Ltd: Company Snapshot
54 Sanying Precision Instruments Co.Ltd: SWOT Analysis
55 Sanying Precision Instruments Co.Ltd: Geographic Presence
56 North Star Imaging Inc : Company Snapshot
57 North Star Imaging Inc : SWOT Analysis
58 North Star Imaging Inc : Geographic Presence
59 Scanco Medical AG: Company Snapshot
60 Scanco Medical AG: SWOT Analysis
61 Scanco Medical AG: Geographic Presence
62 Tescan, Inc.: Company Snapshot
63 Tescan, Inc.: SWOT Analysis
64 Tescan, Inc.: Geographic Presence
65 Rigaku Corporation: Company Snapshot
66 Rigaku Corporation: SWOT Analysis
67 Rigaku Corporation: Geographic Presence
68 Other Companies: Company Snapshot
69 Other Companies: SWOT Analysis
70 Other Companies: Geographic Presence
The Global Micro Computed Tomography Market has been studied from the year 2019 till 2028. However, the CAGR provided in the report is from the year 2023 to 2028. The research methodology involved three stages: Desk research, Primary research, and Analysis & Output from the entire research process.

The desk research involved a robust background study which meant referring to paid and unpaid databases to understand the market dynamics; mapping contracts from press releases; identifying the key players in the market, studying their product portfolio, competition level, annual reports/SEC filings & investor presentations; and learning the demand and supply-side analysis for the Micro Computed Tomography Market.

The primary research activity included telephonic conversations with more than 50 tier 1 industry consultants, distributors, and end-use product manufacturers.

Finally, based on the above thorough research process, an in-depth analysis was carried out considering the following aspects: market attractiveness, current & future market trends, market share analysis, SWOT analysis of the company and customer analytics.

Frequently Asked Questions

This FREE sample includes market data points, ranging from trend analyses to market estimates & forecasts. See for yourself.
Or view our licence options:
Tailor made solutions just for you
80% of our clients seek made-to-order reports. How do you want us to tailor yours?
OUR CLIENTS


