This report was recently updated on August 14 2025 with the latest and most recent
market numbers
Global Nuclear Powered Battery Market Size, Trends & Analysis - Forecasts to 2029 By Type (Junction Type Battery and Self-reciprocating Cantilever), By Conversion (Thermal Conversion and Non-thermal Conversion), By Application (Automotive, Residential, Commercial, Industrial, and Others), and By Region (North America, Asia Pacific, Central and South America, Europe, and Middle East and Africa), Competitive Landscape, Company Market Share Analysis, and End User Analysis
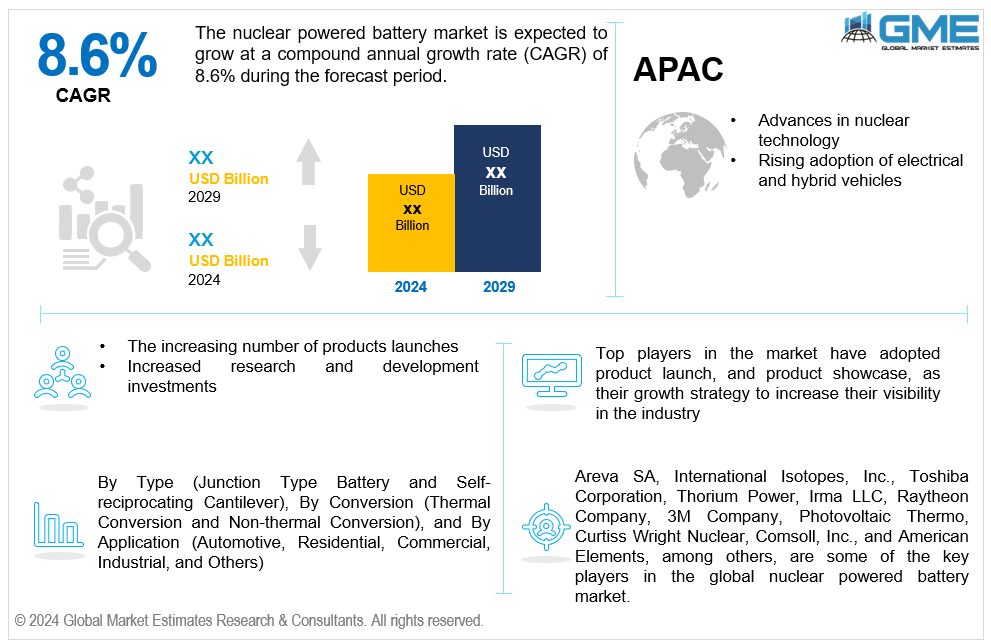
The global nuclear powered battery market is estimated to exhibit a CAGR of 8.6% from 2024 to 2029.
The primary factors propelling the market growth are the advances in nuclear technology and the rising adoption of electric and hybrid vehicles. High-energy-density batteries are necessary for the effective storage and delivery of power in electric and hybrid cars. Compared to ordinary batteries, nuclear-powered batteries have the potential to have a high energy density. These batteries are appropriate for electric vehicles since they can deliver continuous power without frequent recharging. For electric vehicles, nuclear-powered batteries can provide a steady and dependable energy source, alleviating concerns about range anxiety and the requirement for regular recharging. For instance, the International Energy Agency (IEA) reports that in 2022, 14% of all new automobiles sold were electric, an increase from roughly 9% in 2021.
The increasing number of product launches and increased research and development investments are expected to support the market growth. There will be a greater variety of options accessible to customers as new products enter the market. Due to this diversity, potential customers can select nuclear-powered batteries with more options to meet their requirements, such as size, power output, or other features. This can drive overall market growth by attracting new customers who might not have considered nuclear batteries. For instance, Beijing-based startup Betavolt unveiled a nuclear battery in January 2024 that claims to produce electricity for an incredible 50 years without requiring maintenance or charge.
Rising public acceptance of nuclear technology and increasing global energy demands propel market growth. Reliable and consistent power sources are more important as global energy demands grow to fulfill the needs of diverse communities, businesses, and infrastructure projects. As they provide a consistent and uninterrupted power source, nuclear-powered batteries are a desirable choice for applications where dependability is crucial. Moreover, nuclear power reduces reliance on foreign fuels and unstable energy markets; it can improve energy security and independence.
The use of nuclear-powered batteries can significantly aid the grid's ability to incorporate renewable energy sources. There is an opportunity to improve grid stability and dependability by using nuclear batteries to store extra energy produced by renewable sources during times of low demand and release it during peak hours. Moreover, with plans for long-duration missions to the Moon, Mars, and beyond, as well as a resurgent interest in space exploration, nuclear-powered batteries have an opportunity to offer effective and durable power solutions for spacecraft, habitats, and scientific instruments.
However, the high cost of nuclear batteries and limited availability of fuel sources such as plutonium-238 hinder the market growth.
The junction type battery segment is expected to hold the largest share of the market over the forecast period. Compared to other varieties, junction-type nuclear batteries usually offer higher output and efficiency. They can effectively transform the energy generated by radioactive decay into electrical power, which makes them appropriate for a range of applications requiring a significant power source.
The self-reciprocating cantilever segment is expected to be the fastest-growing segment in the market from 2024-2029. Due to their compact size and lightweight, self-replicating cantilever nuclear batteries are well suited for smaller applications where weight and space are critical considerations. Numerous wearables, medical implants, sensors, and other small devices can be equipped with these batteries, opening up a world of portable and mobile uses.
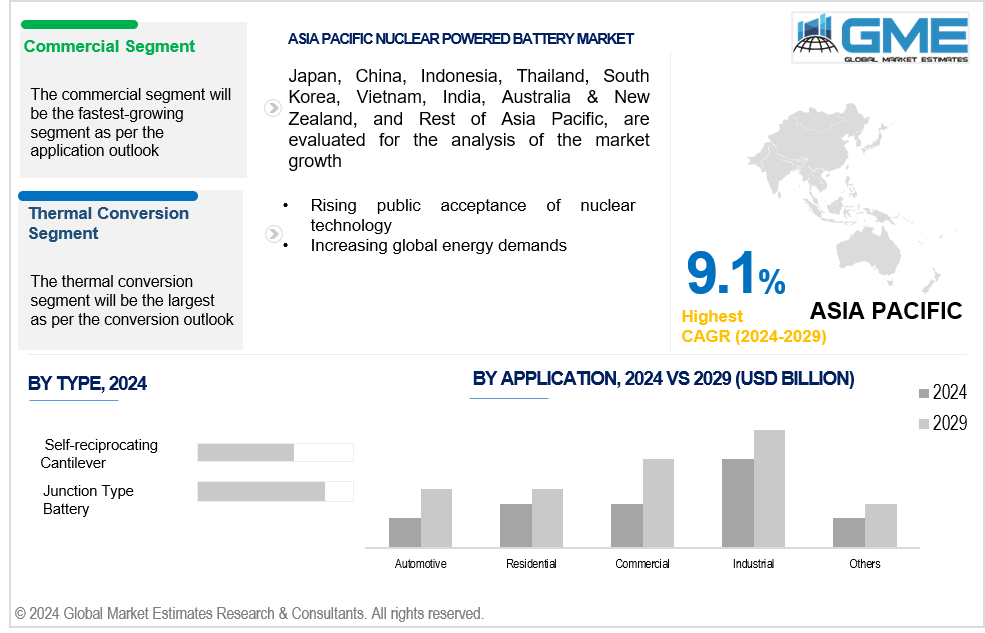
The thermal conversion segment is expected to hold the largest share of the market over the forecast period. Thermal conversion nuclear batteries are appropriate for applications needing constant energy output over prolonged periods as they offer a stable and continuous power supply. This reliability is crucial for powering critical systems in remote or inaccessible locations where frequent maintenance or replacement is impractical.
The non-thermal conversion segment is anticipated to be the fastest-growing segment in the market from 2024-2029. Non-thermal conversion nuclear batteries usually require less maintenance since they do not rely on intricate heat transfer systems and have fewer moving parts. This feature lowers operating costs and increases reliability by reducing the need for regular servicing or replacement.
The industrial segment is expected to hold the largest share of the market over the forecast period. Industries frequently need a consistent and dependable power source for various uses, including data logging, control systems, and monitoring. Since they provide a consistent and uninterrupted power source, nuclear-powered batteries are a good fit for industrial settings where downtime can be expensive.
The commercial segment is anticipated to be the fastest-growing segment in the market from 2024-2029. Nuclear batteries have become safer, more economical, and more efficient due to technological advancements. These developments have made the use of nuclear-powered batteries more feasible for a range of commercial applications, including space exploration, remote monitoring systems, and telephony.
North America is expected to be the largest region in the global market. The expansion of space exploration and defense programs is driving market growth in this region. Nuclear batteries provide a consistent power supply for satellites, space probes, and remote military installations, driving demand in these sectors.
Asia Pacific is anticipated to witness rapid growth during the forecast period. The Asia Pacific region is rapidly becoming more urbanized and industrialized, driving up the need for dependable power supplies. Nuclear-powered batteries provide a steady and long-lasting power source for vital applications in sectors including infrastructure development, oil and gas, and telecommunications.
Areva SA, International Isotopes, Inc., Toshiba Corporation, Thorium Power, Irma LLC, Raytheon Company, 3M Company, American Elements, Waldec, Inc., Kurion, Inc., Exide Technologies, Thermo PV, GE Vattenfall, II-VI Marlow TESLA Energy, Photovoltaic Thermo, Curtiss Wright Nuclear, Comsoll, Inc., and American Elements, among others, are some of the key players operating in the global nuclear powered battery market.
Please note: This is not an exhaustive list of companies profiled in the report.
In 2020, Thermo PV introduced a new type of thermoelectric nuclear battery that boosts production and efficiency by using materials that melt at high temperatures.
In August 2020, NDB Technology introduced a novel concept for a nuclear waste-powered battery with a 28,000-year lifespan. Nuclear reactors use radioactive isotopes, which provide energy for the nano-diamond battery.
1 STRATEGIC INSIGHTS ON NEW REVENUE POCKETS
1.1 Strategic Opportunity & Attractiveness Analysis
1.1.1 Hot Revenue Pockets
1.1.2 Market Attractiveness Score
1.1.3 Revenue Impacting Opportunity
1.1.4 High Growing Region/Country
1.1.5 Competitor Analysis
1.1.6 Consumer Analysis
1.2 Global Market Estimates' View
1.3 Strategic Insights across Business Functions
1.3.1 For Chief Executive Officers
1.3.2 For Chief Marketing Officers
1.3.3 For Chief Strategy Officers
1.4 Evaluate the Potential of your Existing Business Lines vs. New Lines to Enter Into
2 TECHNOLOGICAL TRENDS
2.1 Technological Adoption Rate
2.2 Current Trend Impact Analysis
2.3 Future Trend Impact Analysis
3 GLOBAL NUCLEAR POWERED BATTERY MARKET OUTLOOK
3.1 Market Pyramid Analysis
3.1.1 Introduction
3.1.2 Adjacent Market Opportunities
3.1.3 Ancillary Market Opportunities
3.2 Demand Side Analysis
3.2.1 Market Drivers: Impact Analysis
3.2.2 Market Restraints: Impact Analysis
3.2.3 Market Opportunities: Impact Analysis
3.2.4 Market Challenges: Impact Analysis
3.3 Supply Side Analysis
3.3.1 Porter’s Five Forces Analysis
3.3.1.1 Threat of New Entrants
3.3.1.2 Threat of New Substitutes
3.3.1.3 Bargaining Power of Suppliers
3.3.1.4 Bargaining Power of Buyers
3.3.1.5 Intensity of Competitive Rivalry
3.3.2 SWOT Analysis; By Factor (Political & Legal, Economic, and Technological)
3.3.2.1 Political Landscape
3.3.2.2 Economic Landscape
3.3.2.3 Social Landscape
3.3.2.4 Technology Landscape
3.3.3 Value Chain Analysis
3.3.4 Trend Analysis
3.3.5 Gap Analysis
3.3.6 Cost Analysis
4 GLOBAL NUCLEAR POWERED BATTERY MARKET, BY TYPE
4.1 Introduction
4.2 Nuclear Powered Battery Market: Type Scope Key Takeaways
4.3 Revenue Growth Analysis, 2023 & 2029
4.4 Junction Type Battery
4.4.1 Junction Type Battery Market Estimates and Forecast, 2021-2029 (USD Million)
4.5 Self-reciprocating Cantilever
4.5.1 Self-reciprocating Cantilever Market Estimates and Forecast, 2021-2029 (USD Million)
5 GLOBAL NUCLEAR POWERED BATTERY MARKET, BY APPLICATION
5.1 Introduction
5.2 Nuclear Powered Battery Market: Application Scope Key Takeaways
5.3 Revenue Growth Analysis, 2023 & 2029
5.4 Automotive
5.4.1 Automotive Market Estimates and Forecast, 2021-2029 (USD Million)
5.5 Residential
5.5.1 Residential Market Estimates and Forecast, 2021-2029 (USD Million)
5.6 Commercial
5.6.1 Commercial Market Estimates and Forecast, 2021-2029 (USD Million)
5.7 Industrial
5.7.1 Industrial Market Estimates and Forecast, 2021-2029 (USD Million)
5.8 Others
5.8.1 Others Market Estimates and Forecast, 2021-2029 (USD Million)
6 GLOBAL NUCLEAR POWERED BATTERY MARKET, BY CONVERSION
6.1 Introduction
6.2 Nuclear Powered Battery Market: Conversion Scope Key Takeaways
6.3 Revenue Growth Analysis, 2023 & 2029
6.4 Thermal Conversion
6.4.1 Thermal Conversion Market Estimates and Forecast, 2021-2029 (USD Million)
6.5 Non-thermal Conversion
6.5.1 Non-thermal Conversion Market Estimates and Forecast, 2021-2029 (USD Million)
7 GLOBAL NUCLEAR POWERED BATTERY MARKET, BY REGION
7.1 Introduction
7.2 North America Nuclear Powered Battery Market Estimates and Forecast, 2021-2029 (USD Million)
7.2.1 By Type
7.2.2 By Application
7.2.3 By Conversion
7.2.4 By Country
7.2.4.1 U.S. Nuclear Powered Battery Market Estimates and Forecast, 2021-2029 (USD Million)
7.2.4.1.1 By Type
7.2.4.1.2 By Application
7.2.4.1.3 By Conversion
7.2.4.2 Canada Nuclear Powered Battery Market Estimates and Forecast, 2021-2029 (USD Million)
7.2.4.2.1 By Type
7.2.4.2.2 By Application
7.2.4.2.3 By Conversion
7.2.4.3 Mexico Nuclear Powered Battery Market Estimates and Forecast, 2021-2029 (USD Million)
7.2.4.3.1 By Type
7.2.4.3.2 By Application
7.2.4.3.3 By Conversion
7.3 Europe Nuclear Powered Battery Market Estimates and Forecast, 2021-2029 (USD Million)
7.3.1 By Type
7.3.2 By Application
7.3.3 By Conversion
7.3.4 By Country
7.3.4.1 Germany Nuclear Powered Battery Market Estimates and Forecast, 2021-2029 (USD Million)
7.3.4.1.1 By Type
7.3.4.1.2 By Application
7.3.4.1.3 By Conversion
7.3.4.2 U.K. Nuclear Powered Battery Market Estimates and Forecast, 2021-2029 (USD Million)
7.3.4.2.1 By Type
7.3.4.2.2 By Application
7.3.4.2.3 By Conversion
7.3.4.3 France Nuclear Powered Battery Market Estimates and Forecast, 2021-2029 (USD Million)
7.3.4.3.1 By Type
7.3.4.3.2 By Application
7.3.4.3.3 By Conversion
7.3.4.4 Italy Nuclear Powered Battery Market Estimates and Forecast, 2021-2029 (USD Million)
7.3.4.4.1 By Type
7.3.4.4.2 By Application
7.2.4.4.3 By Conversion
7.3.4.5 Spain Nuclear Powered Battery Market Estimates and Forecast, 2021-2029 (USD Million)
7.3.4.5.1 By Type
7.3.4.5.2 By Application
7.2.4.5.3 By Conversion
7.3.4.6 Netherlands Nuclear Powered Battery Market Estimates and Forecast, 2021-2029 (USD Million)
7.3.4.6.1 By Type
7.3.4.6.2 By Application
7.2.4.6.3 By Conversion
7.3.4.7 Rest of Europe Nuclear Powered Battery Market Estimates and Forecast, 2021-2029 (USD Million)
7.3.4.7.1 By Type
7.3.4.7.2 By Application
7.2.4.7.3 By Conversion
7.4 Asia Pacific Nuclear Powered Battery Market Estimates and Forecast, 2021-2029 (USD Million)
7.4.1 By Type
7.4.2 By Application
7.4.3 By Conversion
7.4.4 By Country
7.4.4.1 China Nuclear Powered Battery Market Estimates and Forecast, 2021-2029 (USD Million)
7.4.4.1.1 By Type
7.4.4.1.2 By Application
7.4.4.1.3 By Conversion
7.4.4.2 Japan Nuclear Powered Battery Market Estimates and Forecast, 2021-2029 (USD Million)
7.4.4.2.1 By Type
7.4.4.2.2 By Application
7.4.4.2.3 By Conversion
7.4.4.3 India Nuclear Powered Battery Market Estimates and Forecast, 2021-2029 (USD Million)
7.4.4.3.1 By Type
7.4.4.3.2 By Application
7.4.4.3.3 By Conversion
7.4.4.4 South Korea Nuclear Powered Battery Market Estimates and Forecast, 2021-2029 (USD Million)
7.4.4.4.1 By Type
7.4.4.4.2 By Application
7.4.4.4.3 By Conversion
7.4.4.5 Singapore Nuclear Powered Battery Market Estimates and Forecast, 2021-2029 (USD Million)
7.4.4.5.1 By Type
7.4.4.5.2 By Application
7.4.4.5.3 By Conversion
7.4.4.6 Malaysia Nuclear Powered Battery Market Estimates and Forecast, 2021-2029 (USD Million)
7.4.4.6.1 By Type
7.4.4.6.2 By Application
7.4.4.6.3 By Conversion
7.4.4.7 Thailand Nuclear Powered Battery Market Estimates and Forecast, 2021-2029 (USD Million)
7.4.4.7.1 By Type
7.4.4.7.2 By Application
7.4.4.7.3 By Conversion
7.4.4.8 Indonesia Nuclear Powered Battery Market Estimates and Forecast, 2021-2029 (USD Million)
7.4.4.8.1 By Type
7.4.4.8.2 By Application
7.4.4.8.3 By Conversion
7.4.4.9 Vietnam Nuclear Powered Battery Market Estimates and Forecast, 2021-2029 (USD Million)
7.4.4.9.1 By Type
7.4.4.9.2 By Application
7.4.4.9.3 By Conversion
7.4.4.10 Taiwan Nuclear Powered Battery Market Estimates and Forecast, 2021-2029 (USD Million)
7.4.4.10.1 By Type
7.4.4.10.2 By Application
7.4.4.10.3 By Conversion
7.4.4.11 Rest of Asia Pacific Nuclear Powered Battery Market Estimates and Forecast, 2021-2029 (USD Million)
7.4.4.11.1 By Type
7.4.4.11.2 By Application
7.4.4.11.3 By Conversion
7.5 Middle East and Africa Nuclear Powered Battery Market Estimates and Forecast, 2021-2029 (USD Million)
7.5.1 By Type
7.5.2 By Application
7.5.3 By Conversion
7.5.4 By Country
7.5.4.1 Saudi Arabia Nuclear Powered Battery Market Estimates and Forecast, 2021-2029 (USD Million)
7.5.4.1.1 By Type
7.5.4.1.2 By Application
7.5.4.1.3 By Conversion
7.5.4.2 U.A.E. Nuclear Powered Battery Market Estimates and Forecast, 2021-2029 (USD Million)
7.5.4.2.1 By Type
7.5.4.2.2 By Application
7.5.4.2.3 By Conversion
7.5.4.3 Israel Nuclear Powered Battery Market Estimates and Forecast, 2021-2029 (USD Million)
7.5.4.3.1 By Type
7.5.4.3.2 By Application
7.5.4.3.3 By Conversion
7.5.4.4 South Africa Nuclear Powered Battery Market Estimates and Forecast, 2021-2029 (USD Million)
7.5.4.4.1 By Type
7.5.4.4.2 By Application
7.5.4.4.3 By Conversion
7.5.4.5 Rest of Middle East and Africa Nuclear Powered Battery Market Estimates and Forecast, 2021-2029 (USD Million)
7.5.4.5.1 By Type
7.5.4.5.2 By Application
7.5.4.5.2 By Conversion
7.6 Central and South America Nuclear Powered Battery Market Estimates and Forecast, 2021-2029 (USD Million)
7.6.1 By Type
7.6.2 By Application
7.6.3 By Conversion
7.6.4 By Country
7.6.4.1 Brazil Nuclear Powered Battery Market Estimates and Forecast, 2021-2029 (USD Million)
7.6.4.1.1 By Type
7.6.4.1.2 By Application
7.6.4.1.3 By Conversion
7.6.4.2 Argentina Nuclear Powered Battery Estimates and Forecast, 2021-2029 (USD Million)
7.6.4.2.1 By Type
7.6.4.2.2 By Application
7.6.4.2.3 By Conversion
7.6.4.3 Chile Nuclear Powered Battery Market Estimates and Forecast, 2021-2029 (USD Million)
7.6.4.3.1 By Type
7.6.4.3.2 By Application
7.6.4.3.3 By Conversion
7.6.4.4 Rest of Central and South America Nuclear Powered Battery Market Estimates and Forecast, 2021-2029 (USD Million)
7.6.4.4.1 By Type
7.6.4.4.2 By Application
7.6.4.4.3 By Conversion
8 COMPETITIVE LANDCAPE
8.1 Company Market Share Analysis
8.2 Four Quadrant Positioning Matrix
8.2.1 Market Leaders
8.2.2 Market Visionaries
8.2.3 Market Challengers
8.2.4 Niche Market Players
8.3 Vendor Landscape
8.3.1 North America
8.3.2 Europe
8.3.3 Asia Pacific
8.3.4 Rest of the World
8.4 Company Profiles
8.4.1 Areva SA
8.4.1.1 Business Description & Financial Analysis
8.4.1.2 SWOT Analysis
8.4.1.3 Products & Services Offered
8.4.1.4 Strategic Alliances between Business Partners
8.4.2 International Isotopes, Inc.
8.4.2.1 Business Description & Financial Analysis
8.4.2.2 SWOT Analysis
8.4.2.3 Products & Services Offered
8.4.2.4 Strategic Alliances between Business Partners
8.4.3 Toshiba Corporation
8.4.3.1 Business Description & Financial Analysis
8.4.3.2 SWOT Analysis
8.4.3.3 Products & Services Offered
8.4.3.4 Strategic Alliances between Business Partners
8.4.4 Thorium Power
8.4.4.1 Business Description & Financial Analysis
8.4.4.2 SWOT Analysis
8.4.4.3 Products & Services Offered
8.4.4.4 Strategic Alliances between Business Partners
8.4.5 Irma LLC
8.4.5.1 Business Description & Financial Analysis
8.4.5.2 SWOT Analysis
8.4.5.3 Products & Services Offered
8.4.5.4 Strategic Alliances between Business Partners
8.4.6 Raytheon Company
8.4.6.1 Business Description & Financial Analysis
8.4.6.2 SWOT Analysis
8.4.6.3 Products & Services Offered
8.4.6.4 Strategic Alliances between Business Partners
8.4.7 3M Company
8.4.7.1 Business Description & Financial Analysis
8.4.7.2 SWOT Analysis
8.4.7.3 Products & Services Offered
8.4.8.4 Strategic Alliances between Business Partners
8.4.8 American Elements
8.4.8.1 Business Description & Financial Analysis
8.4.8.2 SWOT Analysis
8.4.8.3 Products & Services Offered
8.4.8.4 Strategic Alliances between Business Partners
8.4.9 3M Company
8.4.9.1 Business Description & Financial Analysis
8.4.9.2 SWOT Analysis
8.4.9.3 Products & Services Offered
8.4.9.4 Strategic Alliances between Business Partners
8.4.10 Kurion, Inc.
8.4.10.1 Business Description & Financial Analysis
8.4.10.2 SWOT Analysis
8.4.10.3 Products & Services Offered
8.4.10.4 Strategic Alliances between Business Partners
8.4.11 Exide Technologies
8.4.11.1 Business Description & Financial Analysis
8.4.11.2 SWOT Analysis
8.4.11.3 Products & Services Offered
8.4.11.4 Strategic Alliances between Business Partners
8.4.12 Thermo PV
8.4.12.1 Business Description & Financial Analysis
8.4.12.2 SWOT Analysis
8.4.12.3 Products & Services Offered
8.4.12.4 Strategic Alliances between Business Partners
8.4.13 GE Vattenfall
8.4.13.1 Business Description & Financial Analysis
8.4.13.2 SWOT Analysis
8.4.13.3 Products & Services Offered
8.4.13.4 Strategic Alliances between Business Partners
8.4.14 II-VI Marlow TESLA Energy
8.4.14.1 Business Description & Financial Analysis
8.4.14.2 SWOT Analysis
8.4.14.3 Products & Services Offered
8.4.14.4 Strategic Alliances between Business Partners
8.4.15 Photovoltaic Thermo
8.4.15.1 Business Description & Financial Analysis
8.4.15.2 SWOT Analysis
8.4.15.3 Products & Services Offered
8.4.15.4 Strategic Alliances between Business Partners
8.4.16 Curtiss Wright Nuclear
8.4.16.1 Business Description & Financial Analysis
8.4.16.2 SWOT Analysis
8.4.16.3 Products & Services Offered
8.4.16.4 Strategic Alliances between Business Partners
8.4.17 Comsoll, Inc.
8.4.17.1 Business Description & Financial Analysis
8.4.17.2 SWOT Analysis
8.4.17.3 Products & Services Offered
8.4.17.4 Strategic Alliances between Business Partners
8.4.18 American Elements
8.4.18.1 Business Description & Financial Analysis
8.4.18.2 SWOT Analysis
8.4.18.3 Products & Services Offered
8.4.18.4 Strategic Alliances between Business Partners
8.4.19 Other Companies
8.4.19.1 Business Description & Financial Analysis
8.4.19.2 SWOT Analysis
8.4.19.3 Products & Services Offered
8.4.19.4 Strategic Alliances between Business Partners
9 RESEARCH METHODOLOGY
9.1 Market Introduction
9.1.1 Market Definition
9.1.2 Market Scope & Segmentation
9.2 Information Procurement
9.2.1 Secondary Research
9.2.1.1 Purchased Databases
9.2.1.2 GMEs Internal Data Repository
9.2.1.3 Secondary Resources & Third Party Perspectives
9.2.1.4 Company Information Sources
9.2.2 Primary Research
9.2.2.1 Various Types of Respondents for Primary Interviews
9.2.2.2 Number of Interviews Conducted throughout the Research Process
9.2.2.3 Primary Stakeholders
9.2.2.4 Discussion Guide for Primary Participants
9.2.3 Expert Panels
9.2.3.1 Expert Panels Across 30+ Industry
9.2.4 Paid Local Experts
9.2.4.1 Paid Local Experts Across 30+ Industry Across each Region
9.3 Market Estimation
9.3.1 Top-Down Approach
9.3.1.1 Macro-Economic Indicators Considered
9.3.1.2 Micro-Economic Indicators Considered
9.3.2 Bottom Up Approach
9.3.2.1 Company Share Analysis Approach
9.3.2.2 Estimation of Potential Product Sales
9.4 Data Triangulation
9.4.1 Data Collection
9.4.2 Time Series, Cross Sectional & Panel Data Analysis
9.4.3 Cluster Analysis
9.5 Analysis and Output
9.5.1 Inhouse AI Based Real Time Analytics Tool
9.5.2 Output From Desk & Primary Research
9.6 Research Assumptions & Limitations
9.7.1 Research Assumptions
9.7.2 Research Limitations
LIST OF TABLES
1 Global Nuclear Powered Battery Market, By Type, 2021-2029 (USD Mllion)
2 Junction Type Battery Market, By Region, 2021-2029 (USD Mllion)
3 Self-reciprocating Cantilever Market, By Region, 2021-2029 (USD Mllion)
4 Global Nuclear Powered Battery Market, By Application, 2021-2029 (USD Mllion)
5 Automotive Market, By Region, 2021-2029 (USD Mllion)
6 Residential Market, By Region, 2021-2029 (USD Mllion)
7 Industrial Market, By Region, 2021-2029 (USD Mllion)
8 Commercial Market, By Region, 2021-2029 (USD Mllion)
9 Others Market, By Region, 2021-2029 (USD Mllion)
10 Global Nuclear Powered Battery Market, By Conversion, 2021-2029 (USD Mllion)
11 Thermal Conversion Market, By Region, 2021-2029 (USD Mllion)
12 Non-thermal Conversion Market, By Region, 2021-2029 (USD Mllion)
13 Regional Analysis, 2021-2029 (USD Mllion)
14 North America Nuclear Powered Battery Market, By Type, 2021-2029 (USD Million)
15 North America Nuclear Powered Battery Market, By Application, 2021-2029 (USD Million)
16 North America Nuclear Powered Battery Market, By Conversion, 2021-2029 (USD Million)
17 North America Nuclear Powered Battery Market, By Country, 2021-2029 (USD Million)
18 U.S Nuclear Powered Battery Market, By Type, 2021-2029 (USD Million)
19 U.S Nuclear Powered Battery Market, By Application, 2021-2029 (USD Million)
20 U.S Nuclear Powered Battery Market, By Conversion, 2021-2029 (USD Million)
21 Canada Nuclear Powered Battery Market, By Type, 2021-2029 (USD Million)
22 Canada Nuclear Powered Battery Market, By Application, 2021-2029 (USD Million)
23 Canada Nuclear Powered Battery Market, By Conversion, 2021-2029 (USD Million)
24 Mexico Nuclear Powered Battery Market, By Type, 2021-2029 (USD Million)
25 Mexico Nuclear Powered Battery Market, By Application, 2021-2029 (USD Million)
26 Mexico Nuclear Powered Battery Market, By Conversion, 2021-2029 (USD Million)
27 Europe Nuclear Powered Battery Market, By Type, 2021-2029 (USD Million)
28 Europe Nuclear Powered Battery Market, By Application, 2021-2029 (USD Million)
29 Europe Nuclear Powered Battery Market, By Conversion, 2021-2029 (USD Million)
30 Europe Nuclear Powered Battery Market, By COUNTRY, 2021-2029 (USD Million)
31 Germany Nuclear Powered Battery Market, By Type, 2021-2029 (USD Million)
32 Germany Nuclear Powered Battery Market, By Application, 2021-2029 (USD Million)
33 Germany Nuclear Powered Battery Market, By Conversion, 2021-2029 (USD Million)
34 U.K. Nuclear Powered Battery Market, By Type, 2021-2029 (USD Million)
35 U.K. Nuclear Powered Battery Market, By Application, 2021-2029 (USD Million)
36 U.K. Nuclear Powered Battery Market, By Conversion, 2021-2029 (USD Million)
37 France Nuclear Powered Battery Market, By Type, 2021-2029 (USD Million)
38 France Nuclear Powered Battery Market, By Application, 2021-2029 (USD Million)
39 France Nuclear Powered Battery Market, By Conversion, 2021-2029 (USD Million)
40 Italy Nuclear Powered Battery Market, By Type, 2021-2029 (USD Million)
41 Italy Nuclear Powered Battery Market, By End Use , 2021-2029 (USD Million)
42 Italy Nuclear Powered Battery Market, By Conversion, 2021-2029 (USD Million)
43 Spain Nuclear Powered Battery Market, By Type, 2021-2029 (USD Million)
44 Spain Nuclear Powered Battery Market, By Application, 2021-2029 (USD Million)
45 Spain Nuclear Powered Battery Market, By Conversion, 2021-2029 (USD Million)
46 Rest Of Europe Nuclear Powered Battery Market, By Type, 2021-2029 (USD Million)
47 Rest Of Europe Nuclear Powered Battery Market, By Application, 2021-2029 (USD Million)
48 Rest of Europe Nuclear Powered Battery Market, By Conversion, 2021-2029 (USD Million)
49 Asia Pacific Nuclear Powered Battery Market, By Type, 2021-2029 (USD Million)
50 Asia Pacific Nuclear Powered Battery Market, By Application, 2021-2029 (USD Million)
51 Asia Pacific Nuclear Powered Battery Market, By Conversion, 2021-2029 (USD Million)
52 Asia Pacific Nuclear Powered Battery Market, By Country, 2021-2029 (USD Million)
53 China Nuclear Powered Battery Market, By Type, 2021-2029 (USD Million)
54 China Nuclear Powered Battery Market, By Application, 2021-2029 (USD Million)
55 China Nuclear Powered Battery Market, By Conversion, 2021-2029 (USD Million)
56 India Nuclear Powered Battery Market, By Type, 2021-2029 (USD Million)
57 India Nuclear Powered Battery Market, By Application, 2021-2029 (USD Million)
58 India Nuclear Powered Battery Market, By Conversion, 2021-2029 (USD Million)
59 Japan Nuclear Powered Battery Market, By Type, 2021-2029 (USD Million)
60 Japan Nuclear Powered Battery Market, By Application, 2021-2029 (USD Million)
61 Japan Nuclear Powered Battery Market, By Conversion, 2021-2029 (USD Million)
62 South Korea Nuclear Powered Battery Market, By Type, 2021-2029 (USD Million)
63 South Korea Nuclear Powered Battery Market, By Application, 2021-2029 (USD Million)
64 South Korea Nuclear Powered Battery Market, By Conversion, 2021-2029 (USD Million)
65 Singapore Nuclear Powered Battery Market, By Type, 2021-2029 (USD Million)
66 Singapore Nuclear Powered Battery Market, By Application, 2021-2029 (USD Million)
67 Singapore Nuclear Powered Battery Market, By Conversion, 2021-2029 (USD Million)
68 Malaysia Nuclear Powered Battery Market, By Type, 2021-2029 (USD Million)
69 Malaysia Nuclear Powered Battery Market, By Application, 2021-2029 (USD Million)
70 Malaysia Nuclear Powered Battery Market, By Conversion, 2021-2029 (USD Million)
71 Thailand Nuclear Powered Battery Market, By Type, 2021-2029 (USD Million)
72 Thailand Nuclear Powered Battery Market, By Application, 2021-2029 (USD Million)
73 Thailand Nuclear Powered Battery Market, By Conversion, 2021-2029 (USD Million)
74 Indonesia Nuclear Powered Battery Market, By Type, 2021-2029 (USD Million)
75 Indonesia Nuclear Powered Battery Market, By Application, 2021-2029 (USD Million)
76 Indonesia Nuclear Powered Battery Market, By Conversion, 2021-2029 (USD Million)
77 Vietnam Nuclear Powered Battery Market, By Type, 2021-2029 (USD Million)
78 Vietnam Nuclear Powered Battery Market, By Application, 2021-2029 (USD Million)
79 Vietnam Nuclear Powered Battery Market, By Conversion, 2021-2029 (USD Million)
80 Taiwan Nuclear Powered Battery Market, By Type, 2021-2029 (USD Million)
81 Taiwan Nuclear Powered Battery Market, By Application, 2021-2029 (USD Million)
82 Taiwan Nuclear Powered Battery Market, By Conversion, 2021-2029 (USD Million)
83 Rest of Asia Pacific Nuclear Powered Battery Market, By Type, 2021-2029 (USD Million)
84 Rest of Asia Pacific Nuclear Powered Battery Market, By Application, 2021-2029 (USD Million)
85 Rest of Asia Pacific Nuclear Powered Battery Market, By Conversion, 2021-2029 (USD Million)
86 Middle East and Africa Nuclear Powered Battery Market, By Type, 2021-2029 (USD Million)
87 Middle East and Africa Nuclear Powered Battery Market, By Application, 2021-2029 (USD Million)
88 Middle East and Africa Nuclear Powered Battery Market, By Conversion, 2021-2029 (USD Million)
89 Middle East and Africa Nuclear Powered Battery Market, By Country, 2021-2029 (USD Million)
90 Saudi Arabia Nuclear Powered Battery Market, By Type, 2021-2029 (USD Million)
91 Saudi Arabia Nuclear Powered Battery Market, By Application, 2021-2029 (USD Million)
92 Saudi Arabia Nuclear Powered Battery Market, By Conversion, 2021-2029 (USD Million)
93 UAE Nuclear Powered Battery Market, By Type, 2021-2029 (USD Million)
94 UAE Nuclear Powered Battery Market, By Application, 2021-2029 (USD Million)
95 UAE Nuclear Powered Battery Market, By Conversion, 2021-2029 (USD Million)
96 Israel Nuclear Powered Battery Market, By Type, 2021-2029 (USD Million)
97 Israel Nuclear Powered Battery Market, By Application, 2021-2029 (USD Million)
98 Israel Nuclear Powered Battery Market, By Conversion, 2021-2029 (USD Million)
99 South Africa Nuclear Powered Battery Market, By Type, 2021-2029 (USD Million)
100 South Africa Nuclear Powered Battery Market, By Application, 2021-2029 (USD Million)
101 South Africa Nuclear Powered Battery Market, By Conversion, 2021-2029 (USD Million)
102 Rest of Middle East and Africa Nuclear Powered Battery Market, By Type, 2021-2029 (USD Million)
103 Rest of Middle East and Africa Nuclear Powered Battery Market, By Application, 2021-2029 (USD Million)
104 Rest of Middle East and Africa Nuclear Powered Battery Market, By Conversion, 2021-2029 (USD Million)
105 Central and South America Nuclear Powered Battery Market, By Type, 2021-2029 (USD Million)
106 Central and South America Nuclear Powered Battery Market, By Application, 2021-2029 (USD Million)
107 Central and South America Nuclear Powered Battery Market, By Conversion, 2021-2029 (USD Million)
108 Central and South America Nuclear Powered Battery Market, By Country, 2021-2029 (USD Million)
109 Brazil Nuclear Powered Battery Market, By Type, 2021-2029 (USD Million)
110 Brazil Nuclear Powered Battery Market, By Application, 2021-2029 (USD Million)
111 Brazil Nuclear Powered Battery Market, By Conversion, 2021-2029 (USD Million)
112 Argentina Nuclear Powered Battery Market, By Type, 2021-2029 (USD Million)
113 Argentina Nuclear Powered Battery Market, By Application, 2021-2029 (USD Million)
114 Argentina Nuclear Powered Battery Market, By Conversion, 2021-2029 (USD Million)
115 Chile Nuclear Powered Battery Market, By Type, 2021-2029 (USD Million)
116 Chile Nuclear Powered Battery Market, By Application, 2021-2029 (USD Million)
117 Chile Nuclear Powered Battery Market, By Conversion, 2021-2029 (USD Million)
118 Rest of Central and South America Nuclear Powered Battery Market, By Type, 2021-2029 (USD Million)
119 Rest of Central and South America Nuclear Powered Battery Market, By Application, 2021-2029 (USD Million)
120 Rest of Central and South America Nuclear Powered Battery Market, By Conversion, 2021-2029 (USD Million)
121 Areva SA: Products & Services Offering
122 International Isotopes, Inc.: Products & Services Offering
123 Toshiba Corporation: Products & Services Offering
124 Thorium Power: Products & Services Offering
125 Irma LLC: Products & Services Offering
126 ENGIE: Products & Services Offering
127 3M Company : Products & Services Offering
128 American Elements: Products & Services Offering
129 3M Company, Inc: Products & Services Offering
130 Kurion, Inc.: Products & Services Offering
131 Exide Technologies: Products & Services Offering
132 Thermo PV: Products & Services Offering
133 GE Vattenfall: Products & Services Offering
134 II-VI Marlow TESLA Energy: Products & Services Offering
135 Curtiss Wright Nuclear: Products & Services Offering
136 Comsoll, Inc.: Products & Services Offering
137 American Elements: Products & Services Offering
138 Photovoltaic Thermo: Products & Services Offering
139 Other Companies: Products & Services Offering
LIST OF FIGURES
1 Global Nuclear Powered Battery Market Overview
2 Global Nuclear Powered Battery Market Value From 2021-2029 (USD Mllion)
3 Global Nuclear Powered Battery Market Share, By Type (2023)
4 Global Nuclear Powered Battery Market Share, By Application (2023)
5 Global Nuclear Powered Battery Market Share, By Conversion (2023)
6 Global Nuclear Powered Battery Market, By Region (Asia Pacific Market)
7 Technological Trends In Global Nuclear Powered Battery Market
8 Four Quadrant Competitor Positioning Matrix
9 Impact Of Macro & Micro Indicators On The Market
10 Impact Of Key Drivers On The Global Nuclear Powered Battery Market
11 Impact Of Challenges On The Global Nuclear Powered Battery Market
12 Porter’s Five Forces Analysis
13 Global Nuclear Powered Battery Market: By Type Scope Key Takeaways
14 Global Nuclear Powered Battery Market, By Type Segment: Revenue Growth Analysis
15 Junction Type Battery Market, By Region, 2021-2029 (USD Mllion)
16 Self-reciprocating Cantilever Market, By Region, 2021-2029 (USD Mllion)
17 Global Nuclear Powered Battery Market: By Application Scope Key Takeaways
18 Global Nuclear Powered Battery Market, By Application Segment: Revenue Growth Analysis
19 Automotive Market, By Region, 2021-2029 (USD Mllion)
20 Residential Market, By Region, 2021-2029 (USD Mllion)
21 Industrial Market, By Region, 2021-2029 (USD Mllion)
22 CommercialMarket, By Region, 2021-2029 (USD Mllion)
23 Others Market, By Region, 2021-2029 (USD Mllion)
24 Global Nuclear Powered Battery Market: By Conversion Scope Key Takeaways
25 Global Nuclear Powered Battery Market, By Conversion Segment: Revenue Growth Analysis
26 Thermal Conversion Market, By Region, 2021-2029 (USD Mllion)
27 Non-thermal Conversion Market, By Region, 2021-2029 (USD Mllion)
28 Regional Segment: Revenue Growth Analysis
29 Global Nuclear Powered Battery Market: Regional Analysis
30 North America Nuclear Powered Battery Market Overview
31 North America Nuclear Powered Battery Market, By Type
32 North America Nuclear Powered Battery Market, By Application
33 North America Nuclear Powered Battery Market, By Conversion
34 North America Nuclear Powered Battery Market, By Country
35 U.S. Nuclear Powered Battery Market, By Type
36 U.S. Nuclear Powered Battery Market, By Application
37 U.S. Nuclear Powered Battery Market, By Conversion
38 Canada Nuclear Powered Battery Market, By Type
39 Canada Nuclear Powered Battery Market, By Application
40 Canada Nuclear Powered Battery Market, By Conversion
41 Mexico Nuclear Powered Battery Market, By Type
42 Mexico Nuclear Powered Battery Market, By Application
43 Mexico Nuclear Powered Battery Market, By Conversion
44 Four Quadrant Positioning Matrix
45 Company Market Share Analysis
46 Areva SA: Company Snapshot
47 Areva SA: SWOT Analysis
48 Areva SA: Geographic Presence
49 International Isotopes, Inc.: Company Snapshot
50 International Isotopes, Inc.: SWOT Analysis
51 International Isotopes, Inc.: Geographic Presence
52 Toshiba Corporation: Company Snapshot
53 Toshiba Corporation: SWOT Analysis
54 Toshiba Corporation: Geographic Presence
55 Thorium Power: Company Snapshot
56 Thorium Power: Swot Analysis
57 Thorium Power: Geographic Presence
58 Irma LLC: Company Snapshot
59 Irma LLC: SWOT Analysis
60 Irma LLC: Geographic Presence
61 Raytheon Company: Company Snapshot
62 Raytheon Company: SWOT Analysis
63 Raytheon Company: Geographic Presence
64 3M Company : Company Snapshot
65 3M Company : SWOT Analysis
66 3M Company : Geographic Presence
67 American Elements: Company Snapshot
68 American Elements: SWOT Analysis
69 American Elements: Geographic Presence
70 3M Company, Inc.: Company Snapshot
71 3M Company, Inc.: SWOT Analysis
72 3M Company, Inc.: Geographic Presence
73 Kurion, Inc.: Company Snapshot
74 Kurion, Inc.: SWOT Analysis
75 Kurion, Inc.: Geographic Presence
76 Exide Technologies: Company Snapshot
77 Exide Technologies: SWOT Analysis
78 Exide Technologies: Geographic Presence
79 Thermo PV: Company Snapshot
80 Thermo PV: SWOT Analysis
81 Thermo PV: Geographic Presence
82 GE Vattenfall: Company Snapshot
83 GE Vattenfall: SWOT Analysis
84 GE Vattenfall: Geographic Presence
85 II-VI Marlow TESLA Energy: Company Snapshot
86 II-VI Marlow TESLA Energy: SWOT Analysis
87 II-VI Marlow TESLA Energy: Geographic Presence
88 Curtiss Wright Nuclear: Company Snapshot
89 Curtiss Wright Nuclear: SWOT Analysis
90 Curtiss Wright Nuclear: Geographic Presence
91 Comsoll, Inc.: Company Snapshot
92 Comsoll, Inc.: SWOT Analysis
93 Comsoll, Inc.: Geographic Presence
94 American Elements: Company Snapshot
95 American Elements: SWOT Analysis
96 American Elements: Geographic Presence
97 Photovoltaic Thermo: Company Snapshot
98 Photovoltaic Thermo: SWOT Analysis
99 Photovoltaic Thermo: Geographic Presence
100 Other Companies: Company Snapshot
101 Other Companies: SWOT Analysis
102 Other Companies: Geographic Presence
The Global Nuclear Powered Battery Market has been studied from the year 2019 till 2029. However, the CAGR provided in the report is from the year 2024 to 2029. The research methodology involved three stages: Desk research, Primary research, and Analysis & Output from the entire research process.

The desk research involved a robust background study which meant referring to paid and unpaid databases to understand the market dynamics; mapping contracts from press releases; identifying the key players in the market, studying their product portfolio, competition level, annual reports/SEC filings & investor presentations; and learning the demand and supply-side analysis for the Nuclear Powered Battery Market.

The primary research activity included telephonic conversations with more than 50 tier 1 industry consultants, distributors, and end-use product manufacturers.

Finally, based on the above thorough research process, an in-depth analysis was carried out considering the following aspects: market attractiveness, current & future market trends, market share analysis, SWOT analysis of the company and customer analytics.

Frequently Asked Questions

This FREE sample includes market data points, ranging from trend analyses to market estimates & forecasts. See for yourself.
Or view our licence options:
Tailor made solutions just for you
80% of our clients seek made-to-order reports. How do you want us to tailor yours?
OUR CLIENTS


